13100 US Hwy 68 East · Hardin, KY
Flood risk 1/10 · Minimal
- FEMA flood zone
- X (unshaded)
- Chance of flooding over 30 yrs
- 0.0%
- Est. flood insurance / yr
- $507 – $1,088
Fire risk 1/10 · Minimal
- Est. fire insurance / yr
- $839 – $1,559
Heat risk 5/10 · Moderate
- Hot days now (above 109°F)
- 7 days/yr
- Hot days in 30 yrs
- 20 days/yr
Wind risk 3/10 · Minor
- Chance of severe wind over 30 yrs
- 7.0%
Air-quality risk 1/10 · Minimal
- Unhealthy air days now
- 0 days/yr
- Unhealthy air days in 30 yrs
- 0 days/yr
Risk factors via First Street. Map © Google.
Why this score? — see what drove the D+ grade
The composite is a weighted blend of 9 inputs, each scored 0–100. Each bar is that input's sub-score; the figure is the points it added to the 100-point composite (weight × sub-score).
- ARV discount +15.0/15.0
- Appreciation +10.0/10.0
- Cash flow +8.7/30.0
- Schools +2.9/10.0
- Livability +2.7/5.0
- Rent growth +2.5/5.0
- Condition / age +2.5/5.0
- DSCR +2.4/10.0
- 1% rule +1.5/10.0
$215,000
🖨 Deal sheet 📄 Offer letter ✓ Due diligence
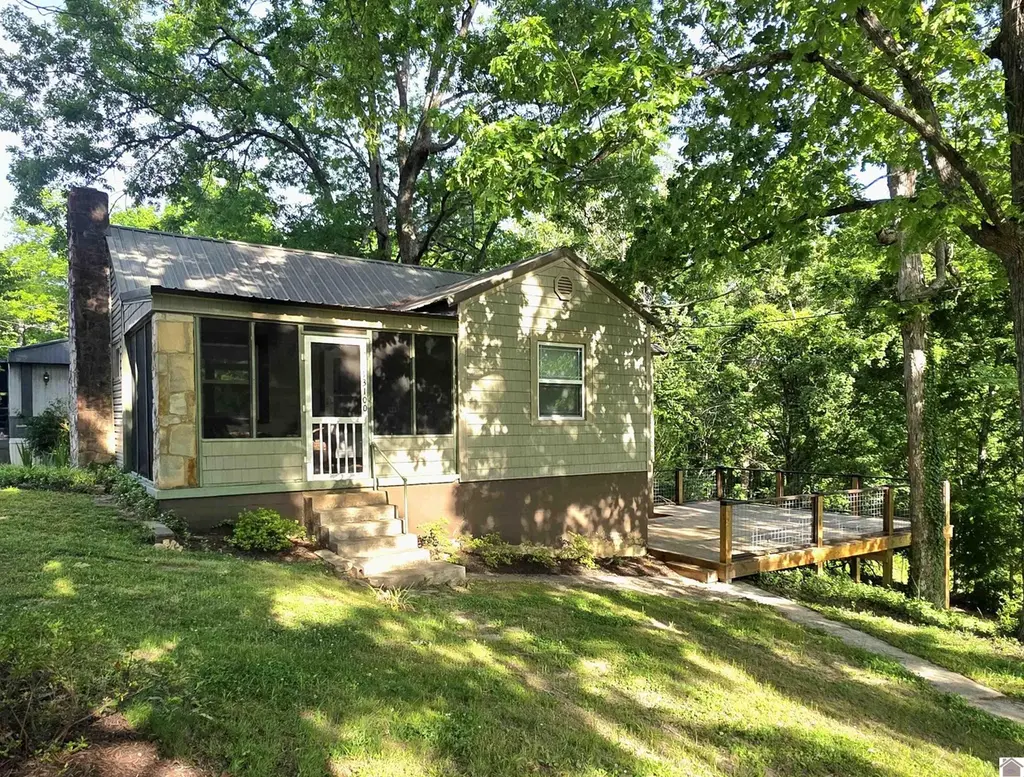
Listing remarks
Turnkey and fully furnished in the Kentucky Lake area. Beautifully updated home featuring the Metal Roof, New Windows, new siding added 3 years ago. A nice new Deck. Perfect for a getaway or permanent residence. Lake access less than 1/4 mile from house is Sportmans boat ramp in the Johnathan Creek area. You will enjoy morning coffee in the screened porch area. Plenty of parking in front of the home. You will enjoy outdoor entertaining and cookouts. This property offers 3BR/1 Bath. The arched doorways add a timeless elegant flow to the home. They pair beautifully with the hardwood floors. there are two bedroom are on the main level. The Basement Interior, and The utility nook now has a stac
Key facts
- Metal roof
- New siding
- Screened porch
Tags
Property features AI
Exterior
- Parking: Gravel parking
- Utilities: Public water; Septic tank sewer; Cable available
- Home design: Single-family residence; Residential property
- Construction: Frame construction with vinyl siding; Metal roof; Finished basement area below grade
- Exterior features: Level, wooded lot; Screened patio/porch
Interior
- Kitchen: Cooktop; Microwave; Refrigerator
- Flooring: Carpet; Concrete; Wood
- Bathrooms: 1 full bathroom
- Heating & cooling: Heat pump heating; Central air conditioning
- Interior features: Fireplace in the family room; Screened patio/porch
- Laundry & utility: Dryer; Laundry located in basement; Electric water heater
Neighborhood map
What this means for you Summary
Snapshot
- This is a 2-bed/1.0-bath other listed at $215k.
Deal economics
- At list price, monthly cash flow is $-181 ($-2k/yr) — negative.
- To cash-flow at today's rent, offer at most $183k (14.9% below list).
- To meet the 1% rule (rent ≥ 1% of price), the offer needs to be $140k (34.7% below list).
- Recommended offer: $140k (34.7% below list) — sets the bar for 1% rule.
- Cap rate 5.3% vs local median 4.0% in Hardin — top-decile yield for the area; either an underpriced asset or a hidden risk that comps aren't pricing in. Stress-test before assuming the spread holds.
Location & tenants
- Location reads 54/100 on livability (#476 in KY) — a working-class tenant base; expect higher turnover. Strengths: cost of living A+, housing A-; Watch: amenities F, commute F, employment F.
- Marshall County (rural): math 29% / reading 38% proficiency, ranked #73 of 165 in KY (top 44%) — families likely to look elsewhere, expect single-tenant / working-renter base with shorter leases.
- Zoned schools: Jonathan Elementary School (math 17% / reading 32%, grade F, #489 of 676 statewide, top 76%, 238 students, 72% FRL); North Marshall Middle School (math 31% / reading 44%, grade F, #73 of 217 statewide, top 36%, 497 students, 45% FRL) — zoned schools average 59% FRL vs 43% district-wide (16 pts higher); higher-poverty schools than district average — tighter screening recommended.
- Market conditions: 178 active listings in the ZIP; 121 units permitted in Marshall County in 2024 (5 in 5+ unit buildings).
Forward outlook
- In year one you build about $23k of equity ($1k loan paydown + $22k appreciation (10.0% local appreciation)).
- Marshall County population projected to shrink 9% by 2050 — rents likely to lag national; underwrite the cash flow, not the appreciation.
- By year 2, paydown + projected appreciation supports a ~$37k cash-out refi (75% LTV) — recoverable capital for the next deal without selling this one.
Negotiation context
- It's been on market 46 days — a 3% lower offer ($209k) is reasonable based on typical stale-listing flexibility.
- Current owner paid $43k; list at $215k implies a 401% gain — meaningful room to come down on a strong offer.
Risks & watch-outs
- Watch-outs: built in 1935 — expect roof / HVAC / electrical / plumbing capex.
- Climate carrying-cost: extreme-heat days projected 7→20/yr by 2055 (HVAC capex compounding) — expect insurance premiums to compound above CPI over the hold.
Questions for the listing agent
- What do current leases actually rent for vs. the listed asking? Can we see a recent rent roll and the last 12 months of T-12 income?
- It's been on market 46 days. Have you received any prior offers? Is the seller open to a 35% concession, seller financing, or rate buy-down credit?
- Built in 1935 — when were the roof, HVAC, electrical panel, plumbing, and water heater last replaced?
- Is there a deadline driving the sale (1031 exchange, divorce, estate, relocation)? That informs how much negotiation room exists.
- Schools are F-rated, which usually means shorter tenancies and higher turnover. Who's the typical renter profile here, and what's been the actual vacancy rate?
- The area grade is low — what's the realistic commute time and amenity access for the typical tenant pool here? Any planned neighborhood developments (good or bad) we should know about?
- What's the average days-on-market for RENTAL listings here right now (not sales)? A rising rental-DOM trend means longer vacancies and softer asking-rent achievability than the comps imply.
- What's the recent tenant-quality profile in this submarket — average credit score on applications, eviction rate, late-payment / NSF rate, and stable-employment percentage? A property-management company in the area should have these aggregated.
- How much new for-sale + rental construction is in the pipeline within 1–3 miles? Heavy new supply typically softens prices + rents 12–24 months out; constrained supply supports both.
Investment metrics
- 1% rule
- 0.65% ✗
- Cap rate
- 5.28%
- Cash-on-cash
- -3.61%
- DSCR
- 0.84
- GRM
- 12.8
CMA / ARV
- ARV (median comp)
- $289,000
- List price
- $215,000
- Delta
- -25.61%
- Verdict
- UNDERPRICED
- Comps
- 5 within 1.0 mi
Projected returns pro-forma
10.0% appreciation · 3.0% rent growth · sell at horizon
- IRR
- 21.7%
- Equity multiple
- 2.75×
- Total profit
- $105,446
- Equity at exit
- $193,689
- IRR
- 19.5%
- Equity multiple
- 6.31×
- Total profit
- $319,408
- Equity at exit
- $417,698
Cash invested: $60,200 (down + closing). Projections, not guarantees.
Landlord ↔ Tenant lean methodology
- Overall (STATE)
- 83 Strongly Landlord-Friendly
- State Kentucky
- 83 Strongly Landlord-Friendly · R+16
- County
- — inherits STATE
- City
- — inherits STATE
ZIP-level market 42025
- Home prices YoY
- 7.1%
- Active inventory
- 178
- Price-to-rent
- 12.8×
Monthly cashflow live
- Estimated rent
- $1,405 medium interval (Pro) →
- Mortgage (P&I)
- −$1,127
- Tax from tax record
- −$74 /mo · $887/yr
- Insurance
- −$90
- HOA
- −$0
- Vacancy / Maint / Mgmt
- −$295
- Net cashflow
- $-181
Break-even live
UW: 25.0% down · 7.5% · 30yr · 1.5% tax · 5.0% vac · 8.0% maint · 8.0% mgmt
Financing live
Cash to close
- Down payment
- $53,750
- Closing costs
- $6,450
- Reserves months
- —
- Total cash needed
- —
Loan-product check · same deal, 3 products live
Conventional
25% down · 7.5% · 30yr
- Down + closing
- —
- Monthly P&I
- —
- Monthly cashflow
- —
- DSCR
- —
- Eligible?
- —
Personal DTI + credit; lowest rate.
DSCR
20% down · 8.5% · 30yr
- Down + closing
- —
- Monthly P&I
- —
- Monthly cashflow
- —
- DSCR
- —
- Eligible?
- —
No personal income docs; deal must DSCR.
Hard money
10% down · 12.0% · 12mo
- Down + closing
- —
- Monthly P&I
- —
- Monthly cashflow
- —
- DSCR
- —
- Eligible?
- —
Short-term bridge; refi at stabilization.
Listing history 18 events
-
2026-06-19days on market $215,000 Active 46 DOM
-
2026-06-18days on market $215,000 Active 45 DOM
-
2026-06-17days on market $215,000 Active 44 DOM
-
2026-06-16days on market $215,000 Active 43 DOM
-
2026-06-15days on market $215,000 Active 42 DOM
-
2026-06-14days on market $215,000 Active 40 DOM
-
2026-06-12days on market $215,000 Active 39 DOM
-
2026-06-09days on market $215,000 Active 36 DOM
-
2026-06-08days on market $215,000 Active 35 DOM
-
2026-06-07days on market $215,000 Active 34 DOM
-
2026-06-03days on market $215,000 Active 30 DOM
-
2026-06-03price $215,000 Active 29 DOM
-
2026-06-02days on market $225,000 Active 29 DOM
-
2026-06-01days on market $225,000 Active 28 DOM
-
2026-05-31days on market $225,000 Active 27 DOM
-
2026-05-30days on market $225,000 Active 26 DOM
-
2026-05-04$225,000 Active 999-char remark
-
2011-09-14soldstatus $42,900
ⓘ Source: listings_history table (triggers on properties + properties_extension) + one-shot
backfill from property_details.listing_events for pre-trigger history.
Tax reassessment forecast KY · Resets to sale price
- Current annual tax
- $887 · $74/mo
- Projected year-2 tax
- $1,849 · $154/mo
- Expected delta
- +$962/yr (+$80/mo · 108.4%)
ⓘ Screening estimate from a state-policy table — verify with the county assessor before closing.
Climate risk First Street
- Flood 1/10 Low FEMA zone X (unshaded) · 0% chance over 30 yrs
- Wildfire 1/10 Low
- Heat 5/10 Major 7 d/yr ≥109°F today · 20 d/yr by 30 yrs out
- Wind 3/10 Moderate 7% chance of damaging wind over 30 yrs
- Air quality 1/10 Low 0 unhealthy d/yr today · 0 by 30 yrs out
Nearby sold comps map
Loading sold comps map…
Walkable amenities ~0.75 mi
Loading nearby amenities…
Taxation est. · year 1
- Rental income
- $16,856
- − Mortgage interest
- −$12,043
- − Property taxes
- −$887
- − Insurance
- −$1,075
- − Repairs & maintenance
- −$1,348
- − Management
- −$1,348
- − Depreciation
- −$6,255
- Taxable loss
- −$6,102
- Est. tax savings @ 24.0%
- +$1,464
- After-tax cash flow
- $-712/yr
For passive investors: Depreciation is non-cash, so a rental often shows a tax loss while cash-flowing — sheltering income. Rental losses are passive: they offset passive income freely, and up to $25,000/yr can offset ordinary (W-2) income if you actively participate and your MAGI is under $100k (phasing out to $0 by $150k); unused losses carry forward. On sale, claimed depreciation is recaptured at up to 25%, and gains may owe capital-gains tax (a 1031 exchange can defer both). Figures are a year-1 estimate at your 24.0% rate — not tax advice; consult a CPA.
Schools (NCES district)
- District
- Marshall County
- NCES district ID
- 2103810
- Math proficiency
- 29% ▼ -7.00%
- Reading proficiency
- 38% ▼ -16.00%
- Median HH income
- $45,324
- Composite
- 28.62/100
- National rank
- #6710
- State rank
- #73 of 165 in KY
Livability — Hardin
- Score
- 54/100
- State rank
- #476
- US rank
- #23849
Category grades
Schools grade is shown separately in the Schools card above.
Census & demographics
- Population (ZIP)
- 19,238
Population outlook (Marshall County) Hauer SSP2
- Today (2025)
- 30,647 people
- By 2030
- 30,276 · -1.2%
- By 2040
- 29,232 · -4.6%
- By 2050
- 27,940 · -8.8%
- By 2075
- 25,289 · -17.5%
- By 2100
- 21,188 · -30.9%
Race, ethnicity, and origin ACS 2023
- Neighborhood character
- Predominantly White (95%)
- Race & ethnicity
- White 95% Two or more races 2% Hispanic / Latino 2%
- Common ancestry
- Iranian 2% Slovak 2% Lithuanian 2%
- Foreign-born
- 1% · Canada
- Languages at home
- 98% English-only · Spanish 1%
Political lean MEDSL · Marshall
- 2024 margin
- Solid R (+56.7) · D 21.0% · R 77.7% · Other 1.3%
- 2008→2024 swing
- -32.0pp toward R · 2008: -24.7pp · 2024: -56.7pp
- All cycles
- 2024: R+56.7 2020: R+52.4 2016: R+51.9 2012: R+34.2 2008: R+24.7
Not yet ingested
- Civics
- —
Market trends
- HPI YoY
- ▲ 19.11%
- Current HPI
- 288.75
- Rent YoY
- —
- Metro
- —
- State GDP YoY
- ▲ 1.81%
- F500 in state
- 4
Industry mix (Fortune 500 HQ in KY)
| Industry | F500 HQs | Revenue |
|---|---|---|
| Healthcare | 1 | $118B |
|
||
| Food / Beverage | 1 | $7B |
|
||
Price history
+401.2% since first listed3 events — show timeline
- 2026-06-02 Price Changed $215,000 WKRMLS
- 2026-05-04 Listed $225,000 WKRMLS
- 2011-09-14 Sold (Public Records) $42,900 Public Records
Property tax history
+5.6%/yrLatest (2025): $887 · -1.5% YoY. Source: county tax records.
Cash-flow waterfall
monthlySold comps — $/sqft
last 12 mo · ≤1 miLoading sold comps…