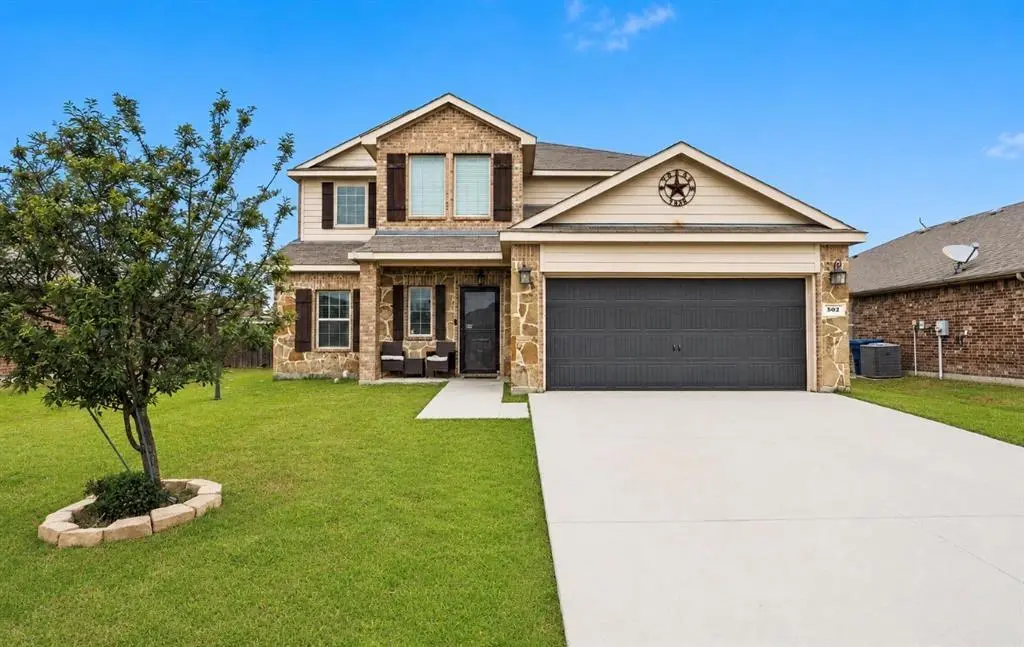
502 Hawthorn Dr · Josephine, TX
Flood risk 1/10 · Minimal
- FEMA flood zone
- X (unshaded)
- Chance of flooding over 30 yrs
- 0.0%
- Est. flood insurance / yr
- $507 – $1,088
Fire risk 6/10 · Moderate
- Est. fire insurance / yr
- $1,222 – $2,270
Heat risk 8/10 · Major
- Hot days now (above 110°F)
- 7 days/yr
- Hot days in 30 yrs
- 23 days/yr
Wind risk 6/10 · Moderate
- Chance of severe wind over 30 yrs
- 27.0%
Air-quality risk 2/10 · Minimal
- Unhealthy air days now
- 1 days/yr
- Unhealthy air days in 30 yrs
- 1 days/yr
Risk factors via First Street. Map © Google.
Why this score? — see what drove the D grade
The composite is a weighted blend of 9 inputs, each scored 0–100. Each bar is that input's sub-score; the figure is the points it added to the 100-point composite (weight × sub-score).
- ARV discount +10.3/15.0
- Appreciation +10.0/10.0
- Cash flow +6.3/30.0
- Schools +3.2/10.0
- Livability +3.0/5.0
- Rent growth +2.5/5.0
- Condition / age +2.5/5.0
- 1% rule +2.2/10.0
- DSCR +0.6/10.0
$299,500
🖨 Deal sheet (PDF) 📄 Offer letter ✓ Due diligence
Listing remarks MLS
Beautiful two story home with five bedrooms, 2.5 baths plus a great loft area! Spacious Master Suite with sitting area. Kitchen opens to family room and dining area. Four bedrooms upstairs with lots of storage space! Call today for more information or to schedule an appointment. PLEASE SEE SHOWING INSTRUCTIONS. .. Plan 2543
Key facts
- Flex space
- Sitting area
- Open kitchen
Tags
Property features AI
Finance
- Other: Property type: Residential single family; Lot: less than 0.5 acre (approx. 0.17 acre)
- HOA & community: Mandatory association; Annual association fee of $380; Association covers grounds maintenance; HOA managed by Assured Mngmt
Exterior
- Parking: Attached 2-car garage (garage faces front); 2 covered parking spaces
- Utilities: All-weather road; Municipal utility district: No
- Home design: Single family residence (attached); Two levels; Built in 2016; Composition roof; Slab foundation; Subdivision: Fountain View Ph 4
- Construction: Composition roof; Slab foundation; Built in 2016
- Exterior features: Covered patio/porch; Wood fencing; All-weather road access
Interior
- Kitchen: Dishwasher; Disposal; Electric range; Microwave; Water line to refrigerator
- Bedrooms: 5 bedrooms total; Primary bedroom on main level; Additional bedrooms on second level with walk-in closets
- Flooring: Carpet; Vinyl
- Bathrooms: 2 full bathrooms, 1 half bathroom
- Heating & cooling: Central heating (electric); Central air; Ceiling fans
- Interior features: Open floorplan; Eat-in kitchen; Kitchen island; Pantry; High-speed internet available; Built-in cabinets; Window coverings
- Laundry & utility: Full-size washer/dryer area; Washer hookup; Electric dryer hookup; Utility room
Neighborhood map
What this means for you Summary
Snapshot
- This is a 5-bed/2.5-bath single-family listed at $300k.
Deal economics
- At list price, monthly cash flow is $-534 ($-6k/yr) — negative.
- To cash-flow at today's rent, offer at most $205k (31.5% below list).
- To meet the 1% rule (rent ≥ 1% of price), the offer needs to be $216k (27.8% below list).
- Recommended offer: $205k (31.5% below list) — sets the bar for cash-flow.
Location & tenants
- Location reads 60/100 on livability (#1,076 in TX) — a middle-class / working-renter tenant base. Strengths: cost of living A+, housing A+, crime A-; Watch: amenities F, commute F, health & safety F.
- Community ISD (rural): math 30% / reading 38% proficiency, ranked #479 of 826 in TX (top 58%) — families likely to look elsewhere, expect single-tenant / working-renter base with shorter leases.
- Zoned schools: John & Barbara Roderick El (678 students, 52% FRL); Leland E Edge Middle (math 25% / reading 35%, grade F, #1,056 of 1,662 statewide, top 65%, 931 students, 53% FRL) — zoned schools average 52% FRL vs 36% district-wide (17 pts higher); higher-poverty schools than district average — tighter screening recommended.
- Market conditions: 421 active listings in the ZIP; 16 comparable units currently listed for rent nearby; rentals at typical pace (median 15d on market — plan ~3-4 weeks tenant-placement turnaround); 19,194 units permitted in Collin County in 2024 (3,988 in 5+ unit buildings).
Forward outlook
- In year one you build about $32k of equity ($2k loan paydown + $30k appreciation (10.0% local appreciation)).
- Collin County population projected at +60% by 2050 — long-run rental-demand tailwind backs the buy-and-hold thesis.
- By year 2, paydown + projected appreciation supports a ~$51k cash-out refi (75% LTV) — recoverable capital for the next deal without selling this one.
Negotiation context
- It's been on market 43 days — a 3% lower offer ($291k) is reasonable based on typical stale-listing flexibility.
- 2 sale attempts since 10y ago with the ask held roughly flat each time — persistent listings suggest the price (not the market) is what's stuck; bring a comps-based counter.
Risks & watch-outs
- Climate carrying-cost: major wind risk, 27% chance of damaging wind over 30y; major wildfire risk; extreme-heat days projected 7→23/yr by 2055 (HVAC capex compounding) — expect insurance premiums to compound above CPI over the hold.
Questions for the listing agent
- What do current leases actually rent for vs. the listed asking? Can we see a recent rent roll and the last 12 months of T-12 income?
- It's been on market 43 days. Have you received any prior offers? Is the seller open to a 31% concession, seller financing, or rate buy-down credit?
- What does the HOA fee cover, when was the last increase, and are there any pending special assessments or reserve-fund shortfalls?
- Is there a deadline driving the sale (1031 exchange, divorce, estate, relocation)? That informs how much negotiation room exists.
- Schools are F-rated, which usually means shorter tenancies and higher turnover. Who's the typical renter profile here, and what's been the actual vacancy rate?
- The area grade is low — what's the realistic commute time and amenity access for the typical tenant pool here? Any planned neighborhood developments (good or bad) we should know about?
- What's the average days-on-market for RENTAL listings here right now (not sales)? A rising rental-DOM trend means longer vacancies and softer asking-rent achievability than the comps imply.
- What's the recent tenant-quality profile in this submarket — average credit score on applications, eviction rate, late-payment / NSF rate, and stable-employment percentage? A property-management company in the area should have these aggregated.
- How much new for-sale + rental construction is in the pipeline within 1–3 miles? Heavy new supply typically softens prices + rents 12–24 months out; constrained supply supports both.
Investment metrics
- 1% rule
- 0.72% ✗
- Cap rate
- 4.15%
- Cash-on-cash
- -7.64%
- DSCR
- 0.66
- GRM
- 11.5
CMA / ARV
- ARV (median comp)
- $319,342
- List price
- $299,500
- Delta
- -6.21%
- Verdict
- FAIR
- Comps
- 20 within 1.0 mi
Show comp detail 12 sales within ~0.75 mi
| Address | Dist | Beds/Ba | Sqft | Sold | Price | $/sf | Match |
|---|---|---|---|---|---|---|---|
| 408 American Elm Dr | 0.16mi | 4/2.0 (-1) | 2,368 (-9%) | 3mo | $300,490 | $127 | 68 |
| 204 Shady Bank Way | 0.39mi | 4/3.0 (-1) | 2,454 (-6%) | 2mo | $414,686 | $169 | 64 |
| 301 Briarwood Dr | 0.56mi | 4/3.0 (-1) | 2,588 (-0%) | 3mo | $414,990 | $160 | 64 |
| 403 American Elm Dr | 0.25mi | 4/2.0 (-1) | 2,314 (-11%) | 3mo | $294,490 | $127 | 61 |
| 809 Willowbanks Dr | 0.46mi | 4/3.0 (-1) | 2,759 (+6%) | 1mo | $414,475 | $150 | 61 |
| 500 Northern Red Dr | 0.29mi | 4/2.0 (-1) | 2,314 (-11%) | 1mo | $303,490 | $131 | 60 |
| 404 Saddle Blanket Dr | 0.56mi | 4/3.0 (-1) | 2,454 (-6%) | 1mo | $340,990 | $139 | 57 |
| 508 Saddle Blanket Dr | 0.55mi | 4/3.0 (-1) | 2,454 (-6%) | 3mo | $307,490 | $125 | 56 |
| 904 Willowbanks Dr | 0.47mi | 5/4.0 | 2,849 (+10%) | 2mo | $449,749 | $158 | 54 |
| 1203 Bristlecone Dr | 0.65mi | 4/3.0 (-1) | 2,454 (-6%) | 3mo | $338,990 | $138 | 51 |
| 207 Saddletree Dr | 0.57mi | 4/2.0 (-1) | 2,368 (-9%) | 1mo | $351,205 | $148 | 51 |
| 500 Saddle Blanket Dr | 0.55mi | 4/3.0 (-1) | 2,276 (-12%) | 4mo | $330,490 | $145 | 43 |
Match score weights: distance 35% · size 25% · config 20% · recency 20%. Top-matched comps best support the ARV.
Projected returns pro-forma
10.0% appreciation · 3.0% rent growth · sell at horizon
- IRR
- 18.9%
- Equity multiple
- 2.54×
- Total profit
- $129,253
- Equity at exit
- $269,813
- IRR
- 17.5%
- Equity multiple
- 5.86×
- Total profit
- $407,644
- Equity at exit
- $581,863
Cash invested: $83,860 (down + closing). Projections, not guarantees.
Landlord ↔ Tenant lean methodology
- Overall (STATE)
- 87 Strongly Landlord-Friendly
- State Texas
- 87 Strongly Landlord-Friendly · R+5
- County
- — inherits STATE
- City
- — inherits STATE
ZIP-level market 75173
- Home prices YoY
- 3.1%
- Active inventory
- 421
- Price-to-rent
- 11.5×
Monthly cashflow live
- Estimated rent
- $2,164 high interval (Pro) →
- Mortgage (P&I)
- −$1,571
- Tax from tax record
- −$516 /mo · $6,190/yr
- Insurance
- −$125
- HOA
- −$32
- Vacancy / Maint / Mgmt
- −$454
- Net cashflow
- $-534
Break-even live
Sensitivity live
| Price | -10% $-364 | -5% $-449 | +0% $-534 | +5% $-619 | +10% $-703 |
|---|---|---|---|---|---|
| Rent | -10% $-705 | -5% $-619 | +0% $-534 | +5% $-448 | +10% $-363 |
| Rate | -1.0pp $-383 | -0.5pp $-458 | base $-534 | +0.5pp $-611 | +1.0pp $-690 |
UW: 25.0% down · 7.5% · 30yr · 1.5% tax · 5.0% vac · 8.0% maint · 8.0% mgmt
Financing live
Cash to close
- Down payment
- $74,875
- Closing costs
- $8,985
- Reserves months
- —
- Total cash needed
- —
Loan-product check · same deal, 3 products live
Conventional
25% down · 7.5% · 30yr
- Down + closing
- —
- Monthly P&I
- —
- Monthly cashflow
- —
- DSCR
- —
- Eligible?
- —
Personal DTI + credit; lowest rate.
DSCR
20% down · 8.5% · 30yr
- Down + closing
- —
- Monthly P&I
- —
- Monthly cashflow
- —
- DSCR
- —
- Eligible?
- —
No personal income docs; deal must DSCR.
Hard money
10% down · 12.0% · 12mo
- Down + closing
- —
- Monthly P&I
- —
- Monthly cashflow
- —
- DSCR
- —
- Eligible?
- —
Short-term bridge; refi at stabilization.
Rent comps 16 comps
| Address | Beds | Baths | Sqft | Rent | $/sqft | DOM | Units | Dist |
|---|---|---|---|---|---|---|---|---|
| 503 Saddle Blanket Dr Nevada, TX | 4.0 | 3.0 | 2077 | $2,190 | $1.05 | 45d | 1 | 0.58mi |
| 315 Pine Hollow Way Josephine, TX | 4.0 | 3.0 | 2212 | $2,300 | $1.04 | 9d | 1 | 0.75mi |
| 305 Silo Cir Royse City, TX | 4.0 | 2.0 | 2074 | $2,100 | $1.01 | 26d | 1 | 0.78mi |
| 311 Milo Way Royse City, TX | 4.0 | 2.0 | 2074 | $2,200 | $1.06 | 8d | 1 | 0.78mi |
| 801 Meadow Creek Ln Josephine, TX | 4.0 | 2.0 | 1757 | $2,500 | $1.42 | 7d | 1 | 0.83mi |
| 800 Windmill St Josephine, TX | 4.0 | 2.0 | 1843 | $2,100 | $1.14 | 9d | 1 | 0.85mi |
| 800 Windmill St Josephine, TX | 4.0 | 2.0 | 1843 | $2,100 | $1.14 | 1d | 1 | 0.85mi |
| 1004 Cotton Gin Ct Royse City, TX | 4.0 | 2.0 | 1875 | $1,850 | $0.99 | 15d | 1 | 0.97mi |
| 1307 Community Way Royse City, TX | 4.0 | 2.0 | 2104 | $2,100 | $1.00 | 45d | 1 | 0.99mi |
| 717 Cottonwood WAY Josephine, TX | 4.0 | 3.0 | 2073 | $2,125 | $1.03 | 0d | 1 | 0.99mi |
| 813 Cottonwood Way Royse City, TX | 4.0 | 3.0 | 2347 | $2,350 | $1.00 | 15d | 1 | 1.01mi |
| 1210 Honeysuckle Dr Josephine, TX | 5.0 | 2.0 | 1995 | $2,100 | $1.05 | 15d | 1 | 1.24mi |
| 1208 Fieldstone Ct Royse City, TX | 4.0 | 2.0 | 1835 | $2,000 | $1.09 | 45d | 1 | 1.31mi |
| 711 Cistern Way Royse City, TX | 4.0 | 2.0 | 2081 | $1,975 | $0.95 | 9d | 1 | 1.34mi |
| 1501 Bridle Dr Josephine, TX | 4.0 | 2.0 | 2081 | $1,975 | $0.95 | 45d | 1 | 1.35mi |
| 1413 Thunder Canyon Way Josephine, TX | 5.0 | 2.0 | 2006 | $2,500 | $1.25 | 45d | 1 | 1.48mi |
HOA detail
- Monthly dues
- $32 · $384/yr
Listing history 20 events
-
2026-06-21days on market $299,500 Active 43 DOM
-
2026-06-18days on market $299,500 Active 40 DOM
-
2026-06-17days on market $299,500 Active 39 DOM
-
2026-06-16days on market $299,500 Active 38 DOM
-
2026-06-15days on market $299,500 Active 37 DOM
-
2026-06-13days on market $299,500 Active 35 DOM
-
2026-06-13days on market $299,500 Active 34 DOM
-
2026-06-09days on market $299,500 Active 31 DOM
-
2026-06-08days on market $299,500 Active 30 DOM
-
2026-06-07days on market $299,500 Active 29 DOM
-
2026-06-04days on market $299,500 Active 26 DOM
-
2026-06-03days on market $299,500 Active 25 DOM
-
2026-06-02days on market $299,500 Active 24 DOM
-
2026-06-01days on market $299,500 Active 23 DOM
-
2026-05-31days on market $299,500 Active 22 DOM
-
2026-05-18price $299,500 824-char remark
-
2026-05-09$305,000 Active 824-char remark
-
2016-12-28soldstatus Sold 325-char remark
Show marketing remark (325 chars)
Beautiful two story home with five bedrooms, 2.5 baths plus a great loft area! Spacious Master Suite with sitting area. Kitchen opens to family room and dining area. Four bedrooms upstairs with lots of storage space! Call today for more information or to schedule an appointment. PLEASE SEE SHOWING INSTRUCTIONS. .. Plan 2543
-
2016-10-26status Pending 325-char remark
Show marketing remark (325 chars)
Beautiful two story home with five bedrooms, 2.5 baths plus a great loft area! Spacious Master Suite with sitting area. Kitchen opens to family room and dining area. Four bedrooms upstairs with lots of storage space! Call today for more information or to schedule an appointment. PLEASE SEE SHOWING INSTRUCTIONS. .. Plan 2543
-
2016-09-27$211,990 Active 325-char remark
Show marketing remark (325 chars)
Beautiful two story home with five bedrooms, 2.5 baths plus a great loft area! Spacious Master Suite with sitting area. Kitchen opens to family room and dining area. Four bedrooms upstairs with lots of storage space! Call today for more information or to schedule an appointment. PLEASE SEE SHOWING INSTRUCTIONS. .. Plan 2543
ⓘ Source: listings_history table (triggers on properties + properties_extension) + one-shot
backfill from property_details.listing_events for pre-trigger history.
Tax reassessment forecast TX · Resets to sale price
- Current annual tax
- $6,190 · $516/mo
- Projected year-2 tax
- $6,190 · $516/mo
- Expected delta
- $0/yr ($0/mo · 0.0%)
ⓘ Screening estimate from a state-policy table — verify with the county assessor before closing.
Climate risk First Street
- Flood 1/10 Low FEMA zone X (unshaded) · 0% chance over 30 yrs
- Wildfire 6/10 Major
- Heat 8/10 Severe 7 d/yr ≥110°F today · 23 d/yr by 30 yrs out
- Wind 6/10 Major 27% chance of damaging wind over 30 yrs
- Air quality 2/10 Low 1 unhealthy d/yr today · 1 by 30 yrs out
Nearby sold comps map
Loading sold comps map…
Walkable amenities ~0.75 mi
Loading nearby amenities…
Taxation est. · year 1
- Rental income
- $25,965
- − Mortgage interest
- −$16,777
- − Property taxes
- −$6,190
- − Insurance
- −$1,498
- − Repairs & maintenance
- −$2,077
- − Management
- −$2,077
- − HOA
- −$384
- − Depreciation
- −$8,713
- Taxable loss
- −$11,750
- Est. tax savings @ 24.0%
- +$2,820
- After-tax cash flow
- $-3,586/yr
For passive investors: Depreciation is non-cash, so a rental often shows a tax loss while cash-flowing — sheltering income. Rental losses are passive: they offset passive income freely, and up to $25,000/yr can offset ordinary (W-2) income if you actively participate and your MAGI is under $100k (phasing out to $0 by $150k); unused losses carry forward. On sale, claimed depreciation is recaptured at up to 25%, and gains may owe capital-gains tax (a 1031 exchange can defer both). Figures are a year-1 estimate at your 24.0% rate — not tax advice; consult a CPA.
Schools (NCES district)
- District
- Community ISD
- NCES district ID
- 4814850
- Math proficiency
- 30% ▼ -23.00%
- Reading proficiency
- 38% ▼ -11.00%
- Median HH income
- $71,841
- Composite
- 31.58/100
- National rank
- #5951
- State rank
- #479 of 826 in TX
Livability — Josephine
- Score
- 60/100
- State rank
- #1076
- US rank
- #19105
Category grades
Schools grade is shown separately in the Schools card above.
Census & demographics
- Census place
- Josephine, TX
- Population (ZIP)
- 9,284
Population outlook (Collin County) Hauer SSP2
- Today (2025)
- 1,210,074 people
- By 2030
- 1,358,201 · +12.2%
- By 2040
- 1,654,061 · +36.7%
- By 2050
- 1,937,359 · +60.1%
- By 2075
- 2,567,039 · +112.1%
- By 2100
- 2,952,048 · +144.0%
Race, ethnicity, and origin ACS 2023
- Neighborhood character
- Majority White (65%)
- Race & ethnicity
- White 65% Hispanic / Latino 28% Two or more races 15% Black 2% Native American 1%
- Hispanic origin (detail)
- Mexican 26%
- Common ancestry
- Slovak 2% Serbian 1% Iranian 1%
- Foreign-born
- 17% · Canada, Jamaica
- Languages at home
- 74% English-only · Spanish 24% Arabic 1%
Political lean MEDSL · Collin
- 2024 margin
- R (+11.1) · D 43.1% · R 54.3% · Other 2.6%
- 2008→2024 swing
- +14.4pp toward D · 2008: -25.6pp · 2024: -11.1pp
- All cycles
- 2024: R+11.1 2020: R+4.3 2016: R+17.0 2012: R+31.6 2008: R+25.6
Not yet ingested
- Civics
- —
Market trends
- HPI YoY
- ▲ 10.09%
- Current HPI
- 331.12
- Rent YoY
- —
- Metro
- —
- State GDP YoY
- ▲ 3.95%
- F500 in state
- 110
Industry mix (Fortune 500 HQ in TX)
| Industry | F500 HQs | Revenue |
|---|---|---|
| Energy | 16 | $1,198B |
|
||
| Technology | 5 | $198B |
|
||
| Engineering / Construction | 4 | $72B |
|
||
| Energy Services | 3 | $60B |
|
||
| Utilities | 3 | $41B |
|
||
| Healthcare | 2 | $330B |
|
||
Price history
+41.3% since first listed5 events — show timeline
- 2026-05-18 Price Changed $299,500 NTREIS
- 2026-05-09 Listed $305,000 NTREIS
- 2016-12-28 Sold (MLS) — NTREIS
- 2016-10-26 Pending — NTREIS
- 2016-09-27 Listed $211,990 NTREIS
Property tax history
+2.5%/yrLatest (2025): $6,190 · -2.9% YoY. Source: county tax records.
Cash-flow waterfall
monthlySold comps — $/sqft
last 12 mo · ≤1 miLoading sold comps…