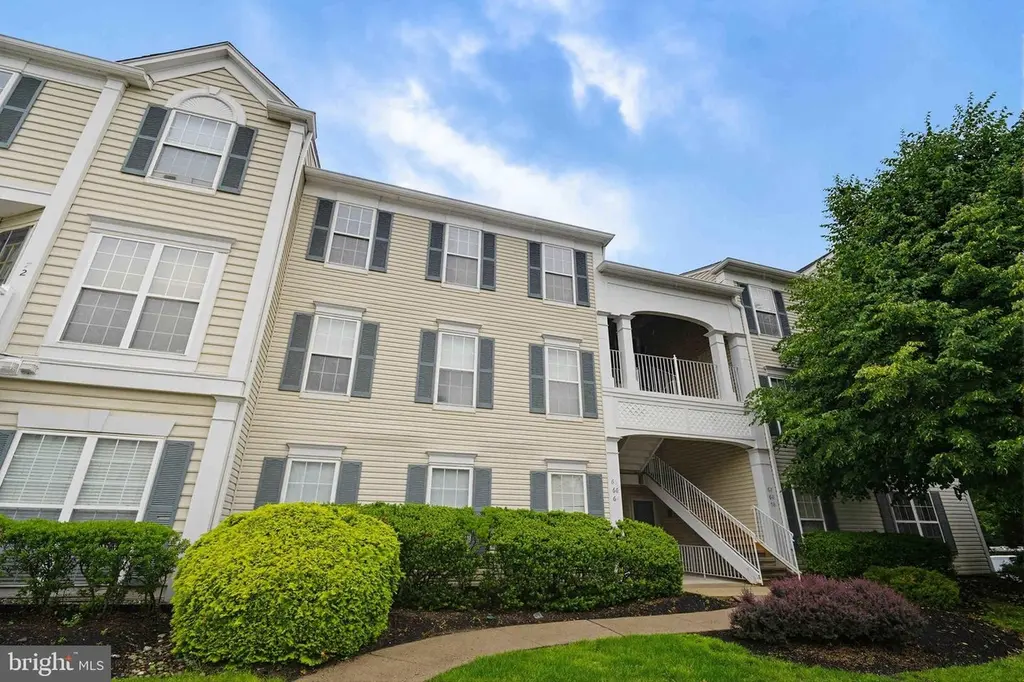
68 Foxglove Dr · Moorestown-Lenola, NJ
Flood risk 1/10 · Minimal
- FEMA flood zone
- X (unshaded)
- Chance of flooding over 30 yrs
- 0.0%
- Est. flood insurance / yr
- $507 – $1,088
Fire risk 2/10 · Minimal
- Est. fire insurance / yr
- $526 – $976
Heat risk 6/10 · Moderate
- Hot days now (above 104°F)
- 7 days/yr
- Hot days in 30 yrs
- 15 days/yr
Wind risk 6/10 · Moderate
- Chance of severe wind over 30 yrs
- 52.0%
Air-quality risk 4/10 · Minor
- Unhealthy air days now
- 5 days/yr
- Unhealthy air days in 30 yrs
- 7 days/yr
Risk factors via First Street. Map © Google.
Why this score? — see what drove the C+ grade
The composite is a weighted blend of 9 inputs, each scored 0–100. Each bar is that input's sub-score; the figure is the points it added to the 100-point composite (weight × sub-score).
- Cash flow +25.5/30.0
- 1% rule +10.0/10.0
- ARV discount +9.8/15.0
- DSCR +8.4/10.0
- Schools +3.4/10.0
- Rent growth +2.5/5.0
- Livability +2.5/5.0
- Condition / age +2.5/5.0
- Appreciation +0.0/10.0
$111,039
🖨 Deal sheet (PDF) 📄 Offer letter ✓ Due diligence
Listing remarks
Welcome to this lovely condo in the highly desirable Summerhill community, where convenience, comfort, and style come together. Nice 2-bed and 1 bath unit. Great location. Close to shopping and major highways. This is a State low-income unit. Must qualify through the State with the provided Application in documents. Property is a deed-restricted. Affordable Low Income Housing unit. Seller and listing agent make no representation regarding any information contained within or regarding the property. Buyer is responsible for verifying the accuracy of any information provided in the MLS including but not limited to, room sizes, property amenities, property condition, functionality of any system
Key facts
- $410 HOA
- Built 1997
- Listed 11 days
Property features AI
Finance
- HOA & community: Monthly HOA fee of $325; Semi-annual condo fee of $510; HOA/Condo fees cover common area maintenance, snow removal, and trash; Community amenities include common grounds and a community center
Exterior
- Parking: Parking lot
- Utilities: Public water; Public sewer; Electric service for heating, cooling, and hot water
- Home design: End of Row/Townhouse structure type; Condominium; Above-grade finished living area reported as 866 (assessor)
- Construction: Vinyl siding; Block foundation; Pets not allowed
- Exterior features: End-of-row townhouse setting; Condominium ownership; Common grounds and community center
Interior
- Bedrooms: 2 bedrooms on the main level
- Bathrooms: 1 full bathroom on the main level; 1 full bathroom total
- Heating & cooling: 90% forced air heat (electric); Central air conditioning (electric); Electric hot water
- Interior features: Two or more access exits
Neighborhood map
What this means for you Summary
Snapshot
- This is a 2-bed/1.0-bath townhouse listed at $111k.
Deal economics
- At list price, monthly cash flow is $258 ($3k/yr) — positive.
- The deal already cash-flows at list — no discount required.
- Meets the 1% rule at list price ($2k rent vs $111k).
- Cap rate 9.1% vs local median 3.3% in Moorestown-Lenola — top-decile yield for the area; either an underpriced asset or a hidden risk that comps aren't pricing in. Stress-test before assuming the spread holds.
Location & tenants
- Location reads: area grade C — affects rentability + tenant quality, not the cash-flow math above.
- Delran Township School District (suburban): math 22% / reading 49% proficiency, ranked #251 of 472 in NJ (top 53%) — families likely to look elsewhere, expect single-tenant / working-renter base with shorter leases; only 17% free/reduced lunch — higher-income household profile.
- Zoned schools: Millbridge Elementary School (653 students, 26% FRL); Delran Middle School (math 25% / reading 53%, grade F, #207 of 431 statewide, top 48%, 710 students, 24% FRL); Delran High School (math 23% / reading 57%, grade F, #187 of 399 statewide, top 48%, 912 students, 21% FRL).
- Market conditions: 134 active listings in the ZIP; 1 comparable units currently listed for rent nearby; solid renter incomes; 2,161 units permitted in Burlington County in 2024 (988 in 5+ unit buildings).
Forward outlook
- Local home prices are declining (-3.0%/yr); year-one equity from $767 of loan paydown is wiped out by about $3k of value loss. Plan a longer hold.
- Burlington County population projected to shrink 5% by 2050 — rents likely to lag national; underwrite the cash flow, not the appreciation.
Negotiation context
- Only 11 days on market — expect competitive offers; lowballing is unlikely to land.
Risks & watch-outs
- Watch-outs: HOA is 22% of rent.
- Climate carrying-cost: major wind risk, 52% chance of damaging wind over 30y; extreme-heat days projected 7→15/yr by 2055 (HVAC capex compounding) — expect insurance premiums to compound above CPI over the hold.
Questions for the listing agent
- What does the HOA fee cover, when was the last increase, and are there any pending special assessments or reserve-fund shortfalls?
- Is there a deadline driving the sale (1031 exchange, divorce, estate, relocation)? That informs how much negotiation room exists.
- What's the average days-on-market for RENTAL listings here right now (not sales)? A rising rental-DOM trend means longer vacancies and softer asking-rent achievability than the comps imply.
- What's the recent tenant-quality profile in this submarket — average credit score on applications, eviction rate, late-payment / NSF rate, and stable-employment percentage? A property-management company in the area should have these aggregated.
- How much new for-sale + rental construction is in the pipeline within 1–3 miles? Heavy new supply typically softens prices + rents 12–24 months out; constrained supply supports both.
Investment metrics
- 1% rule
- 1.71% ✓
- Cap rate
- 9.08%
- Cash-on-cash
- 9.95%
- DSCR
- 1.44
- GRM
- 4.9
CMA / ARV
- ARV (on-the-fly)
- $116,910
- Comps found
- 7
Show comp detail 7 sales within ~0.75 mi
| Address | Dist | Beds/Ba | Sqft | Sold | Price | $/sf | Match |
|---|---|---|---|---|---|---|---|
| 85 Foxglove Dr | 0.03mi | 2/1.0 | 866 (0%) | 6mo | $112,956 | $130 | 94 |
| 34 Foxglove Dr | 0.05mi | 2/1.0 | 790 (-9%) | 2mo | $199,000 | $252 | 82 |
| 217 Rosebay Ct | 0.10mi | 2/1.0 | 866 (0%) | 22mo | $101,400 | $117 | 77 |
| 75 Foxglove Dr | 0.04mi | 2/1.0 | 840 (-3%) | 21mo | $113,683 | $135 | 76 |
| 83 Foxglove Dr | 0.03mi | 2/1.0 | 948 (+10%) | 10mo | $203,500 | $215 | 74 |
| 21 Foxglove Dr | 0.10mi | 2/1.0 | 948 (+10%) | 10mo | $247,000 | $261 | 71 |
| 337 Nicholas Dr | 0.72mi | 2/1.0 | 873 (+1%) | 10mo | $107,000 | $123 | 57 |
Match score weights: distance 35% · size 25% · config 20% · recency 20%. Top-matched comps best support the ARV.
Projected returns pro-forma
-3.0% appreciation · 3.0% rent growth · sell at horizon
- IRR
- -1.1%
- Equity multiple
- 0.96×
- Total profit
- $-1,249
- Equity at exit
- $16,556
- IRR
- 8.9%
- Equity multiple
- 1.69×
- Total profit
- $21,366
- Equity at exit
- $9,601
Cash invested: $31,091 (down + closing). Projections, not guarantees.
Landlord ↔ Tenant lean methodology
- Overall (STATE)
- 21 Tenant-Leaning
- State New Jersey
- 21 Tenant-Leaning · D+6
- County
- — inherits STATE
- City
- — inherits STATE
ZIP-level market 08075
- Active inventory
- 134
- Price-to-rent
- 4.9×
Monthly cashflow live
- Estimated rent
- $1,901 medium interval (Pro) →
- Mortgage (P&I)
- −$582
- Tax from tax record
- −$206 /mo · $2,467/yr
- Insurance
- −$46
- HOA
- −$410
- Lot rent
- −$0
- Vacancy / Maint / Mgmt
- −$399
- Net cashflow
- $258
Break-even live
Sensitivity live
| Price | -10% $321 | -5% $289 | +0% $258 | +5% $226 | +10% $195 |
|---|---|---|---|---|---|
| Rent | -10% $108 | -5% $183 | +0% $258 | +5% $333 | +10% $408 |
| Rate | -1.0pp $314 | -0.5pp $286 | base $258 | +0.5pp $229 | +1.0pp $200 |
UW: 25.0% down · 7.5% · 30yr · 1.5% tax · 5.0% vac · 8.0% maint · 8.0% mgmt
Financing live
Cash to close
- Down payment
- $27,760
- Closing costs
- $3,331
- Reserves months
- —
- Total cash needed
- —
Loan-product check · same deal, 3 products live
Conventional
25% down · 7.5% · 30yr
- Down + closing
- —
- Monthly P&I
- —
- Monthly cashflow
- —
- DSCR
- —
- Eligible?
- —
Personal DTI + credit; lowest rate.
DSCR
20% down · 8.5% · 30yr
- Down + closing
- —
- Monthly P&I
- —
- Monthly cashflow
- —
- DSCR
- —
- Eligible?
- —
No personal income docs; deal must DSCR.
Hard money
10% down · 12.0% · 12mo
- Down + closing
- —
- Monthly P&I
- —
- Monthly cashflow
- —
- DSCR
- —
- Eligible?
- —
Short-term bridge; refi at stabilization.
Rent comps 1 comps
| Address | Beds | Baths | Sqft | Rent | $/sqft | DOM | Units | Dist |
|---|---|---|---|---|---|---|---|---|
| 34 Foxglove Dr Delran, NJ | 2.0 | 1.0 | 790 | $1,900 | $2.41 | 27d | 1 | 0.03mi |
HOA detail
- Monthly dues
- $410 · $4,920/yr
Listing history 9 events
-
2026-06-22days on market $111,039 Active 11 DOM
-
2026-06-21days on market $111,039 Active 10 DOM
-
2026-06-18days on market $111,039 Active 7 DOM
-
2026-06-17days on market $111,039 Active 6 DOM
-
2026-06-16days on market $111,039 Active 5 DOM
-
2026-06-15days on market $111,039 Active 4 DOM
-
2026-06-13days on market $111,039 Active 2 DOM
-
2026-06-13remarks 699-char remark
-
2026-06-13$111,039 Active 1 DOM
ⓘ Source: listings_history table (triggers on properties + properties_extension) + one-shot
backfill from property_details.listing_events for pre-trigger history.
Tax reassessment forecast NJ · Partial reset (capped growth)
- Current annual tax
- $2,467 · $206/mo
- Projected year-2 tax
- $2,616 · $218/mo
- Expected delta
- +$149/yr (+$12/mo · 6.0%)
ⓘ Screening estimate from a state-policy table — verify with the county assessor before closing.
Climate risk First Street
- Flood 1/10 Low FEMA zone X (unshaded) · 0% chance over 30 yrs
- Wildfire 2/10 Low
- Heat 6/10 Major 7 d/yr ≥104°F today · 15 d/yr by 30 yrs out
- Wind 6/10 Major 52% chance of damaging wind over 30 yrs
- Air quality 4/10 Moderate 5 unhealthy d/yr today · 7 by 30 yrs out
Nearby sold comps map
Loading sold comps map…
Walkable amenities ~0.75 mi
Loading nearby amenities…
Taxation est. · year 1
- Rental income
- $22,815
- − Mortgage interest
- −$6,220
- − Property taxes
- −$2,467
- − Insurance
- −$555
- − Repairs & maintenance
- −$1,825
- − Management
- −$1,825
- − HOA
- −$4,920
- − Depreciation
- −$3,230
- Taxable income
- $1,772
- Est. tax owed @ 24.0%
- −$425
- After-tax cash flow
- $2,669/yr
For passive investors: Depreciation is non-cash, so a rental often shows a tax loss while cash-flowing — sheltering income. Rental losses are passive: they offset passive income freely, and up to $25,000/yr can offset ordinary (W-2) income if you actively participate and your MAGI is under $100k (phasing out to $0 by $150k); unused losses carry forward. On sale, claimed depreciation is recaptured at up to 25%, and gains may owe capital-gains tax (a 1031 exchange can defer both). Figures are a year-1 estimate at your 24.0% rate — not tax advice; consult a CPA.
Schools (NCES district)
- District
- Delran Township School District
- NCES district ID
- 3403780
- Math proficiency
- 22% ▼ -16.00%
- Reading proficiency
- 49% ▼ -2.00%
- Median HH income
- $83,417
- Composite
- 33.85/100
- National rank
- #5354
- State rank
- #251 of 472 in NJ
Livability — Moorestown-Lenola
No livability data for this city. (Only ~50 U.S. cities are tracked.)
Census & demographics
- County
- Burlington County · 323,710 people
- City population
- 20,990
- Metro
- Philadelphia-Camden-Wilmington, PA-NJ-DE-MD
- Population (ZIP)
- 30,615
- Household income
- $94,407
- Rent vs Own
- Severe rent burden
- 1103.0
Population outlook (Burlington County) Hauer SSP2
- Today (2025)
- 453,425 people
- By 2030
- 452,359 · -0.2%
- By 2040
- 445,033 · -1.9%
- By 2050
- 431,760 · -4.8%
- By 2075
- 406,277 · -10.4%
- By 2100
- 364,732 · -19.6%
Race, ethnicity, and origin ACS 2023
- Neighborhood character
- Predominantly White (70%)
- Race & ethnicity
- White 70% Black 10% Hispanic / Latino 9% Two or more races 9% Asian 3%
- Hispanic origin (detail)
- Puerto Rican 3%
- Common ancestry
- Romanian 8% Estonian 3% Russian 2%
- Foreign-born
- 13% · Canada, China
- Languages at home
- 82% English-only · Other Indo-European 8% Spanish 6% Other Asian/Pacific 2%
Political lean MEDSL · Burlington
- 2024 margin
- D (+16.6) · D 57.6% · R 41.0% · Other 1.3%
- 2008→2024 swing
- -2.0pp toward R · 2008: 18.6pp · 2024: 16.6pp
- All cycles
- 2024: D+16.6 2020: D+19.5 2016: D+14.8 2012: D+18.7 2008: D+18.6
Not yet ingested
- Civics
- —
Market trends
- HPI YoY
- ▼ -396.76%
- Current HPI
- 281.8091
- Rent YoY
- —
- Metro
- Philadelphia-Camden-Wilmington, PA-NJ-DE-MD
- State GDP YoY
- ▲ 2.05%
- F500 in state
- 34
Industry mix (Fortune 500 HQ in NJ)
| Industry | F500 HQs | Revenue |
|---|---|---|
| Consumer Goods | 3 | $31B |
|
||
| Pharmaceuticals | 2 | $153B |
|
||
| Technology | 2 | $21B |
|
||
| Insurance | 2 | $20B |
|
||
| Healthcare | 2 | $19B |
|
||
| Financial Services | 1 | $70B |
|
||
Price history
1 event — show timeline
- 2026-06-11 Listed $111,039 BRIGHT MLS
Property tax history
+2.3%/yrLatest (2025): $2,467 · +0.7% YoY. Source: county tax records.
Cash-flow waterfall
monthlySold comps — $/sqft
last 12 mo · ≤1 miLoading sold comps…