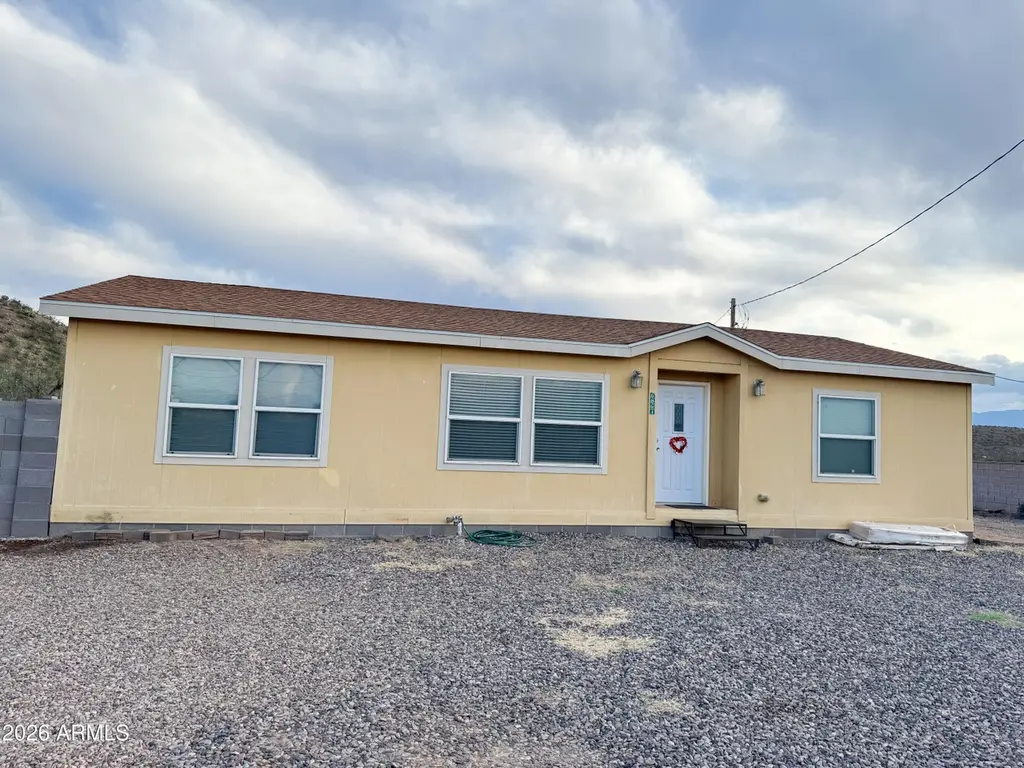
6891 E US Highway 70 -- · San Jose, AZ
Flood risk 1/10 · Minimal
- FEMA flood zone
- X (unshaded)
- Chance of flooding over 30 yrs
- 0.0%
- Est. flood insurance / yr
- $507 – $1,088
Fire risk 6/10 · Moderate
- Est. fire insurance / yr
- $610 – $1,132
Heat risk 7/10 · Major
- Hot days now (above 102°F)
- 7 days/yr
- Hot days in 30 yrs
- 19 days/yr
Wind risk 1/10 · Minimal
- Chance of severe wind over 30 yrs
- —
Air-quality risk 1/10 · Minimal
- Unhealthy air days now
- 0 days/yr
- Unhealthy air days in 30 yrs
- 0 days/yr
Risk factors via First Street. Map © Google.
Why this score? — see what drove the D grade
The composite is a weighted blend of 9 inputs, each scored 0–100. Each bar is that input's sub-score; the figure is the points it added to the 100-point composite (weight × sub-score).
- Cash flow +13.4/30.0
- ARV discount +7.5/15.0
- Schools +4.2/10.0
- DSCR +4.0/10.0
- 1% rule +3.8/10.0
- Livability +2.9/5.0
- Rent growth +2.5/5.0
- Condition / age +2.5/5.0
- Appreciation +0.0/10.0
$210,000
🖨 Deal sheet (PDF) 📄 Offer letter ✓ Due diligence
Listing remarks
Room to park it all and priced to move! This well-maintained 3 bed, 2 bath home sits on 0.43 acres with plenty of space for vehicles, trailers, and recreational toys. Built in 2008, it features a functional split floor plan, spacious living, kitchen, and dining areas, plus an indoor laundry room. Major updates include a new AC unit in 2024 and a roof approximately 8 years old. The block fenced yard adds usability and flexibility. Ideally located on the Morenci commute route and just minutes from Safford. Whether you're looking for a primary residence, first home, or investment opportunity, this property offers strong potential. Seller is easy to work with and motivated.
Key facts
- New ac unit
- Split floor plan
- Indoor laundry room
Tags
Property features AI
Finance
- Financial info: FHA financing available
- HOA & community: No association fees
Exterior
- Parking: 2 covered parking spaces; 2 carport spaces
- Utilities: City water; Septic tank sewer
- Home design: Modular/Pre-Fab property; Fee simple ownership
- Construction: Vinyl siding construction; Composition roof
- Exterior features: Vinyl siding; See remarks for additional exterior details; Block fencing; Composition roof; Gravel/stone front yard; Gravel/stone backyard
Interior
- Bedrooms: Up to 3 possible bedrooms; Master bedroom
- Bathrooms: 2 full bathrooms
- Heating & cooling: Central air conditioning; Has heating
- Interior features: Full bath in the master bedroom; Washer/dryer hookup only
- Laundry & utility: Washer/dryer hook-up
Neighborhood map
What this means for you Summary
Snapshot
- This is a 3-bed/2.0-bath manufactured listed at $210k.
Deal economics
- At list price, monthly cash flow is $4 ($45/yr) — positive.
- The deal already cash-flows at list — no discount required.
- To meet the 1% rule (rent ≥ 1% of price), the offer needs to be $184k (12.3% below list).
- Recommended offer: $184k (12.3% below list) — sets the bar for 1% rule.
Location & tenants
- Location reads 58/100 on livability (#211 in AZ) — a working-class tenant base; expect higher turnover. Strengths: cost of living A+, housing A; Watch: employment C-, crime F, amenities F.
- Solomon Elementary District (4222) (town): math 40% / reading 55% proficiency, ranked #146 of 501 in AZ (top 29%) — families likely to look elsewhere, expect single-tenant / working-renter base with shorter leases.
- Zoned schools: Solomon Elementary School (math 27% / reading 32%, grade F, #548 of 1,109 statewide, top 51%, 197 students, 57% FRL).
- Zoned-school proficiency averages 30% at this address vs 48% district-wide (-18 pts) — the specific schools serving this property underperform the Solomon Elementary District (4222) average; the district grade overstates school quality for this exact location.
- Market conditions: 61 active listings in the ZIP; 137 units permitted in Graham County in 2024 (0 in 5+ unit buildings).
Forward outlook
- Local home prices are declining (-3.0%/yr); year-one equity from $1k of loan paydown is wiped out by about $6k of value loss. Plan a longer hold.
- Graham County population projected at +7% by 2050 — modest demand growth; plan on rents tracking national, not racing it.
Negotiation context
- It's been on market 40 days — a 3% lower offer ($204k) is reasonable based on typical stale-listing flexibility.
- Current owner paid $100k; list at $210k implies a 110% gain — meaningful room to come down on a strong offer.
Risks & watch-outs
- Climate carrying-cost: major wildfire risk; extreme-heat days projected 7→19/yr by 2055 (HVAC capex compounding) — expect insurance premiums to compound above CPI over the hold.
Questions for the listing agent
- It's been on market 40 days. Have you received any prior offers? Is the seller open to a 12% concession, seller financing, or rate buy-down credit?
- Is there a deadline driving the sale (1031 exchange, divorce, estate, relocation)? That informs how much negotiation room exists.
- Schools are F-rated, which usually means shorter tenancies and higher turnover. Who's the typical renter profile here, and what's been the actual vacancy rate?
- Crime grade is F in this area — have there been break-ins, vandalism, or insurance claims at this property in the last 3 years? What carrier currently insures it and at what premium?
- The area grade is low — what's the realistic commute time and amenity access for the typical tenant pool here? Any planned neighborhood developments (good or bad) we should know about?
- What's the average days-on-market for RENTAL listings here right now (not sales)? A rising rental-DOM trend means longer vacancies and softer asking-rent achievability than the comps imply.
- What's the recent tenant-quality profile in this submarket — average credit score on applications, eviction rate, late-payment / NSF rate, and stable-employment percentage? A property-management company in the area should have these aggregated.
- How much new for-sale + rental construction is in the pipeline within 1–3 miles? Heavy new supply typically softens prices + rents 12–24 months out; constrained supply supports both.
Investment metrics
- 1% rule
- 0.88% ✗
- Cap rate
- 6.31%
- Cash-on-cash
- 0.08%
- DSCR
- 1.00
- GRM
- 9.5
CMA / ARV
No comps found within radius.
Projected returns pro-forma
-3.0% appreciation · 3.0% rent growth · sell at horizon
- IRR
- -16.2%
- Equity multiple
- 0.43×
- Total profit
- $-33,764
- Equity at exit
- $31,312
- IRR
- -7.8%
- Equity multiple
- 0.51×
- Total profit
- $-28,983
- Equity at exit
- $18,157
Cash invested: $58,800 (down + closing). Projections, not guarantees.
Landlord ↔ Tenant lean methodology
- Overall (STATE)
- 87 Strongly Landlord-Friendly
- State Arizona
- 87 Strongly Landlord-Friendly · R+3
- County
- — inherits STATE
- City
- — inherits STATE
ZIP-level market 85546
- Home prices YoY
- -17.1%
- Active inventory
- 61
- Price-to-rent
- 9.5×
Monthly cashflow live
- Estimated rent
- $1,842 medium interval (Pro) →
- Mortgage (P&I)
- −$1,101
- Tax est. 1.5%
- −$262 /mo · $3,150/yr
- Insurance
- −$88
- HOA
- −$0
- Vacancy / Maint / Mgmt
- −$387
- Net cashflow
- $4
Break-even live
Sensitivity live
| Price | -10% $149 | -5% $76 | +0% $4 | +5% $-69 | +10% $-141 |
|---|---|---|---|---|---|
| Rent | -10% $-142 | -5% $-69 | +0% $4 | +5% $76 | +10% $149 |
| Rate | -1.0pp $109 | -0.5pp $57 | base $4 | +0.5pp $-51 | +1.0pp $-106 |
UW: 25.0% down · 7.5% · 30yr · 1.5% tax · 5.0% vac · 8.0% maint · 8.0% mgmt
Financing live
Cash to close
- Down payment
- $52,500
- Closing costs
- $6,300
- Reserves months
- —
- Total cash needed
- —
Loan-product check · same deal, 3 products live
Conventional
25% down · 7.5% · 30yr
- Down + closing
- —
- Monthly P&I
- —
- Monthly cashflow
- —
- DSCR
- —
- Eligible?
- —
Personal DTI + credit; lowest rate.
DSCR
20% down · 8.5% · 30yr
- Down + closing
- —
- Monthly P&I
- —
- Monthly cashflow
- —
- DSCR
- —
- Eligible?
- —
No personal income docs; deal must DSCR.
Hard money
10% down · 12.0% · 12mo
- Down + closing
- —
- Monthly P&I
- —
- Monthly cashflow
- —
- DSCR
- —
- Eligible?
- —
Short-term bridge; refi at stabilization.
Listing history 4 events
-
2026-05-20status Pending
-
2026-04-17price $210,000
-
2026-03-16$220,000 Active
-
2018-11-02soldstatus $100,000
ⓘ Source: listings_history table (triggers on properties + properties_extension) + one-shot
backfill from property_details.listing_events for pre-trigger history.
Climate risk First Street
- Flood 1/10 Low FEMA zone X (unshaded) · 0% chance over 30 yrs
- Wildfire 6/10 Major
- Heat 7/10 Severe 7 d/yr ≥102°F today · 19 d/yr by 30 yrs out
- Wind 1/10 Low
- Air quality 1/10 Low 0 unhealthy d/yr today · 0 by 30 yrs out
Nearby sold comps map
Loading sold comps map…
Walkable amenities ~0.75 mi
Loading nearby amenities…
Taxation est. · year 1
- Rental income
- $22,101
- − Mortgage interest
- −$11,763
- − Property taxes
- −$3,150
- − Insurance
- −$1,050
- − Repairs & maintenance
- −$1,768
- − Management
- −$1,768
- − Depreciation
- −$6,109
- Taxable loss
- −$3,508
- Est. tax savings @ 24.0%
- +$842
- After-tax cash flow
- $886/yr
For passive investors: Depreciation is non-cash, so a rental often shows a tax loss while cash-flowing — sheltering income. Rental losses are passive: they offset passive income freely, and up to $25,000/yr can offset ordinary (W-2) income if you actively participate and your MAGI is under $100k (phasing out to $0 by $150k); unused losses carry forward. On sale, claimed depreciation is recaptured at up to 25%, and gains may owe capital-gains tax (a 1031 exchange can defer both). Figures are a year-1 estimate at your 24.0% rate — not tax advice; consult a CPA.
Schools (NCES district)
- District
- Solomon Elementary District (4222)
- NCES district ID
- 0407860
- Math proficiency
- 40% ▼ -5.00%
- Reading proficiency
- 55% ▲ 10.00%
- Median HH income
- $46,338
- Composite
- 42.45/100
- National rank
- #6889
- State rank
- #146 of 501 in AZ
Livability — San Jose
- Score
- 58/100
- State rank
- #211
- US rank
- #21091
Category grades
Schools grade is shown separately in the Schools card above.
Census & demographics
- Census place
- San Jose, AZ
- Population (ZIP)
- 20,735
Population outlook (Graham County) Hauer SSP2
- Today (2025)
- 38,473 people
- By 2030
- 38,805 · +0.9%
- By 2040
- 39,728 · +3.3%
- By 2050
- 41,005 · +6.6%
- By 2075
- 43,529 · +13.1%
- By 2100
- 42,097 · +9.4%
Race, ethnicity, and origin ACS 2023
- Neighborhood character
- Majority White (52%)
- Race & ethnicity
- White 52% Hispanic / Latino 43% Two or more races 17% Native American 2% Black 2% Pacific Islander 1%
- Hispanic origin (detail)
- Mexican 38%
- Common ancestry
- Lithuanian 2% German 1% Scottish 1%
- Foreign-born
- 3% · Canada
- Languages at home
- 82% English-only · Spanish 16%
Political lean MEDSL · Graham
- 2024 margin
- Solid R (+48.1) · D 25.5% · R 73.6%
- 2008→2024 swing
- -7.4pp toward R · 2008: -40.7pp · 2024: -48.1pp
- All cycles
- 2024: R+48.1 2020: R+44.8 2016: R+39.6 2012: R+37.7 2008: R+40.7
Not yet ingested
- Civics
- —
Market trends
- HPI YoY
- ▼ -62.86%
- Current HPI
- 303.9835
- Rent YoY
- —
- Metro
- —
- State GDP YoY
- ▲ 4.54%
- F500 in state
- 20
Industry mix (Fortune 500 HQ in AZ)
| Industry | F500 HQs | Revenue |
|---|---|---|
| Technology | 2 | $13B |
|
||
| Mining / Metals | 1 | $23B |
|
||
| Environmental Services | 1 | $16B |
|
||
| Metals / Steel | 1 | $14B |
|
||
| Technology Distribution | 1 | $9B |
|
||
| Homebuilding | 1 | $8B |
|
||
Price history
+110.0% since first listed4 events — show timeline
- 2026-05-20 Pending — ARMLS
- 2026-04-17 Price Changed $210,000 ARMLS
- 2026-03-16 Listed $220,000 ARMLS
- 2018-11-02 Sold (Public Records) $100,000 Public Records
Property tax history
-3.8%/yrLatest (2025): $340 · +17.8% YoY. Source: county tax records.
Cash-flow waterfall
monthlySold comps — $/sqft
last 12 mo · ≤1 miLoading sold comps…