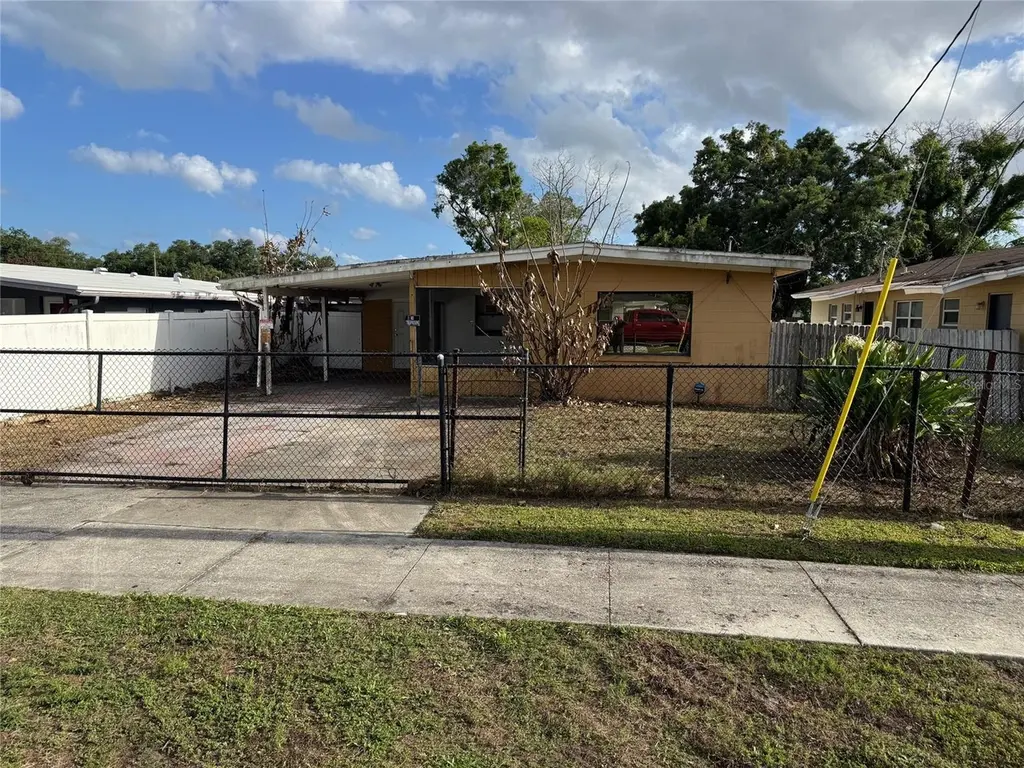
4522 Carter St · Orlando, FL
Flood risk 1/10 · Minimal
- FEMA flood zone
- X (unshaded)
- Chance of flooding over 30 yrs
- 0.0%
- Est. flood insurance / yr
- $507 – $1,088
Fire risk 1/10 · Minimal
- Est. fire insurance / yr
- $947 – $1,759
Heat risk 9/10 · Severe
- Hot days now (above 108°F)
- 7 days/yr
- Hot days in 30 yrs
- 23 days/yr
Wind risk 9/10 · Severe
- Chance of severe wind over 30 yrs
- 99.0%
Air-quality risk 1/10 · Minimal
- Unhealthy air days now
- 0 days/yr
- Unhealthy air days in 30 yrs
- 0 days/yr
Risk factors via First Street. Map © Google.
Why this score? — see what drove the B- grade
The composite is a weighted blend of 9 inputs, each scored 0–100. Each bar is that input's sub-score; the figure is the points it added to the 100-point composite (weight × sub-score).
- Cash flow +25.4/30.0
- ARV discount +15.0/15.0
- DSCR +8.4/10.0
- 1% rule +5.5/10.0
- Livability +4.3/5.0
- Schools +4.1/10.0
- Rent growth +2.5/5.0
- Condition / age +2.5/5.0
- Appreciation +0.0/10.0
$149,000
🖨 Deal sheet 📄 Offer letter ✓ Due diligence
Listing remarks MLS
Great for first time buyer or investor.
Key facts
- 6,760 sq ft lot
- Parking
- Built 1964
Property features AI
Finance
- Other: Property type: Residential — Single Family Residence; Total acreage: under 1/4 acre (~0.16 acres); Lot surfaces: Asphalt and concrete roads; Lot size ~628 sq meters; Direction faces: North
- Financial info: No lease restrictions
- HOA & community: No association fees; No association approval required
Exterior
- Parking: Has carport; 1 carport space
- Utilities: Public water; Public sewer; Public utilities
- Home design: Single family residence; Residential property; One level; Faces north; Fixer condition; Zoned R-2
- Construction: Block construction; Other roof; Slab foundation; Building area ~1,172 sq ft; Living area ~800 sq ft; Total building area ~108.88 sq meters
- Exterior features: Sidewalk; Other exterior features; Paved lot
Interior
- Kitchen: No appliances included
- Bedrooms: 2 bedrooms
- Flooring: Ceramic tile; Other flooring
- Bathrooms: 1 full bathroom
- Heating & cooling: Central heating; Central air conditioning
- Interior features: Other interior features; Storage rooms
- Laundry & utility: Laundry features: Other
Neighborhood map
What this means for you Summary
Snapshot
- This is a 2-bed/1.0-bath single-family listed at $149k.
Deal economics
- At list price, monthly cash flow is $341 ($4k/yr) — positive.
- The deal already cash-flows at list — no discount required.
- Meets the 1% rule at list price ($2k rent vs $149k).
- Recommended offer: $140k (6.0% below list) — sets the bar for market timing.
- Cap rate 9.0% vs local median 3.0% in Orlando — top-decile yield for the area; either an underpriced asset or a hidden risk that comps aren't pricing in. Stress-test before assuming the spread holds.
Location & tenants
- Location reads 86/100 on livability (#12 in FL, #360 nationally) — a professional / high-income tenant draw. Strengths: amenities A+, commute A+, housing A+.
- Orange (suburban): math 46% / reading 51% proficiency, ranked #43 of 73 in FL (top 59%) — families likely to look elsewhere, expect single-tenant / working-renter base with shorter leases.
- Market conditions: Rents flat; 238 active listings in the ZIP; 19 comparable units currently listed for rent nearby; rentals at typical pace (median 22d on market — plan ~3-4 weeks tenant-placement turnaround); 8,053 units permitted in Orange County in 2024 (3,133 in 5+ unit buildings).
- This rent runs 35% of the median local income ($54k/yr) — at the standard rent-burdened threshold; future hikes will face affordability resistance.
Forward outlook
- Local home prices are declining (-3.0%/yr); year-one equity from $1k of loan paydown is wiped out by about $4k of value loss. Plan a longer hold.
- Orange County population projected at +52% by 2050 — long-run rental-demand tailwind backs the buy-and-hold thesis.
Negotiation context
- It's been on market 64 days — a 6% lower offer ($140k) is reasonable based on typical stale-listing flexibility.
- 4 sale attempts since 12y ago; this cycle's ask has dropped $21k (12%) from the opening price — seller is motivated, your offer sets the floor, not the list.
- Current owner paid $32k; list at $149k implies a 366% gain — meaningful room to come down on a strong offer.
Risks & watch-outs
- Climate carrying-cost: severe wind risk, 99% chance of damaging wind over 30y; extreme-heat days projected 7→23/yr by 2055 (HVAC capex compounding) — expect insurance premiums to compound above CPI over the hold.
Questions for the listing agent
- It's been on market 64 days. Have you received any prior offers? Is the seller open to a 6% concession, seller financing, or rate buy-down credit?
- Built in 1964 — when were the roof, HVAC, electrical panel, plumbing, and water heater last replaced?
- Why hasn't it sold? Are there any deal-killer items the seller is aware of (foundation, flood, title, zoning, code violations)?
- Is there a deadline driving the sale (1031 exchange, divorce, estate, relocation)? That informs how much negotiation room exists.
- Schools are B-rated — typically a magnet for longer-tenancy family renters. What's the average tenant stay here, and is there a school-zone premium baked into asking?
- What's the average days-on-market for RENTAL listings here right now (not sales)? A rising rental-DOM trend means longer vacancies and softer asking-rent achievability than the comps imply.
- What's the recent tenant-quality profile in this submarket — average credit score on applications, eviction rate, late-payment / NSF rate, and stable-employment percentage? A property-management company in the area should have these aggregated.
- How much new for-sale + rental construction is in the pipeline within 1–3 miles? Heavy new supply typically softens prices + rents 12–24 months out; constrained supply supports both.
Investment metrics
- 1% rule
- 1.05% ✓
- Cap rate
- 9.04%
- Cash-on-cash
- 9.81%
- DSCR
- 1.44
- GRM
- 7.9
CMA / ARV
- ARV (on-the-fly)
- $184,000
- Comps found
- 1
Show comp detail 1 sale within ~0.75 mi
| Address | Dist | Beds/Ba | Sqft | Sold | Price | $/sf | Match |
|---|---|---|---|---|---|---|---|
| 4548 Piedmont St | 0.32mi | 3/1.0 (+1) | 912 (+14%) | 8mo | $210,000 | $230 | 50 |
Match score weights: distance 35% · size 25% · config 20% · recency 20%. Top-matched comps best support the ARV.
Projected returns pro-forma
-3.0% appreciation · 0.15% rent growth · sell at horizon
- IRR
- -4.5%
- Equity multiple
- 0.84×
- Total profit
- $-6,837
- Equity at exit
- $22,216
- IRR
- 1.9%
- Equity multiple
- 1.12×
- Total profit
- $4,869
- Equity at exit
- $12,883
Cash invested: $41,720 (down + closing). Projections, not guarantees.
Landlord ↔ Tenant lean methodology
- Overall (STATE)
- 87 Strongly Landlord-Friendly
- State Florida
- 87 Strongly Landlord-Friendly · R+3
- County
- — inherits STATE
- City
- — inherits STATE
ZIP-level market 32811
- Home prices YoY
- -33.8%
- Rents YoY
- 0.1%
- Active inventory
- 238
- Price-to-rent
- 7.9×
Monthly cashflow live
- Estimated rent
- $1,566 high interval (Pro) →
- Mortgage (P&I)
- −$781
- Tax from tax record
- −$53 /mo · $630/yr
- Insurance
- −$62
- HOA
- −$0
- Vacancy / Maint / Mgmt
- −$329
- Net cashflow
- $341
Break-even live
UW: 25.0% down · 7.5% · 30yr · 1.5% tax · 5.0% vac · 8.0% maint · 8.0% mgmt
Financing live
Cash to close
- Down payment
- $37,250
- Closing costs
- $4,470
- Reserves months
- —
- Total cash needed
- —
Loan-product check · same deal, 3 products live
Conventional
25% down · 7.5% · 30yr
- Down + closing
- —
- Monthly P&I
- —
- Monthly cashflow
- —
- DSCR
- —
- Eligible?
- —
Personal DTI + credit; lowest rate.
DSCR
20% down · 8.5% · 30yr
- Down + closing
- —
- Monthly P&I
- —
- Monthly cashflow
- —
- DSCR
- —
- Eligible?
- —
No personal income docs; deal must DSCR.
Hard money
10% down · 12.0% · 12mo
- Down + closing
- —
- Monthly P&I
- —
- Monthly cashflow
- —
- DSCR
- —
- Eligible?
- —
Short-term bridge; refi at stabilization.
Rent comps 19 comps
| Address | Beds | Baths | Sqft | Rent | $/sqft | DOM | Units | Dist |
|---|---|---|---|---|---|---|---|---|
| 767 Willie Mays Pkwy Orlando, FL | 2.0 | 1.0 | 630 | $1,470 | $2.33 | 23d | 1 | 0.10mi |
| 769 Willie Mays Pkwy Orlando, FL | 2.0 | 1.0 | 700 | $1,500 | $2.14 | 4d | 1 | 0.10mi |
| 701 S Ivey Ln Orlando, FL | 2.0–3.0 | 1.0 | 871 | $1,134 | $1.30 | 23d | 1 | 0.25mi |
| 200 Fanfair Ave Orlando, FL | 3.0 | 1.0 | 941 | $1,730 | $1.84 | 7d | 1 | 0.39mi |
| 4610 Barley St Orlando, FL | 2.0 | 1.0 | 805 | $1,699 | $2.11 | 23d | 1 | 0.43mi |
| 4333 Cynthia St Orlando, FL | 3.0 | 2.0 | 1039 | $1,813 | $1.74 | 21d | 1 | 0.62mi |
| 1036 Ola Dr Unit 2 Orlando, FL | 2.0 | 1.0 | 552 | $1,195 | $2.16 | 23d | 1 | 0.80mi |
| 5132 Elese St Orlando, FL | 3.0 | 2.0 | 960 | $1,800 | $1.88 | 16d | 1 | 0.83mi |
| 5235 Florida Holly Dr Orlando, FL | 3.0 | 2.0 | 1107 | $2,100 | $1.90 | 23d | 1 | 0.87mi |
| 3950 Columbia St Orlando, FL | 1.0–2.0 | 1.0–2.0 | 875 | $1,416 | $1.62 | 23d | 1 | 0.90mi |
| 1025 Clovercrest Rd Orlando, FL | 3.0 | 2.0 | 1050 | $2,100 | $2.00 | 23d | 1 | 0.94mi |
| 1025 Clovercrest Rd Orlando, FL | 3.0 | 2.0 | 1050 | $2,100 | $2.00 | 17d | 1 | 0.94mi |
| 3810 Thompson St Orlando, FL | 2.0 | 1.0 | 900 | $1,500 | $1.67 | 2d | 1 | 1.13mi |
| 2151 S Ivey Ln Orlando, FL | 3.0 | 1.5 | 1080 | $1,993 | $1.85 | 4d | 1 | 1.15mi |
| 3205 Orange Center Blvd Orlando, FL | 2.0 | 1.0 | 600 | $1,336 | $2.23 | 23d | 1 | 1.22mi |
| 907 S Kirkman Rd Orlando, FL | 2.0–4.0 | 2.0 | 1131 | $1,450 | $1.28 | 2d | 14 | 1.24mi |
| 3025 Long St Unit A Orlando, FL | 2.0 | 1.0 | 678 | $1,650 | $2.43 | 23d | 1 | 1.31mi |
| 464 S Kirkman Rd Orlando, FL | 1.0–3.0 | 1.0–2.0 | 977 | $1,890 | $1.93 | 2d | 19 | 1.40mi |
| 1401 S Kirkman Rd Orlando, FL | 1.0–3.0 | 1.0–2.0 | 975 | $1,804 | $1.85 | 1d | 32 | 1.41mi |
Listing history 24 events
-
2026-06-18days on market $149,000 Active 64 DOM
-
2026-06-17days on market $149,000 Active 63 DOM
-
2026-06-16days on market $149,000 Active 62 DOM
-
2026-06-15days on market $149,000 Active 61 DOM
-
2026-06-13days on market $149,000 Active 59 DOM
-
2026-06-13days on market $149,000 Active 58 DOM
-
2026-06-09days on market $149,000 Active 55 DOM
-
2026-06-08days on market $149,000 Active 54 DOM
-
2026-06-07pricedays on market $149,000 Active 53 DOM
-
2026-06-04days on market $149,900 Active 50 DOM
-
2026-06-03days on market $149,900 Active 49 DOM
-
2026-06-02days on market $149,900 Active 48 DOM
-
2026-06-02days on market $149,900 Active 47 DOM
-
2026-05-31days on market $149,900 Active 46 DOM
-
2026-05-14price $149,900
-
2026-05-07price $150,000
-
2026-04-27price $159,900
-
2026-04-20status Active
-
2026-04-12$169,900 Active
-
2016-03-28$40,000
-
2015-01-28soldstatus $32,000 Sold 39-char remark
Show marketing remark (39 chars)
Great for first time buyer or investor.
-
2015-01-10status Pending 39-char remark
Show marketing remark (39 chars)
Great for first time buyer or investor.
-
2015-01-03price $32,000 39-char remark
Show marketing remark (39 chars)
Great for first time buyer or investor.
-
2014-12-05$33,600 Active 39-char remark
Show marketing remark (39 chars)
Great for first time buyer or investor.
ⓘ Source: listings_history table (triggers on properties + properties_extension) + one-shot
backfill from property_details.listing_events for pre-trigger history.
Tax reassessment forecast FL · Resets to sale price
- Current annual tax
- $630 · $53/mo
- Projected year-2 tax
- $1,237 · $103/mo
- Expected delta
- +$607/yr (+$51/mo · 96.3%)
ⓘ Screening estimate from a state-policy table — verify with the county assessor before closing.
Climate risk First Street
- Flood 1/10 Low FEMA zone X (unshaded) · 0% chance over 30 yrs
- Wildfire 1/10 Low
- Heat 9/10 Extreme 7 d/yr ≥108°F today · 23 d/yr by 30 yrs out
- Wind 9/10 Extreme 99% chance of damaging wind over 30 yrs
- Air quality 1/10 Low 0 unhealthy d/yr today · 0 by 30 yrs out
Nearby sold comps map
Loading sold comps map…
Walkable amenities ~0.75 mi
Loading nearby amenities…
Taxation est. · year 1
- Rental income
- $18,793
- − Mortgage interest
- −$8,346
- − Property taxes
- −$630
- − Insurance
- −$745
- − Repairs & maintenance
- −$1,503
- − Management
- −$1,503
- − Depreciation
- −$4,335
- Taxable income
- $1,730
- Est. tax owed @ 24.0%
- −$415
- After-tax cash flow
- $3,680/yr
For passive investors: Depreciation is non-cash, so a rental often shows a tax loss while cash-flowing — sheltering income. Rental losses are passive: they offset passive income freely, and up to $25,000/yr can offset ordinary (W-2) income if you actively participate and your MAGI is under $100k (phasing out to $0 by $150k); unused losses carry forward. On sale, claimed depreciation is recaptured at up to 25%, and gains may owe capital-gains tax (a 1031 exchange can defer both). Figures are a year-1 estimate at your 24.0% rate — not tax advice; consult a CPA.
Schools (NCES district)
- District
- Orange
- NCES district ID
- 1201440
- Math proficiency
- 46% ▼ -9.00%
- Reading proficiency
- 51% ▼ -2.00%
- Median HH income
- $49,350
- Composite
- 41.47/100
- National rank
- #3461
- State rank
- #43 of 73 in FL
Livability — Orlando
- Score
- 86/100
- State rank
- #12
- US rank
- #360
Category grades
Schools grade is shown separately in the Schools card above.
Census & demographics
- County
- Orange County · 1,471,359 people
- City population
- 964,969
- Metro
- Orlando-Kissimmee-Sanford, FL
- Population (ZIP)
- 41,475
- Household income
- $54,082
- Rent vs Own
- Severe rent burden
- 2728.0
Population outlook (Orange County) Hauer SSP2
- Today (2025)
- 1,618,226 people
- By 2030
- 1,787,404 · +10.5%
- By 2040
- 2,125,621 · +31.4%
- By 2050
- 2,454,016 · +51.6%
- By 2075
- 3,173,711 · +96.1%
- By 2100
- 3,607,781 · +122.9%
Race, ethnicity, and origin ACS 2023
- Neighborhood character
- Diverse neighborhood (Simpson 0.66)
- Race & ethnicity
- Black 50% Hispanic / Latino 27% Two or more races 17% White 12% Asian 2%
- Hispanic origin (detail)
- Mexican 2% Puerto Rican 8% Dominican 2%
- Common ancestry
- Hispanic 7% Estonian 4% Russian 1%
- Foreign-born
- 31% · Canada, Jamaica, China
- Languages at home
- 62% English-only · Spanish 21% French/Haitian/Cajun 8% Other Indo-European 6%
Political lean MEDSL · Orange
- 2024 margin
- D (+13.6) · D 56.1% · R 42.5% · Other 1.3%
- 2008→2024 swing
- -5.0pp toward R · 2008: 18.6pp · 2024: 13.6pp
- All cycles
- 2024: D+13.6 2020: D+23.1 2016: D+24.6 2012: D+18.2 2008: D+18.6
Not yet ingested
- Civics
- —
Market trends
- HPI YoY
- ▼ -145.37%
- Current HPI
- 284.9191
- Rent YoY
- ▲ 0.15%
- Metro
- Orlando-Kissimmee-Sanford, FL
- State GDP YoY
- ▲ 3.28%
- F500 in state
- 36
Industry mix (Fortune 500 HQ in FL)
| Industry | F500 HQs | Revenue |
|---|---|---|
| Industrial Technology | 2 | $29B |
|
||
| Insurance | 2 | $17B |
|
||
| Retail | 1 | $60B |
|
||
| Technology Distribution | 1 | $58B |
|
||
| Homebuilding | 1 | $35B |
|
||
| Technology Manufacturing | 1 | $35B |
|
||
Price history
+346.1% since first listed10 events — show timeline
- 2026-05-14 Price Changed $149,900 Stellar MLS as Distributed by MLS Grid
- 2026-05-07 Price Changed $150,000 Stellar MLS as Distributed by MLS Grid
- 2026-04-27 Price Changed $159,900 Stellar MLS as Distributed by MLS Grid
- 2026-04-20 Relisted — Stellar MLS as Distributed by MLS Grid
- 2026-04-12 Listed $169,900 Stellar MLS as Distributed by MLS Grid
- 2016-03-28 Listed $40,000 Stellar MLS as Distributed by MLS Grid
- 2015-01-28 Sold (MLS) $32,000 Stellar MLS as Distributed by MLS Grid
- 2015-01-10 Pending — Stellar MLS as Distributed by MLS Grid
- 2015-01-03 Price Changed $32,000 Stellar MLS as Distributed by MLS Grid
- 2014-12-05 Listed $33,600 Stellar MLS as Distributed by MLS Grid
Property tax history
-0.1%/yrLatest (2025): $630 · +23.2% YoY. Source: county tax records.
Cash-flow waterfall
monthlySold comps — $/sqft
last 12 mo · ≤1 miLoading sold comps…