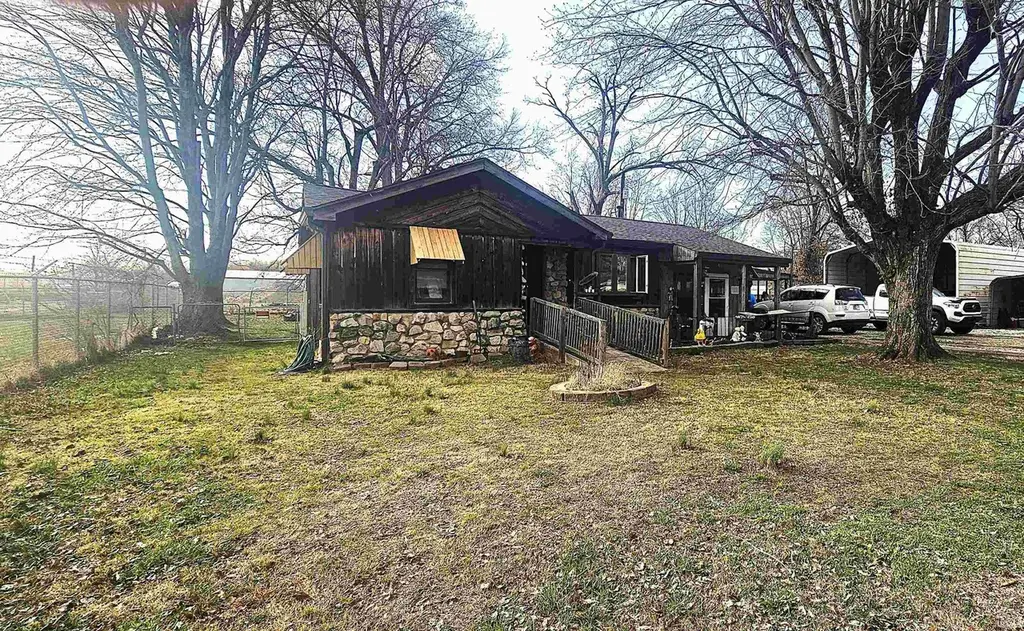
132 N Kentucky Ave · Chandler, IN
Flood risk 1/10 · Minimal
- FEMA flood zone
- X (unshaded)
- Chance of flooding over 30 yrs
- 0.0%
- Est. flood insurance / yr
- $507 – $1,088
Fire risk 1/10 · Minimal
- Est. fire insurance / yr
- $717 – $1,331
Heat risk 5/10 · Moderate
- Hot days now (above 106°F)
- 7 days/yr
- Hot days in 30 yrs
- 19 days/yr
Wind risk 2/10 · Minimal
- Chance of severe wind over 30 yrs
- 4.0%
Air-quality risk 4/10 · Minor
- Unhealthy air days now
- 4 days/yr
- Unhealthy air days in 30 yrs
- 6 days/yr
Risk factors via First Street. Map © Google.
Why this score? — see what drove the C- grade
The composite is a weighted blend of 9 inputs, each scored 0–100. Each bar is that input's sub-score; the figure is the points it added to the 100-point composite (weight × sub-score).
- Cash flow +17.5/30.0
- ARV discount +10.5/15.0
- DSCR +5.5/10.0
- Schools +4.9/10.0
- 1% rule +3.8/10.0
- Livability +3.3/5.0
- Rent growth +2.5/5.0
- Condition / age +2.5/5.0
- Appreciation +0.0/10.0
$175,000
🖨 Deal sheet 📄 Offer letter ✓ Due diligence
Listing remarks MLS
2-bedroom, 1-bath home situated on a spacious . 54-acre lot on a peaceful dead-end street. Enjoy the large, additional living area and a versatile flex room, waiting to be finished to fit your family's needs. There are recently purchased kitchen appliances, an updated roof, and a new HVAC system. Outside, you can relax on the covered back porch. There are also multiple, large carport and storage areas for your convenience.
Key facts
- Spacious lot
- Flex room
- Updated roof
Tags
Neighborhood map
What this means for you Summary
Snapshot
- This is a 3-bed/1.0-bath single-family listed at $175k.
Deal economics
- At list price, monthly cash flow is $135 ($2k/yr) — positive.
- The deal already cash-flows at list — no discount required.
- To meet the 1% rule (rent ≥ 1% of price), the offer needs to be $153k (12.4% below list).
- Recommended offer: $153k (12.4% below list) — sets the bar for 1% rule.
- Cap rate 7.2% vs local median 3.9% in Chandler — top-decile yield for the area; either an underpriced asset or a hidden risk that comps aren't pricing in. Stress-test before assuming the spread holds.
Location & tenants
- Location reads 66/100 on livability (#282 in IN) — a middle-class / working-renter tenant base. Strengths: cost of living A+, housing A+, crime A; Watch: employment D+, amenities F, commute F.
- Warrick County School Corporation (suburban): math 54% / reading 59% proficiency, ranked #24 of 301 in IN (top 8%) — acceptable for families but not a draw, mixed tenant base, ~2y average lease.
- Market conditions: 63 active listings in the ZIP; 249 units permitted in Warrick County in 2024 (0 in 5+ unit buildings).
Forward outlook
- Local home prices are declining (-3.0%/yr); year-one equity from $1k of loan paydown is wiped out by about $5k of value loss. Plan a longer hold.
- Warrick County population projected at +9% by 2050 — modest demand growth; plan on rents tracking national, not racing it.
Negotiation context
- It's been on market 86 days — a 6% lower offer ($164k) is reasonable based on typical stale-listing flexibility.
Risks & watch-outs
- Watch-outs: built in 1958 — expect roof / HVAC / electrical / plumbing capex.
- Climate carrying-cost: extreme-heat days projected 7→19/yr by 2055 (HVAC capex compounding) — expect insurance premiums to compound above CPI over the hold.
Questions for the listing agent
- It's been on market 86 days. Have you received any prior offers? Is the seller open to a 12% concession, seller financing, or rate buy-down credit?
- Built in 1958 — when were the roof, HVAC, electrical panel, plumbing, and water heater last replaced?
- Why hasn't it sold? Are there any deal-killer items the seller is aware of (foundation, flood, title, zoning, code violations)?
- Is there a deadline driving the sale (1031 exchange, divorce, estate, relocation)? That informs how much negotiation room exists.
- What's the average days-on-market for RENTAL listings here right now (not sales)? A rising rental-DOM trend means longer vacancies and softer asking-rent achievability than the comps imply.
- What's the recent tenant-quality profile in this submarket — average credit score on applications, eviction rate, late-payment / NSF rate, and stable-employment percentage? A property-management company in the area should have these aggregated.
- How much new for-sale + rental construction is in the pipeline within 1–3 miles? Heavy new supply typically softens prices + rents 12–24 months out; constrained supply supports both.
Investment metrics
- 1% rule
- 0.88% ✗
- Cap rate
- 7.22%
- Cash-on-cash
- 3.29%
- DSCR
- 1.15
- GRM
- 9.5
CMA / ARV
- ARV (median comp)
- $187,392
- List price
- $175,000
- Delta
- -6.61%
- Verdict
- FAIR
- Comps
- 20 within 1.0 mi
Show comp detail 12 sales within ~0.75 mi
| Address | Dist | Beds/Ba | Sqft | Sold | Price | $/sf | Match |
|---|---|---|---|---|---|---|---|
| 899 Inderrieden Rd | 0.34mi | 3/2.0 | 1,356 (-8%) | 0mo | $185,000 | $136 | 66 |
| 116 E Washington St | 0.43mi | 2/2.0 (-1) | 1,470 (-1%) | 9mo | $100,000 | $68 | 62 |
| 216 S Kentucky Ave | 0.24mi | 3/1.5 | 1,302 (-12%) | 8mo | $199,900 | $154 | 60 |
| 999 Inderrieden Rd | 0.41mi | 3/2.0 | 1,573 (+6%) | 9mo | $230,000 | $146 | 58 |
| 302 Green Valley Dr | 0.45mi | 3/1.0 | 1,325 (-10%) | 6mo | $187,000 | $141 | 57 |
| 817 N Illinois St | 0.52mi | 3/1.0 | 1,325 (-10%) | 2mo | $191,000 | $144 | 57 |
| 201 E Williams St | 0.44mi | 4/2.0 (+1) | 1,414 (-4%) | 12mo | $219,500 | $155 | 52 |
| 301 N State St | 0.40mi | 2/2.0 (-1) | 1,652 (+12%) | 4mo | $125,000 | $76 | 50 |
| 509 E Jefferson Ave | 0.67mi | 3/2.0 | 1,670 (+13%) | 0mo | $230,500 | $138 | 43 |
| 220 S 4th St | 0.61mi | 4/2.0 (+1) | 1,416 (-4%) | 15mo | $125,500 | $89 | 43 |
| 526 E Jackson Ave | 0.73mi | 3/1.0 | 1,344 (-9%) | 11mo | $216,000 | $161 | 41 |
| 510 E Madison Ave | 0.66mi | 4/2.0 (+1) | 1,632 (+10%) | 13mo | $219,900 | $135 | 32 |
Match score weights: distance 35% · size 25% · config 20% · recency 20%. Top-matched comps best support the ARV.
Projected returns pro-forma
-3.0% appreciation · 3.0% rent growth · sell at horizon
- IRR
- -11.2%
- Equity multiple
- 0.59×
- Total profit
- $-19,847
- Equity at exit
- $26,093
- IRR
- -2.0%
- Equity multiple
- 0.87×
- Total profit
- $-6,486
- Equity at exit
- $15,131
Cash invested: $49,000 (down + closing). Projections, not guarantees.
Landlord ↔ Tenant lean methodology
- Overall (STATE)
- 90 Strongly Landlord-Friendly
- State Indiana
- 90 Strongly Landlord-Friendly · R+11
- County
- — inherits STATE
- City
- — inherits STATE
ZIP-level market 47610
- Home prices YoY
- -23.6%
- Active inventory
- 63
- Price-to-rent
- 9.5×
Monthly cashflow live
- Estimated rent
- $1,533 medium interval (Pro) →
- Mortgage (P&I)
- −$918
- Tax from tax record
- −$86 /mo · $1,035/yr
- Insurance
- −$73
- HOA
- −$0
- Vacancy / Maint / Mgmt
- −$322
- Net cashflow
- $135
Break-even live
UW: 25.0% down · 7.5% · 30yr · 1.5% tax · 5.0% vac · 8.0% maint · 8.0% mgmt
Financing live
Cash to close
- Down payment
- $43,750
- Closing costs
- $5,250
- Reserves months
- —
- Total cash needed
- —
Loan-product check · same deal, 3 products live
Conventional
25% down · 7.5% · 30yr
- Down + closing
- —
- Monthly P&I
- —
- Monthly cashflow
- —
- DSCR
- —
- Eligible?
- —
Personal DTI + credit; lowest rate.
DSCR
20% down · 8.5% · 30yr
- Down + closing
- —
- Monthly P&I
- —
- Monthly cashflow
- —
- DSCR
- —
- Eligible?
- —
No personal income docs; deal must DSCR.
Hard money
10% down · 12.0% · 12mo
- Down + closing
- —
- Monthly P&I
- —
- Monthly cashflow
- —
- DSCR
- —
- Eligible?
- —
Short-term bridge; refi at stabilization.
Listing history 15 events
-
2026-06-18days on market $175,000 Active 86 DOM
-
2026-06-17days on market $175,000 Active 85 DOM
-
2026-06-16days on market $175,000 Active 84 DOM
-
2026-06-15days on market $175,000 Active 83 DOM
-
2026-06-14days on market $175,000 Active 81 DOM
-
2026-06-13days on market $175,000 Active 80 DOM
-
2026-06-10days on market $175,000 Active 78 DOM
-
2026-06-09days on market $175,000 Active 77 DOM
-
2026-06-08days on market $175,000 Active 76 DOM
-
2026-06-07days on market $175,000 Active 75 DOM
-
2026-06-02days on market $175,000 Active 70 DOM
-
2026-06-01days on market $175,000 Active 69 DOM
-
2026-05-31days on market $175,000 Active 68 DOM
-
2026-05-30days on market $175,000 Active 67 DOM
-
2026-03-24$180,000 Active 426-char remark
Show marketing remark (426 chars)
2-bedroom, 1-bath home situated on a spacious . 54-acre lot on a peaceful dead-end street. Enjoy the large, additional living area and a versatile flex room, waiting to be finished to fit your family's needs. There are recently purchased kitchen appliances, an updated roof, and a new HVAC system. Outside, you can relax on the covered back porch. There are also multiple, large carport and storage areas for your convenience.
ⓘ Source: listings_history table (triggers on properties + properties_extension) + one-shot
backfill from property_details.listing_events for pre-trigger history.
Tax reassessment forecast IN · Partial reset (capped growth)
- Current annual tax
- $1,035 · $86/mo
- Projected year-2 tax
- $1,261 · $105/mo
- Expected delta
- +$226/yr (+$19/mo · 21.8%)
ⓘ Screening estimate from a state-policy table — verify with the county assessor before closing.
Climate risk First Street
- Flood 1/10 Low FEMA zone X (unshaded) · 0% chance over 30 yrs
- Wildfire 1/10 Low
- Heat 5/10 Major 7 d/yr ≥106°F today · 19 d/yr by 30 yrs out
- Wind 2/10 Low 4% chance of damaging wind over 30 yrs
- Air quality 4/10 Moderate 4 unhealthy d/yr today · 6 by 30 yrs out
Nearby sold comps map
Loading sold comps map…
Walkable amenities ~0.75 mi
Loading nearby amenities…
Taxation est. · year 1
- Rental income
- $18,402
- − Mortgage interest
- −$9,803
- − Property taxes
- −$1,035
- − Insurance
- −$875
- − Repairs & maintenance
- −$1,472
- − Management
- −$1,472
- − Depreciation
- −$5,091
- Taxable loss
- −$1,346
- Est. tax savings @ 24.0%
- +$323
- After-tax cash flow
- $1,938/yr
For passive investors: Depreciation is non-cash, so a rental often shows a tax loss while cash-flowing — sheltering income. Rental losses are passive: they offset passive income freely, and up to $25,000/yr can offset ordinary (W-2) income if you actively participate and your MAGI is under $100k (phasing out to $0 by $150k); unused losses carry forward. On sale, claimed depreciation is recaptured at up to 25%, and gains may owe capital-gains tax (a 1031 exchange can defer both). Figures are a year-1 estimate at your 24.0% rate — not tax advice; consult a CPA.
Schools (NCES district)
- District
- Warrick County School Corporation
- NCES district ID
- 1812390
- Math proficiency
- 54% ▼ -8.00%
- Reading proficiency
- 59% ▼ -6.00%
- Median HH income
- $62,801
- Composite
- 49.38/100
- National rank
- #2014
- State rank
- #24 of 301 in IN
Livability — Chandler
- Score
- 66/100
- State rank
- #282
- US rank
- #11582
Category grades
Schools grade is shown separately in the Schools card above.
Census & demographics
- Census place
- Chandler, IN
- Population (ZIP)
- 5,695
Population outlook (Warrick County) Hauer SSP2
- Today (2025)
- 66,569 people
- By 2030
- 68,404 · +2.8%
- By 2040
- 71,131 · +6.9%
- By 2050
- 72,743 · +9.3%
- By 2075
- 76,088 · +14.3%
- By 2100
- 72,261 · +8.6%
Race, ethnicity, and origin ACS 2023
- Neighborhood character
- Predominantly White (95%)
- Race & ethnicity
- White 95% Two or more races 5%
- Common ancestry
- Lithuanian 3% Italian 2% Slovak 1%
- Foreign-born
- 1%
- Languages at home
- 98% English-only · Tagalog/Filipino 1%
Political lean MEDSL · Warrick
- 2024 margin
- Solid R (+30.2) · D 34.1% · R 64.3% · Other 1.5%
- 2008→2024 swing
- -17.4pp toward R · 2008: -12.8pp · 2024: -30.2pp
- All cycles
- 2024: R+30.2 2020: R+27.8 2016: R+33.9 2012: R+26.6 2008: R+12.8
Not yet ingested
- Civics
- —
Market trends
- HPI YoY
- ▼ -72.36%
- Current HPI
- 234.6102
- Rent YoY
- —
- Metro
- —
- State GDP YoY
- ▲ 2.90%
- F500 in state
- 18
Industry mix (Fortune 500 HQ in IN)
| Industry | F500 HQs | Revenue |
|---|---|---|
| Industrial Machinery | 2 | $37B |
|
||
| Healthcare | 1 | $177B |
|
||
| Pharmaceuticals | 1 | $45B |
|
||
| Metals / Steel | 1 | $18B |
|
||
| Agriculture | 1 | $17B |
|
||
| Packaging | 1 | $12B |
|
||
Price history
1 event — show timeline
- 2026-03-24 Listed $180,000 IRMLS
Property tax history
+7.8%/yrLatest (2024): $1,035 · +13.2% YoY. Source: county tax records.
Cash-flow waterfall
monthlySold comps — $/sqft
last 12 mo · ≤1 miLoading sold comps…