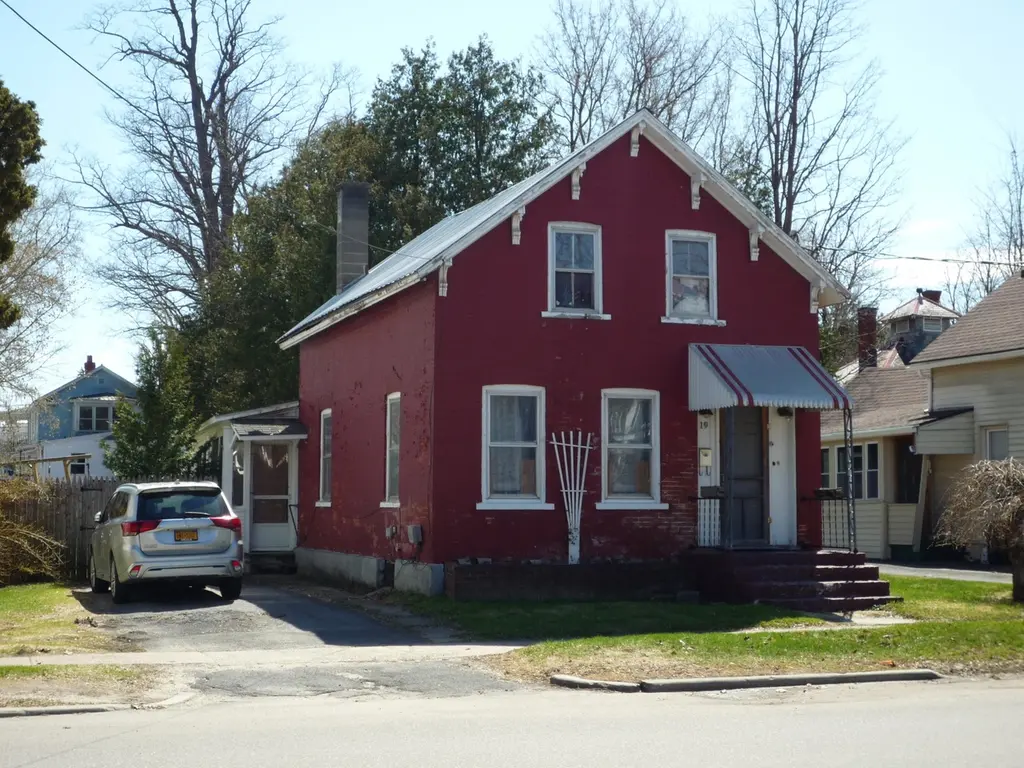
119 Cornelia St · Plattsburgh, NY
Flood risk 1/10 · Minimal
- FEMA flood zone
- X (unshaded)
- Chance of flooding over 30 yrs
- 0.0%
- Est. flood insurance / yr
- $507 – $1,088
Fire risk 3/10 · Minor
- Est. fire insurance / yr
- $691 – $1,283
Heat risk 3/10 · Minor
- Hot days now (above 93°F)
- 7 days/yr
- Hot days in 30 yrs
- 15 days/yr
Wind risk 1/10 · Minimal
- Chance of severe wind over 30 yrs
- 0.0%
Air-quality risk 2/10 · Minimal
- Unhealthy air days now
- 1 days/yr
- Unhealthy air days in 30 yrs
- 1 days/yr
Risk factors via First Street. Map © Google.
Why this score? — see what drove the C grade
The composite is a weighted blend of 9 inputs, each scored 0–100. Each bar is that input's sub-score; the figure is the points it added to the 100-point composite (weight × sub-score).
- Cash flow +17.4/30.0
- ARV discount +15.0/15.0
- 1% rule +5.8/10.0
- DSCR +5.4/10.0
- Livability +3.8/5.0
- Schools +3.7/10.0
- Rent growth +2.5/5.0
- Condition / age +2.5/5.0
- Appreciation +0.0/10.0
$135,000
🖨 Deal sheet 📄 Offer letter ✓ Due diligence
Listing remarks
This cute city is conveniently located near downtown Plattsburgh and local amenities. Unusual for a home this age, it features a full bath on both floors and a first level bedroom. Private fenced in back yard. With a little TLC, this home will shine again. Pre-qualified buyers only for showings.
Key facts
- First level bedroom
- 4,356 sq ft lot
- 2 parking spots
Tags
Property features AI
Finance
- Other: Residential property
Exterior
- Parking: Open parking with 2 spaces
- Utilities: Public water; Public sewer; 100 Amp electric service; Cable available; Water connected; Sewer connected
- Home design: Single-family residence; Two levels / 2 stories
- Construction: Brick construction; Stone foundation; Built on two levels
- Exterior features: Metal roof; Lot approximately 0.1 acre (46 x 90)
Interior
- Kitchen: Electric range; Refrigerator
- Bedrooms: 1 bedroom on the main level
- Flooring: Carpet
- Bathrooms: 2 full bathrooms (1 on the main level)
- Heating & cooling: Electric heating; No cooling
- Interior features: Electric range and refrigerator; Crawl space basement; 5 total rooms
- Laundry & utility: No separate laundry details provided
Neighborhood map
What this means for you Summary
Snapshot
- This is a 3-bed/2.0-bath single-family listed at $135k.
Deal economics
- At list price, monthly cash flow is $102 ($1k/yr) — positive.
- The deal already cash-flows at list — no discount required.
- Meets the 1% rule at list price ($1k rent vs $135k).
- Recommended offer: $131k (3.0% below list) — sets the bar for market timing.
- Cap rate 7.2% vs local median 2.8% in Plattsburgh — top-decile yield for the area; either an underpriced asset or a hidden risk that comps aren't pricing in. Stress-test before assuming the spread holds.
Location & tenants
- Location reads 75/100 on livability (#262 in NY, #4,134 nationally) — a middle-class / working-renter tenant base. Strengths: health & safety A+, cost of living A, housing A; Watch: schools C-, employment D+, crime F.
- Plattsburgh City School District (town): math 33% / reading 55% proficiency, ranked #484 of 590 in NY (top 82%) — families likely to look elsewhere, expect single-tenant / working-renter base with shorter leases.
- Market conditions: 176 active listings in the ZIP; 2 comparable units currently listed for rent nearby; 192 units permitted in Clinton County in 2024 (64 in 5+ unit buildings).
Forward outlook
- Local home prices are declining (-3.0%/yr); year-one equity from $933 of loan paydown is wiped out by about $4k of value loss. Plan a longer hold.
- Clinton County population projected at -16% by 2050 — secular population decline; favor cash flow + early exit over multi-decade hold.
Negotiation context
- It's been on market 48 days — a 3% lower offer ($131k) is reasonable based on typical stale-listing flexibility.
- Current owner paid $75k; list at $135k implies a 80% gain — meaningful room to come down on a strong offer.
Risks & watch-outs
- Watch-outs: property tax is 2.5% of price; built in 1876 — expect roof / HVAC / electrical / plumbing capex.
Questions for the listing agent
- It's been on market 48 days. Have you received any prior offers? Is the seller open to a 3% concession, seller financing, or rate buy-down credit?
- Built in 1876 — when were the roof, HVAC, electrical panel, plumbing, and water heater last replaced?
- Property tax is high relative to price — has the assessment been appealed recently, and will the sale trigger a re-assessment?
- Is there a deadline driving the sale (1031 exchange, divorce, estate, relocation)? That informs how much negotiation room exists.
- Crime grade is F in this area — have there been break-ins, vandalism, or insurance claims at this property in the last 3 years? What carrier currently insures it and at what premium?
- What's the average days-on-market for RENTAL listings here right now (not sales)? A rising rental-DOM trend means longer vacancies and softer asking-rent achievability than the comps imply.
- What's the recent tenant-quality profile in this submarket — average credit score on applications, eviction rate, late-payment / NSF rate, and stable-employment percentage? A property-management company in the area should have these aggregated.
- How much new for-sale + rental construction is in the pipeline within 1–3 miles? Heavy new supply typically softens prices + rents 12–24 months out; constrained supply supports both.
Investment metrics
- 1% rule
- 1.08% ✓
- Cap rate
- 7.20%
- Cash-on-cash
- 3.23%
- DSCR
- 1.14
- GRM
- 7.7
CMA / ARV
- ARV (median comp)
- $195,948
- List price
- $135,000
- Delta
- -31.10%
- Verdict
- UNDERPRICED
- Comps
- 20 within 1.0 mi
Show comp detail 12 sales within ~0.75 mi
| Address | Dist | Beds/Ba | Sqft | Sold | Price | $/sf | Match |
|---|---|---|---|---|---|---|---|
| 21 Montcalm Ave | 0.09mi | 3/— | 1,140 (+1%) | 2mo | $42,000 | $37 | 93 |
| 14 Champlain Street St | 0.11mi | 3/2.0 | 1,233 (+9%) | 2mo | $85,000 | $69 | 78 |
| 111 Cornelia Street St | 0.03mi | 3/2.0 | 1,245 (+10%) | 9mo | $110,000 | $88 | 74 |
| 98 Champlain Street St | 0.39mi | 3/2.0 | 1,166 (+3%) | 10mo | $227,900 | $195 | 68 |
| 75 Champlain St | 0.31mi | 3/1.5 | 1,205 (+7%) | 11mo | $147,340 | $122 | 63 |
| 64 Elm St | 0.19mi | 2/1.0 (-1) | 1,224 (+8%) | 7mo | $225,000 | $184 | 62 |
| 35 Palmer St | 0.34mi | 2/1.0 (-1) | 1,106 (-2%) | 12mo | $210,000 | $190 | 61 |
| 7 Saranac St | 0.56mi | 2/2.0 (-1) | 1,112 (-2%) | 7mo | $112,000 | $101 | 60 |
| 1 Oliver Ct | 0.54mi | 3/1.0 | 1,186 (+5%) | 3mo | $220,000 | $185 | 60 |
| 81 Lafayfayette | 0.33mi | 2/1.0 (-1) | 1,055 (-7%) | 6mo | $170,000 | $161 | 60 |
| 88 Pine Street St | 0.71mi | 2/1.5 (-1) | 1,169 (+4%) | 6mo | $156,955 | $134 | 49 |
| 5247 N North Catherine St | 0.38mi | 4/1.0 (+1) | 1,260 (+12%) | 10mo | $229,900 | $182 | 46 |
Match score weights: distance 35% · size 25% · config 20% · recency 20%. Top-matched comps best support the ARV.
Projected returns pro-forma
-3.0% appreciation · 3.0% rent growth · sell at horizon
- IRR
- -11.1%
- Equity multiple
- 0.60×
- Total profit
- $-15,306
- Equity at exit
- $20,129
- IRR
- -1.8%
- Equity multiple
- 0.88×
- Total profit
- $-4,615
- Equity at exit
- $11,672
Cash invested: $37,800 (down + closing). Projections, not guarantees.
Landlord ↔ Tenant lean methodology
- Overall (STATE)
- 15 Strongly Tenant-Friendly
- State New York
- 15 Strongly Tenant-Friendly · D+10
- County
- — inherits STATE
- City
- — inherits STATE
ZIP-level market 12901
- Home prices YoY
- -22.5%
- Active inventory
- 176
- Price-to-rent
- 7.7×
Monthly cashflow live
- Estimated rent
- $1,453 medium interval (Pro) →
- Mortgage (P&I)
- −$708
- Tax from tax record
- −$282 /mo · $3,381/yr
- Insurance
- −$56
- HOA
- −$0
- Vacancy / Maint / Mgmt
- −$305
- Net cashflow
- $102
Break-even live
UW: 25.0% down · 7.5% · 30yr · 1.5% tax · 5.0% vac · 8.0% maint · 8.0% mgmt
Financing live
Cash to close
- Down payment
- $33,750
- Closing costs
- $4,050
- Reserves months
- —
- Total cash needed
- —
Loan-product check · same deal, 3 products live
Conventional
25% down · 7.5% · 30yr
- Down + closing
- —
- Monthly P&I
- —
- Monthly cashflow
- —
- DSCR
- —
- Eligible?
- —
Personal DTI + credit; lowest rate.
DSCR
20% down · 8.5% · 30yr
- Down + closing
- —
- Monthly P&I
- —
- Monthly cashflow
- —
- DSCR
- —
- Eligible?
- —
No personal income docs; deal must DSCR.
Hard money
10% down · 12.0% · 12mo
- Down + closing
- —
- Monthly P&I
- —
- Monthly cashflow
- —
- DSCR
- —
- Eligible?
- —
Short-term bridge; refi at stabilization.
Rent comps 2 comps
| Address | Beds | Baths | Sqft | Rent | $/sqft | DOM | Units | Dist |
|---|---|---|---|---|---|---|---|---|
| 5061 S Catherine St Plattsburgh, NY | 2.0 | 1.0 | 850 | $1,400 | $1.65 | 21d | 1 | 0.46mi |
| 43 Hamilton St Plattsburgh, NY | 1.0–2.0 | 1.0 | 800 | $1,550 | $1.94 | 21d | 2 | 0.79mi |
Listing history 17 events
-
2026-06-18days on market $135,000 Active 48 DOM
-
2026-06-17days on market $135,000 Active 47 DOM
-
2026-06-16days on market $135,000 Active 46 DOM
-
2026-06-15days on market $135,000 Active 45 DOM
-
2026-06-13days on market $135,000 Active 43 DOM
-
2026-06-12days on market $135,000 Active 42 DOM
-
2026-06-09days on market $135,000 Active 39 DOM
-
2026-06-08days on market $135,000 Active 38 DOM
-
2026-06-07days on market $135,000 Active 37 DOM
-
2026-06-07days on market $135,000 Active 36 DOM
-
2026-06-04days on market $135,000 Active 33 DOM
-
2026-06-02days on market $135,000 Active 32 DOM
-
2026-06-01days on market $135,000 Active 31 DOM
-
2026-05-31days on market $135,000 Active 30 DOM
-
2026-05-01$135,000 Active 296-char remark
-
2008-04-25soldstatus $75,000
-
2001-02-12soldstatus $46,000
ⓘ Source: listings_history table (triggers on properties + properties_extension) + one-shot
backfill from property_details.listing_events for pre-trigger history.
Tax reassessment forecast NY · Partial reset (capped growth)
- Current annual tax
- $3,381 · $282/mo
- Projected year-2 tax
- $3,381 · $282/mo
- Expected delta
- $0/yr ($0/mo · 0.0%)
ⓘ Screening estimate from a state-policy table — verify with the county assessor before closing.
Climate risk First Street
- Flood 1/10 Low FEMA zone X (unshaded) · 0% chance over 30 yrs
- Wildfire 3/10 Moderate
- Heat 3/10 Moderate 7 d/yr ≥93°F today · 15 d/yr by 30 yrs out
- Wind 1/10 Low 0% chance of damaging wind over 30 yrs
- Air quality 2/10 Low 1 unhealthy d/yr today · 1 by 30 yrs out
Nearby sold comps map
Loading sold comps map…
Walkable amenities ~0.75 mi
Loading nearby amenities…
Taxation est. · year 1
- Rental income
- $17,434
- − Mortgage interest
- −$7,562
- − Property taxes
- −$3,381
- − Insurance
- −$675
- − Repairs & maintenance
- −$1,395
- − Management
- −$1,395
- − Depreciation
- −$3,927
- Taxable loss
- −$902
- Est. tax savings @ 24.0%
- +$216
- After-tax cash flow
- $1,437/yr
For passive investors: Depreciation is non-cash, so a rental often shows a tax loss while cash-flowing — sheltering income. Rental losses are passive: they offset passive income freely, and up to $25,000/yr can offset ordinary (W-2) income if you actively participate and your MAGI is under $100k (phasing out to $0 by $150k); unused losses carry forward. On sale, claimed depreciation is recaptured at up to 25%, and gains may owe capital-gains tax (a 1031 exchange can defer both). Figures are a year-1 estimate at your 24.0% rate — not tax advice; consult a CPA.
Schools (NCES district)
- District
- Plattsburgh City School District
- NCES district ID
- 3623280
- Math proficiency
- 33% ▼ -16.00%
- Reading proficiency
- 55% ▲ 5.00%
- Median HH income
- $38,322
- Composite
- 36.61/100
- National rank
- #4626
- State rank
- #484 of 590 in NY
Livability — Plattsburgh
- Score
- 75/100
- State rank
- #262
- US rank
- #4134
Category grades
Schools grade is shown separately in the Schools card above.
Census & demographics
- Census place
- Plattsburgh, NY
- Population (ZIP)
- 32,012
Population outlook (Clinton County) Hauer SSP2
- Today (2025)
- 78,791 people
- By 2030
- 76,848 · -2.5%
- By 2040
- 71,579 · -9.2%
- By 2050
- 66,471 · -15.6%
- By 2075
- 57,361 · -27.2%
- By 2100
- 47,232 · -40.1%
Race, ethnicity, and origin ACS 2023
- Neighborhood character
- Predominantly White (87%)
- Race & ethnicity
- White 87% Two or more races 5% Hispanic / Latino 4% Black 3% Asian 3%
- Common ancestry
- Lithuanian 15% Romanian 3% Slovak 2%
- Foreign-born
- 6% · Canada, China
- Languages at home
- 92% English-only · Spanish 2% French/Haitian/Cajun 2% Other Indo-European 1%
Political lean MEDSL · Clinton
- 2024 margin
- Toss-up / Even · D 48.9% · R 51.1%
- 2008→2024 swing
- -25.1pp toward R · 2008: 22.9pp · 2024: -2.2pp
- All cycles
- 2024: R+2.2 2020: D+5.2 2016: D+0.9 2012: D+25.6 2008: D+22.9
Not yet ingested
- Civics
- —
Market trends
- HPI YoY
- ▼ -73.55%
- Current HPI
- 252.8692
- Rent YoY
- —
- Metro
- —
- State GDP YoY
- ▲ 2.60%
- F500 in state
- 92
Industry mix (Fortune 500 HQ in NY)
| Industry | F500 HQs | Revenue |
|---|---|---|
| Financial Services | 10 | $950B |
|
||
| Consumer Goods | 9 | $162B |
|
||
| Insurance | 4 | $225B |
|
||
| Telecommunications | 2 | $144B |
|
||
| Pharmaceuticals | 2 | $112B |
|
||
| Media / Entertainment | 2 | $69B |
|
||
Price history
+193.5% since first listed3 events — show timeline
- 2026-05-01 Listed $135,000 ACVMLS
- 2008-04-25 Sold (Public Records) $75,000 Public Records
- 2001-02-12 Sold (Public Records) $46,000 Public Records
Property tax history
+1.0%/yrLatest (2025): $3,381 · +5.6% YoY. Source: county tax records.
Cash-flow waterfall
monthlySold comps — $/sqft
last 12 mo · ≤1 miLoading sold comps…