 6-Plex
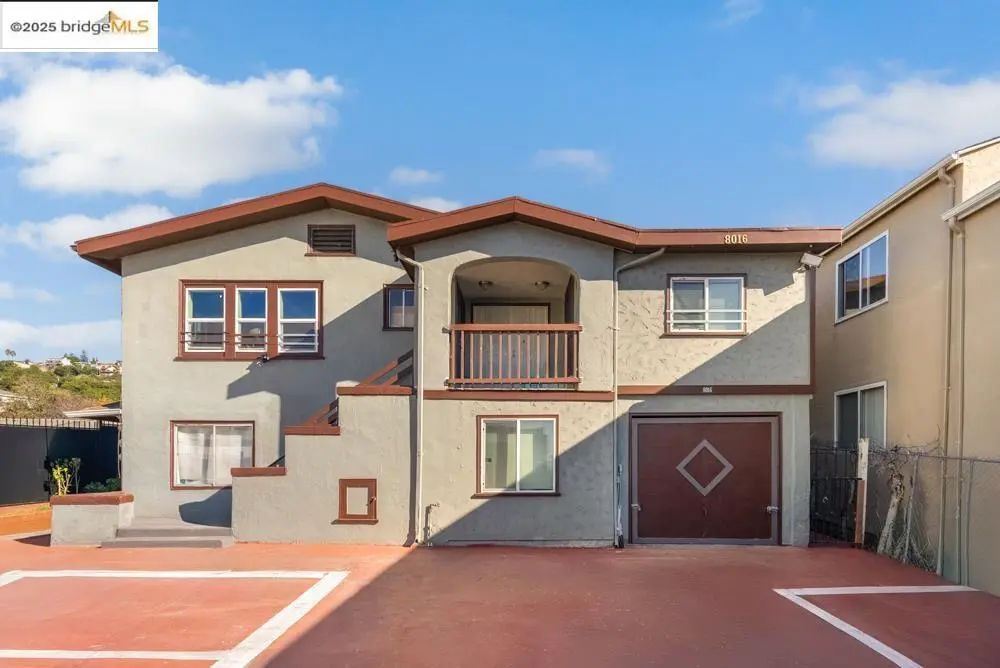
8016 Macarthur Blvd · Oakland, CA
Flood risk No data
- FEMA flood zone
- —
- Chance of flooding over 30 yrs
- —
- Est. flood insurance / yr
- —
Fire risk No data
- Est. fire insurance / yr
- —
Heat risk No data
- Hot days now (above threshold)
- —
- Hot days in 30 yrs
- —
Wind risk No data
- Chance of severe wind over 30 yrs
- —
Air-quality risk No data
- Unhealthy air days now
- —
- Unhealthy air days in 30 yrs
- —
Risk factors via First Street. Map © Google.
Why this score? — see what drove the B grade
The composite is a weighted blend of 9 inputs, each scored 0–100. Each bar is that input's sub-score; the figure is the points it added to the 100-point composite (weight × sub-score).
- Cash flow +28.9/30.0
- ARV discount +11.6/15.0
- DSCR +10.0/10.0
- 1% rule +8.0/10.0
- Livability +3.6/5.0
- Schools +3.0/10.0
- Rent growth +2.7/5.0
- Condition / age +2.5/5.0
- Appreciation +0.0/10.0
$895,000
🖨 Deal sheet 📄 Offer letter ✓ Due diligence
Multi-family units
County records classify this as Multi-Family (2-4 Unit). Listing-text estimate: 6 units. estimate disagrees with records
Listing remarks MLS
6-unit mixed-use building with excellent current income with a current cap rate of 12.49% and a current GRM of 5.70! The property offers two retail units in the front building and four residential units in the rear building. The property was built in 1938, offers 4,225 square feet of rental space, and sits on an oversized 9,998 square foot lot with a huge backyard and ample parking. The front retail units have two tenants but can be delivered vacant at closing. The rear building offers one 4bd/2bth unit, one 3bd/1bth unit, and two 2bd/1bth units. The backyard is huge and offers the potential for expansion or ADU development. The units are large and offer a variety of upgrades including newer kitchens and bathrooms, double pane windows, a newer roof, newer flooring, and more. The property is easy to manage and is separately metered for PG&E providing for low annual operating expenses. The tenants are nice, cooperative, and easy to manage making this an ideal property for an investor seeking max income or an owner-occupant seeking a variety of options with unbeatable cash flow to offset the mortgage.
Key facts
- Ample parking
- Huge backyard
- Mixed-use building
Tags
Neighborhood map
What this means for you Summary
Snapshot
- This is a 6 × 2-bed/?-bath units multifamily listed at $895k.
Deal economics
- At list price, monthly cash flow is $3k ($36k/yr) — positive. Per door: $504/mo.
- The deal already cash-flows at list — no discount required.
- Meets the 1% rule at list price ($12k rent vs $895k).
- Recommended offer: $788k (12.0% below list) — sets the bar for market timing.
- Cap rate 10.4% vs local median 2.4% in Oakland — top-decile yield for the area; either an underpriced asset or a hidden risk that comps aren't pricing in. Stress-test before assuming the spread holds.
Location & tenants
- Location reads 71/100 on livability (#224 in CA) — a middle-class / working-renter tenant base. Strengths: amenities A+, commute A+, employment A+; Watch: schools C-, crime F, cost of living F.
- Oakland Unified (urban): math 27% / reading 33% proficiency, ranked #1,007 of 1,400 in CA (top 72%) — families likely to look elsewhere, expect single-tenant / working-renter base with shorter leases; 68% free/reduced lunch — lower-income household profile, screen leases tightly.
- Market conditions: Rents flat; 186 active listings in the ZIP; solid renter incomes; 1,742 units permitted in Alameda County in 2024 (856 in 5+ unit buildings).
- At $11,660/mo this rent would consume 132% of the median local household income ($106k/yr) (locally 2086% of renters already pay >50% of income on rent) — very limited rent-growth headroom before tenants either downsize or default.
Forward outlook
- Local home prices are declining (-3.0%/yr); year-one equity from $6k of loan paydown is wiped out by about $27k of value loss. Plan a longer hold.
- Alameda County population projected at +34% by 2050 — long-run rental-demand tailwind backs the buy-and-hold thesis.
Negotiation context
- It's been on market 198 days — a 12% lower offer ($788k) is reasonable based on typical stale-listing flexibility.
- 5 sale attempts since 29y ago with the ask held roughly flat each time — persistent listings suggest the price (not the market) is what's stuck; bring a comps-based counter.
- Current owner paid $155k; list at $895k implies a 476% gain — meaningful room to come down on a strong offer.
Risks & watch-outs
- Watch-outs: built in 1938 — expect roof / HVAC / electrical / plumbing capex.
Questions for the listing agent
- It's been on market 198 days. Have you received any prior offers? Is the seller open to a 12% concession, seller financing, or rate buy-down credit?
- Can we see the unit-by-unit rent roll, current vacancy, and any below-market leases? What's the average tenancy length?
- What capital expenditures (roof, boiler, parking lot, exteriors) have been made in the last 5 years, and what's planned in the next 2?
- Built in 1938 — when were the roof, HVAC, electrical panel, plumbing, and water heater last replaced?
- Why hasn't it sold? Are there any deal-killer items the seller is aware of (foundation, flood, title, zoning, code violations)?
- Is there a deadline driving the sale (1031 exchange, divorce, estate, relocation)? That informs how much negotiation room exists.
- Crime grade is F in this area — have there been break-ins, vandalism, or insurance claims at this property in the last 3 years? What carrier currently insures it and at what premium?
- What's the average days-on-market for RENTAL listings here right now (not sales)? A rising rental-DOM trend means longer vacancies and softer asking-rent achievability than the comps imply.
- What's the recent tenant-quality profile in this submarket — average credit score on applications, eviction rate, late-payment / NSF rate, and stable-employment percentage? A property-management company in the area should have these aggregated.
- How much new apartment / multifamily construction is in the pipeline within 1–3 miles? Heavy new supply (>2% of stock underway) typically softens rents 12–24 months out; light construction supports rent growth.
Investment metrics
- 1% rule
- 1.30% ✓
- Cap rate
- 10.35%
- Cash-on-cash
- 14.49%
- DSCR
- 1.64
- GRM
- 6.4
CMA / ARV
- ARV (median comp)
- $985,055
- List price
- $895,000
- Delta
- -9.14%
- Verdict
- FAIR
- Comps
- 20 within 1.0 mi
Show comp detail 3 sales within ~0.75 mi
| Address | Dist | Beds/Ba | Sqft | Sold | Price | $/sf | Match |
|---|---|---|---|---|---|---|---|
| 2023 80th Ave | 0.45mi | —/— | 4,140 (-2%) | 7mo | $1,150,000 | $278 | 69 |
| 2020 81st Ave | 0.46mi | 8/5.0 | 3,868 (-8%) | 15mo | $1,130,000 | $292 | 52 |
| 8900 Macarthur Blvd | 0.58mi | —/3.0 | 3,810 (-10%) | 20mo | $670,000 | $176 | 40 |
Match score weights: distance 35% · size 25% · config 20% · recency 20%. Top-matched comps best support the ARV.
Projected returns pro-forma
-3.0% appreciation · 0.65% rent growth · sell at horizon
- IRR
- 2.2%
- Equity multiple
- 1.08×
- Total profit
- $20,952
- Equity at exit
- $133,447
- IRR
- 9.4%
- Equity multiple
- 1.65×
- Total profit
- $161,693
- Equity at exit
- $77,383
Cash invested: $250,600 (down + closing). Projections, not guarantees.
Landlord ↔ Tenant lean methodology
- Overall (CITY)
- 0 Strongly Tenant-Friendly
- State California
- 18 Strongly Tenant-Friendly · D+13
- County
- — inherits STATE
- City Oakland
- 0 Strongly Tenant-Friendly · D+62
ZIP-level market 94605
- Rents YoY
- 0.7%
- Active inventory
- 186
- Price-to-rent
- 38.4×
Monthly cashflow live
- Estimated rent
- $11,660 high interval (Pro) →
- Mortgage (P&I)
- −$4,693
- Tax est. 1.5%
- −$1,119 /mo · $13,425/yr
- Insurance
- −$373
- HOA
- −$0
- Vacancy / Maint / Mgmt
- −$2,449
- Net cashflow
- $3,026
Break-even live
6-unit breakdown (identical units grouped — click to expand)
| Units | Beds | Baths | Est. rent |
|---|---|---|---|
| 6× units | 2 | — | $11,658 |
| #1 | 2 | — | $1,943 |
| #2 | 2 | — | $1,943 |
| #3 | 2 | — | $1,943 |
| #4 | 2 | — | $1,943 |
| #5 | 2 | — | $1,943 |
| #6 | 2 | — | $1,943 |
| Total (6 units) | $11,660 | ||
UW: 25.0% down · 7.5% · 30yr · 1.5% tax · 5.0% vac · 8.0% maint · 8.0% mgmt
Financing live
Cash to close
- Down payment
- $223,750
- Closing costs
- $26,850
- Reserves months
- —
- Total cash needed
- —
Loan-product check · same deal, 3 products live
Conventional
25% down · 7.5% · 30yr
- Down + closing
- —
- Monthly P&I
- —
- Monthly cashflow
- —
- DSCR
- —
- Eligible?
- —
Personal DTI + credit; lowest rate.
DSCR
20% down · 8.5% · 30yr
- Down + closing
- —
- Monthly P&I
- —
- Monthly cashflow
- —
- DSCR
- —
- Eligible?
- —
No personal income docs; deal must DSCR.
Hard money
10% down · 12.0% · 12mo
- Down + closing
- —
- Monthly P&I
- —
- Monthly cashflow
- —
- DSCR
- —
- Eligible?
- —
Short-term bridge; refi at stabilization.
Listing history 24 events
-
2026-06-18days on market $895,000 Active 198 DOM
-
2026-06-17days on market $895,000 Active 197 DOM
-
2026-06-16days on market $895,000 Active 196 DOM
-
2026-06-15days on market $895,000 Active 195 DOM
-
2026-06-13days on market $895,000 Active 193 DOM
-
2026-06-13days on market $895,000 Active 192 DOM
-
2026-06-09days on market $895,000 Active 189 DOM
-
2026-06-08days on market $895,000 Active 188 DOM
-
2026-06-07days on market $895,000 Active 187 DOM
-
2026-06-04days on market $895,000 Active 184 DOM
-
2026-06-03days on market $895,000 Active 183 DOM
-
2026-06-02days on market $895,000 Active 182 DOM
-
2026-06-01days on market $895,000 Active 181 DOM
-
2026-05-31days on market $895,000 Active 180 DOM
-
2025-12-02$895,000 Active 1120-char remark
Show marketing remark (1120 chars)
6-unit mixed-use building with excellent current income with a current cap rate of 12.49% and a current GRM of 5.70! The property offers two retail units in the front building and four residential units in the rear building. The property was built in 1938, offers 4,225 square feet of rental space, and sits on an oversized 9,998 square foot lot with a huge backyard and ample parking. The front retail units have two tenants but can be delivered vacant at closing. The rear building offers one 4bd/2bth unit, one 3bd/1bth unit, and two 2bd/1bth units. The backyard is huge and offers the potential for expansion or ADU development. The units are large and offer a variety of upgrades including newer kitchens and bathrooms, double pane windows, a newer roof, newer flooring, and more. The property is easy to manage and is separately metered for PG&E providing for low annual operating expenses. The tenants are nice, cooperative, and easy to manage making this an ideal property for an investor seeking max income or an owner-occupant seeking a variety of options with unbeatable cash flow to offset the mortgage.
-
2019-01-18historical
-
2019-01-16historical
-
2018-09-01historical
-
2018-08-16$875,000
-
2018-08-16New
-
2013-03-12$325,000
-
1997-12-20soldstatus $155,300
-
1997-11-01historical
-
1997-07-17$165,000
ⓘ Source: listings_history table (triggers on properties + properties_extension) + one-shot
backfill from property_details.listing_events for pre-trigger history.
Nearby sold comps map
Loading sold comps map…
Walkable amenities ~0.75 mi
Loading nearby amenities…
Taxation est. · year 1
- Rental income
- $139,920
- − Mortgage interest
- −$50,134
- − Property taxes
- −$13,425
- − Insurance
- −$4,475
- − Repairs & maintenance
- −$11,194
- − Management
- −$11,194
- − Depreciation
- −$26,036
- Taxable income
- $23,463
- Est. tax owed @ 24.0%
- −$5,631
- After-tax cash flow
- $30,684/yr
For passive investors: Depreciation is non-cash, so a rental often shows a tax loss while cash-flowing — sheltering income. Rental losses are passive: they offset passive income freely, and up to $25,000/yr can offset ordinary (W-2) income if you actively participate and your MAGI is under $100k (phasing out to $0 by $150k); unused losses carry forward. On sale, claimed depreciation is recaptured at up to 25%, and gains may owe capital-gains tax (a 1031 exchange can defer both). Figures are a year-1 estimate at your 24.0% rate — not tax advice; consult a CPA.
Schools (NCES district)
- District
- Oakland Unified
- NCES district ID
- 0628050
- Math proficiency
- 27% ▬ 0.00%
- Reading proficiency
- 33% ▬ 0.00%
- Median HH income
- $55,194
- Composite
- 29.52/100
- National rank
- #11769
- State rank
- #1007 of 1400 in CA
Livability — Oakland
- Score
- 71/100
- State rank
- #224
- US rank
- #7245
Category grades
Schools grade is shown separately in the Schools card above.
Census & demographics
- Census place
- Oakland, CA
- County
- Alameda County · 1,614,355 people
- City population
- 385,993
- Metro
- San Francisco-Oakland-Berkeley, CA
- Population (ZIP)
- 44,103
- Household income
- $106,068
- Rent vs Own
- Severe rent burden
- 2086.0
Population outlook (Alameda County) Hauer SSP2
- Today (2025)
- 1,928,884 people
- By 2030
- 2,069,146 · +7.3%
- By 2040
- 2,338,405 · +21.2%
- By 2050
- 2,586,608 · +34.1%
- By 2075
- 3,061,911 · +58.7%
- By 2100
- 3,234,133 · +67.7%
Race, ethnicity, and origin ACS 2023
- Neighborhood character
- Highly diverse neighborhood (Simpson 0.73)
- Race & ethnicity
- Black 40% Hispanic / Latino 27% White 17% Two or more races 11% Asian 9%
- Hispanic origin (detail)
- Mexican 18% Puerto Rican 1%
- Common ancestry
- Italian 2% Lithuanian 1% Romanian 1%
- Foreign-born
- 20% · Canada, China, Vietnam
- Languages at home
- 70% English-only · Spanish 21% Chinese 2% Other Asian/Pacific 2%
Political lean MEDSL · Alameda
- 2024 margin
- Solid D (+53.6) · D 74.6% · R 21.0% · Other 4.4%
- 2008→2024 swing
- -5.9pp toward R · 2008: 59.5pp · 2024: 53.6pp
- All cycles
- 2024: D+53.6 2020: D+62.5 2016: D+64.4 2012: D+59.8 2008: D+59.5
Not yet ingested
- Civics
- —
Market trends
- HPI YoY
- ▼ -793.09%
- Current HPI
- 294.5467
- Rent YoY
- ▲ 0.65%
- Metro
- San Francisco-Oakland-Berkeley, CA
- State GDP YoY
- ▲ 3.21%
- F500 in state
- 116
Industry mix (Fortune 500 HQ in CA)
| Industry | F500 HQs | Revenue |
|---|---|---|
| Technology | 27 | $1,492B |
|
||
| Financial Services | 3 | $174B |
|
||
| Retail | 3 | $44B |
|
||
| Insurance | 3 | $26B |
|
||
| Media / Entertainment | 2 | $115B |
|
||
| Pharmaceuticals / Biotech | 2 | $62B |
|
||
Price history
+442.4% since first listed10 events — show timeline
- 2025-12-02 Listed $895,000 bridgeMLS, Bay East AOR, or Contra Costa AOR
- 2019-01-18 Listing Removed — SDMLS
- 2019-01-16 Listing Removed — SDMLS
- 2018-09-01 Listing Removed — bridgeMLS, Bay East AOR, or Contra Costa AOR
- 2018-08-16 Listed — bridgeMLS, Bay East AOR, or Contra Costa AOR
- 2018-08-16 Listed $875,000 SDMLS
- 2013-03-12 Listed $325,000 SDMLS
- 1997-12-20 Sold (MLS) $155,300 bridgeMLS, Bay East AOR, or Contra Costa AOR
- 1997-11-01 Listing Removed — bridgeMLS, Bay East AOR, or Contra Costa AOR
- 1997-07-17 Listed $165,000 bridgeMLS, Bay East AOR, or Contra Costa AOR
Cash-flow waterfall
monthlySold comps — $/sqft
last 12 mo · ≤1 miLoading sold comps…