2161 Peachtree Rd NE #205 · Atlanta, GA
Flood risk 1/10 · Minimal
- FEMA flood zone
- X (unshaded)
- Chance of flooding over 30 yrs
- 0.0%
- Est. flood insurance / yr
- $507 – $1,088
Fire risk 1/10 · Minimal
- Est. fire insurance / yr
- $963 – $1,789
Heat risk 6/10 · Moderate
- Hot days now (above 104°F)
- 7 days/yr
- Hot days in 30 yrs
- 19 days/yr
Wind risk 4/10 · Minor
- Chance of severe wind over 30 yrs
- 21.0%
Air-quality risk 4/10 · Minor
- Unhealthy air days now
- 5 days/yr
- Unhealthy air days in 30 yrs
- 7 days/yr
Risk factors via First Street. Map © Google.
Why this score? — see what drove the D grade
The composite is a weighted blend of 9 inputs, each scored 0–100. Each bar is that input's sub-score; the figure is the points it added to the 100-point composite (weight × sub-score).
- ARV discount +13.2/15.0
- Cash flow +7.5/30.0
- 1% rule +6.0/10.0
- Livability +4.2/5.0
- Rent growth +3.3/5.0
- Schools +2.7/10.0
- Condition / age +2.5/5.0
- DSCR +1.7/10.0
- Appreciation +0.0/10.0
$229,000
🖨 Deal sheet (PDF) 📄 Offer letter ✓ Due diligence
Listing remarks MLS
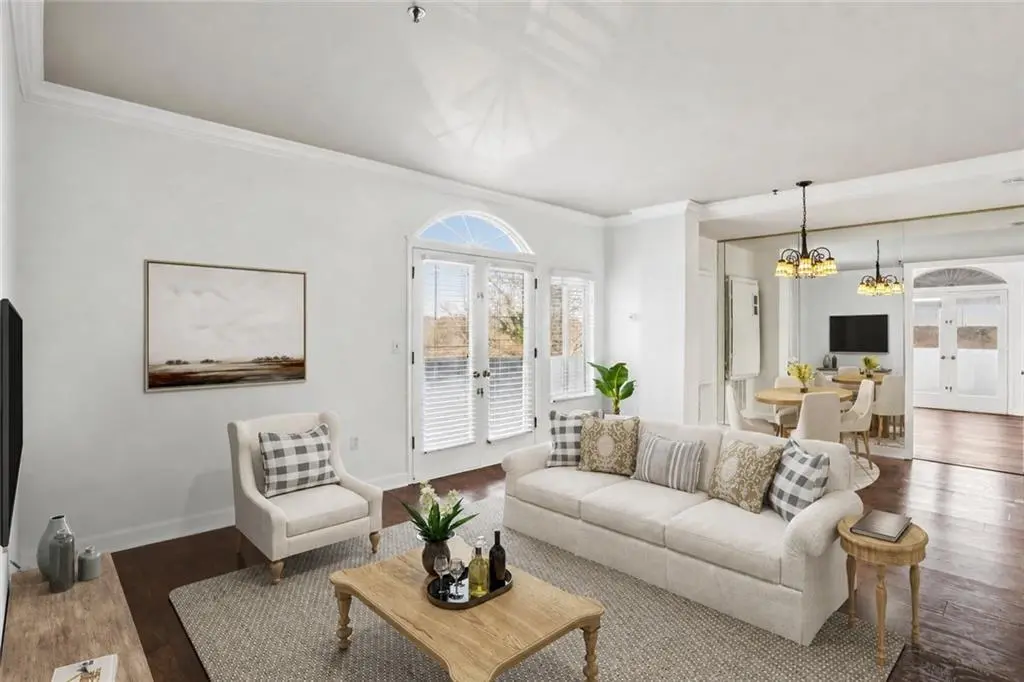
Get into this prestigious mid-rise at rock bottom pricing. Terrific location, walk to restaurants & shops. Where Buckhead meets Midtown. Sold 'as is'. Make offer.
Key facts
- $650 HOA
- Garage
- Built 1986
Property features AI
Finance
- HOA & community: Monthly association fee of $650; Association covers grounds and structure maintenance, pest control, and water; 72 units in the community; Community amenities include homeowners association, proximity to public transport, schools, shopping and trails/greenway
Exterior
- Parking: Assigned covered deeded garage parking; One garage space
- Utilities: Public water; Public sewer; Electric service available; Cable available; Phone available; Water service included in association
- Home design: One level; Condominium; Accessible entrance
- Construction: Stucco construction; Other roof
- Exterior features: Balcony; Patio; Stucco exterior; Resale condominium; City street frontage; Asphalt / paved roads
Interior
- Kitchen: Breakfast bar; White cabinets; Solid surface counters; Kitchen open to family room; Dishwasher; Disposal; Electric cooktop
- Bedrooms: Two main-level bedrooms; Roommate floor plan; Accessible bedroom and closets
- Flooring: Ceramic tile; Hardwood
- Bathrooms: Two full bathrooms; Master bathroom with soaking tub and tub/shower combo
- Heating & cooling: Central heating (forced air); Central air; Ceiling fans
- Interior features: Crown molding; Entrance foyer; Walk-in closets; Window treatments; 2+ common walls
- Laundry & utility: Washer and dryer included; Laundry located in kitchen / laundry closet
Neighborhood map
What this means for you Summary
Snapshot
- This is a 2-bed/2.0-bath condo listed at $229k.
Deal economics
- At list price, monthly cash flow is $-280 ($-3k/yr) — negative.
- To cash-flow at today's rent, offer at most $179k (21.6% below list).
- Meets the 1% rule at list price ($3k rent vs $229k).
- Recommended offer: $179k (21.6% below list) — sets the bar for cash-flow.
- Cap rate 4.8% vs local median 3.1% in Atlanta — top-decile yield for the area; either an underpriced asset or a hidden risk that comps aren't pricing in. Stress-test before assuming the spread holds.
Location & tenants
- Location reads 83/100 on livability (#6 in GA, #919 nationally) — a professional / high-income tenant draw. Strengths: amenities A+, commute A+, housing A+; Watch: cost of living C-.
- Atlanta Public Schools (urban): math 28% / reading 35% proficiency, ranked #80 of 174 in GA (top 46%) — families likely to look elsewhere, expect single-tenant / working-renter base with shorter leases; 71% free/reduced lunch — lower-income household profile, screen leases tightly.
- Zoned schools: E. Rivers Elementary School (math 33% / reading 52%, grade F, #374 of 1,228 statewide, top 31%, 708 students, 32% FRL); Willis A. Sutton Middle School (math 36% / reading 55%, grade D+, #97 of 470 statewide, top 22%, 1,548 students, 34% FRL); North Atlanta High School (math 27% / reading 17%, grade F, #213 of 424 statewide, top 51%, 2,316 students, 24% FRL) — zoned schools average 30% FRL vs 71% district-wide (41 pts lower); this property's tenant base skews higher-income than the district average.
- Market conditions: Rents rising (+3.1%/yr); 414 active listings in the ZIP; 40 comparable units currently listed for rent nearby; rentals leasing fast (median 10d on market — plan ~1-2 weeks tenant-placement turnaround); high-income renter base; 11,565 units permitted in Fulton County in 2024 (8,159 in 5+ unit buildings).
Forward outlook
- Local home prices are declining (-3.0%/yr); year-one equity from $2k of loan paydown is wiped out by about $7k of value loss. Plan a longer hold.
- Fulton County population projected at +38% by 2050 — long-run rental-demand tailwind backs the buy-and-hold thesis.
Negotiation context
- It's been on market 45 days — a 3% lower offer ($222k) is reasonable based on typical stale-listing flexibility.
- 4 sale attempts since 19y ago; this cycle's ask is 11644% above the opening price — seller raised mid-cycle; expect resistance to lowballs.
- Current owner paid $138k; list at $229k implies a 65% gain — meaningful room to come down on a strong offer.
Risks & watch-outs
- Watch-outs: HOA is 26% of rent.
- Climate carrying-cost: extreme-heat days projected 7→19/yr by 2055 (HVAC capex compounding) — expect insurance premiums to compound above CPI over the hold.
Questions for the listing agent
- What do current leases actually rent for vs. the listed asking? Can we see a recent rent roll and the last 12 months of T-12 income?
- It's been on market 45 days. Have you received any prior offers? Is the seller open to a 22% concession, seller financing, or rate buy-down credit?
- What does the HOA fee cover, when was the last increase, and are there any pending special assessments or reserve-fund shortfalls?
- Any open or pending special assessments — roof, HVAC, plumbing, elevator, façade? What's the per-unit balance and payoff schedule, and is the seller paying it off at close or rolling it to the buyer?
- Is there a deadline driving the sale (1031 exchange, divorce, estate, relocation)? That informs how much negotiation room exists.
- The area grade is low — what's the realistic commute time and amenity access for the typical tenant pool here? Any planned neighborhood developments (good or bad) we should know about?
- What's the average days-on-market for RENTAL listings here right now (not sales)? A rising rental-DOM trend means longer vacancies and softer asking-rent achievability than the comps imply.
- What's the recent tenant-quality profile in this submarket — average credit score on applications, eviction rate, late-payment / NSF rate, and stable-employment percentage? A property-management company in the area should have these aggregated.
- How much new apartment / multifamily construction is in the pipeline within 1–3 miles? Heavy new supply (>2% of stock underway) typically softens rents 12–24 months out; light construction supports rent growth.
Investment metrics
- 1% rule
- 1.10% ✓
- Cap rate
- 4.82%
- Cash-on-cash
- -5.25%
- DSCR
- 0.77
- GRM
- 7.6
CMA / ARV
- ARV (median comp)
- $262,107
- List price
- $229,000
- Delta
- -12.63%
- Verdict
- UNDERPRICED
- Comps
- 20 within 1.0 mi
Projected returns pro-forma
-3.0% appreciation · 3.09% rent growth · sell at horizon
- IRR
- -24.8%
- Equity multiple
- 0.15×
- Total profit
- $-54,278
- Equity at exit
- $34,145
- IRR
- -19.4%
- Equity multiple
- -0.05×
- Total profit
- $-67,448
- Equity at exit
- $19,800
Cash invested: $64,120 (down + closing). Projections, not guarantees.
Landlord ↔ Tenant lean methodology
- Overall (STATE)
- 90 Strongly Landlord-Friendly
- State Georgia
- 90 Strongly Landlord-Friendly · R+3
- County
- — inherits STATE
- City
- — inherits STATE
ZIP-level market 30309
- Rents YoY
- 3.1%
- Active inventory
- 414
- Price-to-rent
- 7.6×
Monthly cashflow live
- Estimated rent
- $2,521 high interval (Pro) →
- Mortgage (P&I)
- −$1,201
- Tax from tax record
- −$325 /mo · $3,904/yr
- Insurance
- −$95
- HOA
- −$650
- Vacancy / Maint / Mgmt
- −$529
- Net cashflow
- $-280
Break-even live
Sensitivity live
| Price | -10% $-151 | -5% $-216 | +0% $-280 | +5% $-345 | +10% $-410 |
|---|---|---|---|---|---|
| Rent | -10% $-480 | -5% $-380 | +0% $-280 | +5% $-181 | +10% $-81 |
| Rate | -1.0pp $-165 | -0.5pp $-222 | base $-280 | +0.5pp $-340 | +1.0pp $-400 |
UW: 25.0% down · 7.5% · 30yr · 1.5% tax · 5.0% vac · 8.0% maint · 8.0% mgmt
Financing live
Cash to close
- Down payment
- $57,250
- Closing costs
- $6,870
- Reserves months
- —
- Total cash needed
- —
Loan-product check · same deal, 3 products live
Conventional
25% down · 7.5% · 30yr
- Down + closing
- —
- Monthly P&I
- —
- Monthly cashflow
- —
- DSCR
- —
- Eligible?
- —
Personal DTI + credit; lowest rate.
DSCR
20% down · 8.5% · 30yr
- Down + closing
- —
- Monthly P&I
- —
- Monthly cashflow
- —
- DSCR
- —
- Eligible?
- —
No personal income docs; deal must DSCR.
Hard money
10% down · 12.0% · 12mo
- Down + closing
- —
- Monthly P&I
- —
- Monthly cashflow
- —
- DSCR
- —
- Eligible?
- —
Short-term bridge; refi at stabilization.
Rent comps 40 comps
| Address | Beds | Baths | Sqft | Rent | $/sqft | DOM | Units | Dist |
|---|---|---|---|---|---|---|---|---|
| 2171 Peachtree Rd NE Atlanta, GA | 1.0–3.0 | 1.0–3.0 | 1727 | $4,254 | $2.46 | 0d | 6 | 0.05mi |
| 2171 Peachtree Rd NW Unit 1B1BA Atlanta, GA | 1.0 | 1.0 | 1306 | $2,772 | $2.12 | 26d | 1 | 0.05mi |
| 2171 Peachtree Rd NW Unit 2B2BA Atlanta, GA | 2.0 | 2.0 | 1509 | $2,708 | $1.79 | 26d | 1 | 0.05mi |
| 100 Colonial Homes Dr NW Atlanta, GA | 1.0–3.0 | 1.0–2.0 | 1188 | $2,184 | $1.84 | 0d | 25 | 0.08mi |
| 200 Colonial Homes Dr NW Atlanta, GA | 1.0–2.0 | 1.0–2.0 | 980 | $2,345 | $2.39 | 3d | 9 | 0.15mi |
| 40 Peachtree Valley Rd NE Atlanta, GA | 3.0 | 1.0–2.0 | 1103 | $2,021 | $1.83 | 0d | 48 | 0.18mi |
| 1000 Peachtree Park Dr NE Atlanta, GA | 1.0–2.0 | 1.0–2.0 | 990 | $1,949 | $1.97 | 0d | 18 | 0.18mi |
| 2277 Peachtree Rd Atlanta, GA | 1.0 | 1.0 | 1144 | $1,100 | $0.96 | 26d | 1 | 0.22mi |
| 222 Colonial Homes Dr NW Atlanta, GA | 1.0–3.0 | 1.0–2.0 | 968 | $2,880 | $2.97 | 0d | 14 | 0.24mi |
| 2035 Peachtree Rd NW Atlanta, GA | 2.0 | 2.0 | 988 | $2,037 | $2.06 | 17d | 1 | 0.24mi |
| 115 Biscayne Dr NW Unit B1 Atlanta, GA | 3.0 | 2.0 | 1300 | $1,899 | $1.46 | 26d | 1 | 0.25mi |
| 2035 Peachtree Rd NE Atlanta, GA | 1.0–2.0 | 1.0–2.0 | 771 | $1,556 | $2.02 | 0d | 18 | 0.26mi |
| 120 Biscayne Dr NW Unit B10 Atlanta, GA | 2.0 | 1.5 | 1036 | $1,795 | $1.73 | 20d | 1 | 0.26mi |
| 1899 Anjaco Rd NW #1 Atlanta, GA | 2.0 | 2.0 | 1800 | $4,000 | $2.22 | 15d | 1 | 0.47mi |
| 1820 Peachtree St NW #1003 Atlanta, GA | 2.0 | 2.5 | 1381 | $4,000 | $2.90 | 18d | 1 | 0.55mi |
| 2420 Peachtree Rd NW Atlanta, GA | 1.0–2.0 | 1.0–2.0 | 957 | $2,911 | $3.04 | 22d | 5 | 0.57mi |
| 2425 Peachtree Rd NE #503 Atlanta, GA | 2.0 | 2.5 | 1470 | $8,500 | $5.78 | 23d | 1 | 0.60mi |
| 1777 Peachtree St NE Atlanta, GA | 2.0 | 1.0–2.0 | 886 | $3,079 | $3.47 | 9d | 6 | 0.66mi |
| 1777 Peachtree Rd NE Unit 1009 Atlanta, GA | 3.0 | 2.0 | 1395 | $3,399 | $2.44 | 16d | 1 | 0.66mi |
| 2467 Peachtree Rd Unit 1 Atlanta, GA | 2.0 | 2.0 | 1050 | $1,950 | $1.86 | 26d | 1 | 0.69mi |
| 2467 Peachtree Rd NE Atlanta, GA | 2.0 | 2.0 | 1050 | $2,375 | $2.26 | 26d | 1 | 0.69mi |
| 147 26th St NW Atlanta, GA | 2.0 | 1.0–2.0 | 956 | $1,949 | $2.04 | 0d | 24 | 0.75mi |
| 267 Goodson Way NW Atlanta, GA | 2.0 | 2.5 | 1350 | $2,750 | $2.04 | 7d | 1 | 0.82mi |
| 130 26th St NW #706 Atlanta, GA | 2.0 | 1.0 | 1150 | $2,800 | $2.43 | 26d | 1 | 0.86mi |
| 311 Peachtree Hills Ave NE Atlanta, GA | 2.0 | 1.0 | 1060 | $2,600 | $2.45 | 26d | 1 | 0.88mi |
| 225 26th St NW Atlanta, GA | 1.0–3.0 | 1.0–2.0 | 1240 | $2,114 | $1.71 | 0d | 9 | 0.90mi |
| 2575 Peachtree Rd NE Unit 7G Atlanta, GA | 2.0 | 2.0 | 1600 | $9,000 | $5.62 | 3d | 1 | 0.92mi |
| The Peach Atlanta, GA | 1.0–3.0 | 1.0–3.5 | 1175 | $2,510 | $2.14 | 5d | 38 | 0.97mi |
| — Atlanta, GA | 2.0 | 2.0 | 1732 | $5,800 | $3.35 | 14d | 1 | 0.97mi |
| 245 Lindbergh Dr NE Atlanta, GA | 3.0 | 2.0 | 1292 | $4,095 | $3.17 | 26d | 1 | 0.99mi |
| 1660 Peachtree St NW Atlanta, GA | 1.0–2.0 | 1.0–2.0 | 1022 | $2,095 | $2.05 | 0d | 17 | 1.02mi |
| 1925 Monroe Dr NE Atlanta, GA | 1.0–3.0 | 1.0–2.0 | 1101 | $2,418 | $2.20 | 0d | 48 | 1.05mi |
| 370 Peachtree Hills Ave NE Atlanta, GA | 2.0 | 1.0 | 950 | $1,322 | $1.39 | 5d | 4 | 1.07mi |
| 350 Peachtree Hills Ave NE Atlanta, GA | 1.0–2.0 | 1.0–2.0 | 950 | $1,935 | $2.04 | 0d | 27 | 1.08mi |
| 81 E Wesley Rd NE Unit 02 Atlanta, GA | 2.0 | 1.0 | 900 | $1,399 | $1.55 | 9d | 1 | 1.14mi |
| 1760 Northside Dr NW Atlanta, GA | 1.0–2.0 | 1.0–2.0 | 701 | $1,749 | $2.49 | 0d | 8 | 1.17mi |
| 300 Deering Rd NW Atlanta, GA | 1.0–2.0 | 1.0–2.0 | 825 | $1,347 | $1.63 | 0d | 8 | 1.22mi |
| 500 Northside Cir NW Atlanta, GA | 1.0–2.0 | 1.0–2.0 | 962 | $1,850 | $1.92 | 0d | 18 | 1.25mi |
| 2000 Monroe Pl NE Atlanta, GA | 2.0 | 2.0 | 1110 | $1,729 | $1.56 | 23d | 1 | 1.27mi |
| 2000 Monroe Pl NE Atlanta, GA | 1.0–2.0 | 1.0–2.0 | 995 | $2,289 | $2.30 | 6d | 10 | 1.27mi |
HOA detail condo
- Monthly dues
- $650 · $7,800/yr
- Assessments
- None detected in remarks — confirm with the listing agent.
Listing history 23 events
-
2026-06-21days on market $229,000 Active 45 DOM
-
2026-06-18days on market $229,000 Active 42 DOM
-
2026-06-17days on market $229,000 Active 41 DOM
-
2026-06-16days on market $229,000 Active 40 DOM
-
2026-06-15days on market $229,000 Active 39 DOM
-
2026-06-13days on market $229,000 Active 37 DOM
-
2026-06-13days on market $229,000 Active 36 DOM
-
2026-06-09days on market $229,000 Active 33 DOM
-
2026-06-08days on market $229,000 Active 32 DOM
-
2026-06-07days on market $229,000 Active 31 DOM
-
2026-06-04days on market $229,000 Active 28 DOM
-
2026-06-03days on market $229,000 Active 27 DOM
-
2026-06-02days on market $229,000 Active 26 DOM
-
2026-06-01days on market $229,000 Active 25 DOM
-
2026-05-31days on market $229,000 Active 24 DOM
-
2026-05-07$229,000 Active 1668-char remark
-
2026-05-05historical $229,000 1668-char remark
-
2026-04-27historical
-
2026-01-29$230,000 Active
-
2008-03-13soldstatus $138,500
-
2008-02-28soldstatus $138,500
Show marketing remark (166 chars)
Get into this prestigious mid-rise at rock bottom pricing. Terrific location, walk to restaurants & shops. Where Buckhead meets Midtown. Sold 'as is'. Make offer.
-
2007-12-21$158,000
Show marketing remark (166 chars)
Get into this prestigious mid-rise at rock bottom pricing. Terrific location, walk to restaurants & shops. Where Buckhead meets Midtown. Sold 'as is'. Make offer.
-
1989-05-12soldstatus $115,000
ⓘ Source: listings_history table (triggers on properties + properties_extension) + one-shot
backfill from property_details.listing_events for pre-trigger history.
Tax reassessment forecast GA · Resets to sale price
- Current annual tax
- $3,904 · $325/mo
- Projected year-2 tax
- $3,904 · $325/mo
- Expected delta
- $0/yr ($0/mo · 0.0%)
ⓘ Screening estimate from a state-policy table — verify with the county assessor before closing.
Climate risk First Street
- Flood 1/10 Low FEMA zone X (unshaded) · 0% chance over 30 yrs
- Wildfire 1/10 Low
- Heat 6/10 Major 7 d/yr ≥104°F today · 19 d/yr by 30 yrs out
- Wind 4/10 Moderate 21% chance of damaging wind over 30 yrs
- Air quality 4/10 Moderate 5 unhealthy d/yr today · 7 by 30 yrs out
Nearby sold comps map
Loading sold comps map…
Walkable amenities ~0.75 mi
Loading nearby amenities…
Taxation est. · year 1
- Rental income
- $30,247
- − Mortgage interest
- −$12,828
- − Property taxes
- −$3,904
- − Insurance
- −$1,145
- − Repairs & maintenance
- −$2,420
- − Management
- −$2,420
- − HOA
- −$7,800
- − Depreciation
- −$6,662
- Taxable loss
- −$6,931
- Est. tax savings @ 24.0%
- +$1,664
- After-tax cash flow
- $-1,702/yr
For passive investors: Depreciation is non-cash, so a rental often shows a tax loss while cash-flowing — sheltering income. Rental losses are passive: they offset passive income freely, and up to $25,000/yr can offset ordinary (W-2) income if you actively participate and your MAGI is under $100k (phasing out to $0 by $150k); unused losses carry forward. On sale, claimed depreciation is recaptured at up to 25%, and gains may owe capital-gains tax (a 1031 exchange can defer both). Figures are a year-1 estimate at your 24.0% rate — not tax advice; consult a CPA.
Schools (NCES district)
- District
- Atlanta Public Schools
- NCES district ID
- 1300120
- Math proficiency
- 28% ▼ -6.00%
- Reading proficiency
- 35% ▼ -2.00%
- Median HH income
- $48,306
- Composite
- 27.27/100
- National rank
- #7006
- State rank
- #80 of 174 in GA
Livability — Atlanta
- Score
- 83/100
- State rank
- #6
- US rank
- #919
Category grades
Schools grade is shown separately in the Schools card above.
Census & demographics
- Census place
- Atlanta, GA
- County
- Fulton County · 1,094,430 people
- City population
- 629,525
- Metro
- Atlanta-Sandy Springs-Alpharetta, GA
- Population (ZIP)
- 32,479
- Household income
- $114,072
- Rent vs Own
- Severe rent burden
- 2135.0
Population outlook (Fulton County) Hauer SSP2
- Today (2025)
- 1,203,707 people
- By 2030
- 1,299,706 · +8.0%
- By 2040
- 1,488,256 · +23.6%
- By 2050
- 1,664,580 · +38.3%
- By 2075
- 2,036,072 · +69.2%
- By 2100
- 2,222,402 · +84.6%
Race, ethnicity, and origin ACS 2023
- Neighborhood character
- Diverse neighborhood (Simpson 0.57)
- Race & ethnicity
- White 62% Black 14% Asian 9% Hispanic / Latino 8% Two or more races 8%
- Hispanic origin (detail)
- Mexican 2% Puerto Rican 2%
- Common ancestry
- Slovak 3% Romanian 2% Lithuanian 2%
- Foreign-born
- 15% · Canada, China, South Korea
- Languages at home
- 83% English-only · Spanish 5% Other Indo-European 4% Chinese 3%
Political lean MEDSL · Fulton
- 2024 margin
- Solid D (+44.9) · D 71.9% · R 27.0% · Other 1.1%
- 2008→2024 swing
- +9.8pp toward D · 2008: 35.0pp · 2024: 44.9pp
- All cycles
- 2024: D+44.9 2020: D+46.4 2016: D+42.1 2012: D+29.6 2008: D+35.0
Not yet ingested
- Civics
- —
Market trends
- HPI YoY
- ▼ -561.75%
- Current HPI
- 156.3796
- Rent YoY
- ▲ 3.09%
- Metro
- Atlanta-Sandy Springs-Alpharetta, GA
- State GDP YoY
- ▲ 2.66%
- F500 in state
- 28
Industry mix (Fortune 500 HQ in GA)
| Industry | F500 HQs | Revenue |
|---|---|---|
| Paper / Packaging | 2 | $29B |
|
||
| Retail | 1 | $160B |
|
||
| Transportation / Logistics | 1 | $91B |
|
||
| Airlines | 1 | $62B |
|
||
| Consumer Goods | 1 | $47B |
|
||
| Utilities | 1 | $25B |
|
||
Price history
-98.3% since first listed9 events — show timeline
- 2026-06-07 Listed for Rent $1,950 FMLS
- 2026-05-07 Listed $229,000 FMLS
- 2026-05-05 Coming Soon $229,000 FMLS
- 2026-04-27 Listing Removed — FMLS
- 2026-01-29 Listed $230,000 FMLS
- 2008-03-13 Sold (Public Records) $138,500 Public Records
- 2008-02-28 Sold (MLS) $138,500 FMLS
- 2007-12-21 Listed $158,000 FMLS
- 1989-05-12 Sold (Public Records) $115,000 Public Records
Property tax history
+2.7%/yrLatest (2025): $3,904 · +1.5% YoY. Source: county tax records.
Cash-flow waterfall
monthlySold comps — $/sqft
last 12 mo · ≤1 miLoading sold comps…