4627 Flying Hooves · San Antonio, TX
Flood risk 1/10 · Minimal
- FEMA flood zone
- X (unshaded)
- Chance of flooding over 30 yrs
- 0.0%
- Est. flood insurance / yr
- $507 – $1,088
Fire risk 4/10 · Minor
- Est. fire insurance / yr
- $1,222 – $2,270
Heat risk 8/10 · Major
- Hot days now (above 110°F)
- 7 days/yr
- Hot days in 30 yrs
- 20 days/yr
Wind risk 8/10 · Major
- Chance of severe wind over 30 yrs
- 80.0%
Air-quality risk 2/10 · Minimal
- Unhealthy air days now
- 0 days/yr
- Unhealthy air days in 30 yrs
- 2 days/yr
Risk factors via First Street. Map © Google.
Why this score? — see what drove the D grade
The composite is a weighted blend of 9 inputs, each scored 0–100. Each bar is that input's sub-score; the figure is the points it added to the 100-point composite (weight × sub-score).
- ARV discount +14.2/15.0
- Cash flow +9.4/30.0
- Livability +4.0/5.0
- Condition / age +4.0/5.0
- Rent growth +3.6/5.0
- 1% rule +2.9/10.0
- DSCR +2.7/10.0
- Schools +1.9/10.0
- Appreciation +0.0/10.0
$189,990
🖨 Deal sheet (PDF) 📄 Offer letter ✓ Due diligence
Listing remarks
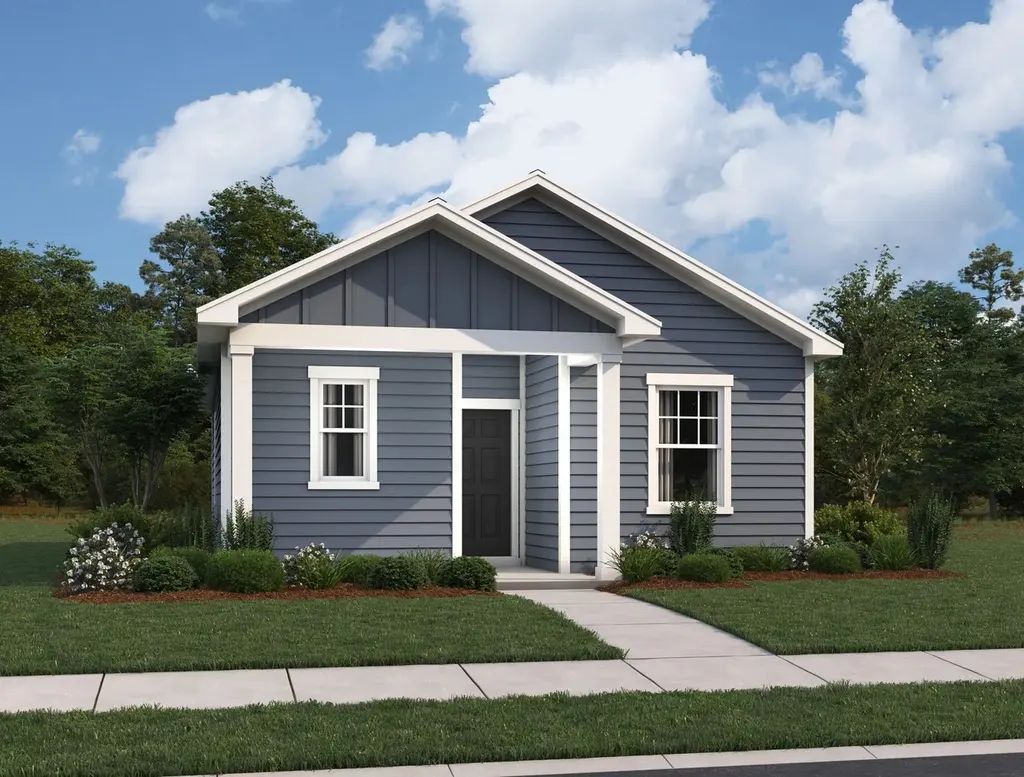
Step inside the Alps floor plan, where a welcoming front porch opens into a light-filled foyer and a spacious, open layout. Just beyond the entrance sits a secondary bedroom with easy access to a nearby full bath, making it ideal for guests or flexible use. The kitchen, complete with a convenient pantry, connects smoothly to the dining area and large family room, creating a comfortable space for meals, conversation, and everyday routines. A rear door off the family room leads directly outside, offering a simple spot to unwind or entertain. Tucked toward the back of the home, the primary suite delivers a quiet and private escape. This well-appointed space includes a roomy walk-in closet and
Key facts
- Secondary bedroom
- Large family room
- Dining area
Tags
Neighborhood map
What this means for you Summary
Snapshot
- This is a 2-bed/2.0-bath single-family listed at $190k. Condition is rated good.
Deal economics
- At list price, monthly cash flow is $-134 ($-2k/yr) — negative.
- To cash-flow at today's rent, offer at most $171k (10.2% below list).
- To meet the 1% rule (rent ≥ 1% of price), the offer needs to be $149k (21.5% below list).
- Recommended offer: $149k (21.5% below list) — sets the bar for 1% rule.
- Cap rate 5.4% vs local median 3.8% in San Antonio — top-decile yield for the area; either an underpriced asset or a hidden risk that comps aren't pricing in. Stress-test before assuming the spread holds.
Location & tenants
- Location reads 80/100 on livability (#31 in TX, #1,616 nationally) — a professional / high-income tenant draw. Strengths: amenities A+, commute A+, cost of living A+; Watch: crime F.
- East Central ISD (rural): math 16% / reading 25% proficiency, ranked #758 of 826 in TX (top 92%) — low school quality limits family demand, transient renter base, plan for 1-2y turnover; 61% free/reduced lunch — lower-income household profile, screen leases tightly.
- Zoned schools: Sinclair El (math 13% / reading 20%, grade F, #3,946 of 4,322 statewide, top 92%, 721 students, 71% FRL); Legacy Middle (math 13% / reading 24%, grade F, #1,478 of 1,662 statewide, top 90%, 1,137 students, 58% FRL); East Central H S (math 21% / reading 28%, grade F, #1,264 of 1,632 statewide, top 82%, 3,252 students, 52% FRL) — zoned schools at 60% FRL track the district average.
- Market conditions: Rents rising fast (+4.3%/yr); 444 active listings in the ZIP; 5 comparable units currently listed for rent nearby; rentals at typical pace (median 26d on market — plan ~3-4 weeks tenant-placement turnaround); 40% of comp listings sitting > 30 days — soft ceiling on asking rent; 8,308 units permitted in Bexar County in 2024 (2,506 in 5+ unit buildings).
Forward outlook
- Local home prices are declining (-3.0%/yr); year-one equity from $1k of loan paydown is wiped out by about $6k of value loss. Plan a longer hold.
- Bexar County population projected at +50% by 2050 — long-run rental-demand tailwind backs the buy-and-hold thesis.
Negotiation context
- It's been on market 108 days — a 9% lower offer ($173k) is reasonable based on typical stale-listing flexibility.
Risks & watch-outs
- Climate carrying-cost: severe wind risk, 80% chance of damaging wind over 30y; extreme-heat days projected 7→20/yr by 2055 (HVAC capex compounding) — expect insurance premiums to compound above CPI over the hold.
Questions for the listing agent
- What do current leases actually rent for vs. the listed asking? Can we see a recent rent roll and the last 12 months of T-12 income?
- It's been on market 108 days. Have you received any prior offers? Is the seller open to a 21% concession, seller financing, or rate buy-down credit?
- Why hasn't it sold? Are there any deal-killer items the seller is aware of (foundation, flood, title, zoning, code violations)?
- Is there a deadline driving the sale (1031 exchange, divorce, estate, relocation)? That informs how much negotiation room exists.
- Crime grade is F in this area — have there been break-ins, vandalism, or insurance claims at this property in the last 3 years? What carrier currently insures it and at what premium?
- The area grade is low — what's the realistic commute time and amenity access for the typical tenant pool here? Any planned neighborhood developments (good or bad) we should know about?
- What's the average days-on-market for RENTAL listings here right now (not sales)? A rising rental-DOM trend means longer vacancies and softer asking-rent achievability than the comps imply.
- What's the recent tenant-quality profile in this submarket — average credit score on applications, eviction rate, late-payment / NSF rate, and stable-employment percentage? A property-management company in the area should have these aggregated.
- How much new for-sale + rental construction is in the pipeline within 1–3 miles? Heavy new supply typically softens prices + rents 12–24 months out; constrained supply supports both.
Investment metrics
- 1% rule
- 0.79% ✗
- Cap rate
- 5.44%
- Cash-on-cash
- -3.03%
- DSCR
- 0.87
- GRM
- 10.6
CMA / ARV
- ARV (median comp)
- $222,952
- List price
- $189,990
- Delta
- -14.78%
- Verdict
- UNDERPRICED
- Comps
- 20 within 1.0 mi
Show comp detail 10 sales within ~0.75 mi
| Address | Dist | Beds/Ba | Sqft | Sold | Price | $/sf | Match |
|---|---|---|---|---|---|---|---|
| 3030 Dreamweaver | 0.08mi | 2/2.0 | 1,106 (+14%) | 3mo | $220,740 | $200 | 70 |
| 5206 Thistle Pl | 0.08mi | 2/2.0 | 1,106 (+14%) | 3mo | $216,490 | $196 | 70 |
| 5215 Thistle Pl | 0.06mi | 2/2.0 | 1,106 (+14%) | 5mo | $214,990 | $194 | 69 |
| 4726 Flying Hooves | 0.10mi | 2/3.0 | 1,106 (+14%) | 0mo | $199,990 | $181 | 68 |
| 5243 Thistle Pl | 0.01mi | 2/2.0 | 1,106 (+14%) | 13mo | $219,490 | $198 | 65 |
| 5315 Thistle Pl | 0.04mi | 2/2.0 | 1,106 (+14%) | 12mo | $217,990 | $197 | 64 |
| 5302 Thistle Pl | 0.06mi | 2/2.0 | 1,106 (+14%) | 13mo | $220,990 | $200 | 62 |
| 5935 Lake Victoria | 0.68mi | 2/1.0 | 981 (+1%) | 12mo | $160,000 | $163 | 52 |
| 2431 Bermuda Dr | 0.51mi | 3/2.0 (+1) | 1,012 (+4%) | 20mo | $100,000 | $99 | 47 |
| 3534 Lake Tahoe | 0.72mi | 3/1.5 (+1) | 1,008 (+4%) | 23mo | $177,900 | $176 | 33 |
Match score weights: distance 35% · size 25% · config 20% · recency 20%. Top-matched comps best support the ARV.
Projected returns pro-forma
-3.0% appreciation · 4.35% rent growth · sell at horizon
- IRR
- -19.8%
- Equity multiple
- 0.30×
- Total profit
- $-37,266
- Equity at exit
- $28,328
- IRR
- -10.1%
- Equity multiple
- 0.35×
- Total profit
- $-34,713
- Equity at exit
- $16,427
Cash invested: $53,197 (down + closing). Projections, not guarantees.
Landlord ↔ Tenant lean methodology
- Overall (STATE)
- 87 Strongly Landlord-Friendly
- State Texas
- 87 Strongly Landlord-Friendly · R+5
- County
- — inherits STATE
- City
- — inherits STATE
ZIP-level market 78222
- Home prices YoY
- -4.8%
- Rents YoY
- 4.3%
- Active inventory
- 444
- Price-to-rent
- 10.6×
Monthly cashflow live
- Estimated rent
- $1,492 high interval (Pro) →
- Mortgage (P&I)
- −$996
- Tax est. 1.5%
- −$237 /mo · $2,850/yr
- Insurance
- −$79
- HOA
- −$0
- Vacancy / Maint / Mgmt
- −$313
- Net cashflow
- $-134
Break-even live
Sensitivity live
| Price | -10% $-3 | -5% $-69 | +0% $-134 | +5% $-200 | +10% $-266 |
|---|---|---|---|---|---|
| Rent | -10% $-252 | -5% $-193 | +0% $-134 | +5% $-75 | +10% $-16 |
| Rate | -1.0pp $-39 | -0.5pp $-86 | base $-134 | +0.5pp $-184 | +1.0pp $-234 |
UW: 25.0% down · 7.5% · 30yr · 1.5% tax · 5.0% vac · 8.0% maint · 8.0% mgmt
Financing live
Cash to close
- Down payment
- $47,498
- Closing costs
- $5,700
- Reserves months
- —
- Total cash needed
- —
Loan-product check · same deal, 3 products live
Conventional
25% down · 7.5% · 30yr
- Down + closing
- —
- Monthly P&I
- —
- Monthly cashflow
- —
- DSCR
- —
- Eligible?
- —
Personal DTI + credit; lowest rate.
DSCR
20% down · 8.5% · 30yr
- Down + closing
- —
- Monthly P&I
- —
- Monthly cashflow
- —
- DSCR
- —
- Eligible?
- —
No personal income docs; deal must DSCR.
Hard money
10% down · 12.0% · 12mo
- Down + closing
- —
- Monthly P&I
- —
- Monthly cashflow
- —
- DSCR
- —
- Eligible?
- —
Short-term bridge; refi at stabilization.
Rent comps 5 comps
| Address | Beds | Baths | Sqft | Rent | $/sqft | DOM | Units | Dist |
|---|---|---|---|---|---|---|---|---|
| 2718 Bermuda Dr San Antonio, TX | 3.0 | 2.0 | 1080 | $1,400 | $1.30 | 0d | 1 | 0.30mi |
| 3510 Bottomless Lk San Antonio, TX | 2.0 | 2.0 | 1068 | $1,150 | $1.08 | 45d | 1 | 0.68mi |
| 4226 Toledo Mist San Antonio, TX | 2.0 | 2.5 | 944 | $1,600 | $1.69 | 25d | 1 | 0.72mi |
| 4938 Bernadine Dr San Antonio, TX | 3.0 | 2.0 | 1078 | $2,000 | $1.86 | 25d | 1 | 1.26mi |
| 2825 S WW White Rd San Antonio, TX | 2.0 | 2.0 | 1007 | $927 | $0.92 | 45d | 1 | 1.45mi |
Listing history 16 events
-
2026-06-21days on market $189,990 Active 108 DOM
-
2026-06-18days on market $189,990 Active 105 DOM
-
2026-06-17days on market $189,990 Active 104 DOM
-
2026-06-16days on market $189,990 Active 103 DOM
-
2026-06-15days on market $189,990 Active 102 DOM
-
2026-06-13days on market $189,990 Active 100 DOM
-
2026-06-09days on market $189,990 Active 96 DOM
-
2026-06-08days on market $189,990 Active 95 DOM
-
2026-06-07days on market $189,990 Active 94 DOM
-
2026-06-04pricedays on market $189,990 Active 91 DOM
-
2026-06-03days on market $202,490 Active 90 DOM
-
2026-06-02days on market $202,490 Active 89 DOM
-
2026-06-01days on market $202,490 Active 88 DOM
-
2026-05-31days on market $202,490 Active 87 DOM
-
2026-05-01historical
-
2026-04-23$189,900 New
ⓘ Source: listings_history table (triggers on properties + properties_extension) + one-shot
backfill from property_details.listing_events for pre-trigger history.
Climate risk First Street
- Flood 1/10 Low FEMA zone X (unshaded) · 0% chance over 30 yrs
- Wildfire 4/10 Moderate
- Heat 8/10 Severe 7 d/yr ≥110°F today · 20 d/yr by 30 yrs out
- Wind 8/10 Severe 80% chance of damaging wind over 30 yrs
- Air quality 2/10 Low 0 unhealthy d/yr today · 2 by 30 yrs out
Nearby sold comps map
Loading sold comps map…
Walkable amenities ~0.75 mi
Loading nearby amenities…
Taxation est. · year 1
- Rental income
- $17,904
- − Mortgage interest
- −$10,642
- − Property taxes
- −$2,850
- − Insurance
- −$950
- − Repairs & maintenance
- −$1,432
- − Management
- −$1,432
- − Depreciation
- −$5,527
- Taxable loss
- −$4,930
- Est. tax savings @ 24.0%
- +$1,183
- After-tax cash flow
- $-429/yr
For passive investors: Depreciation is non-cash, so a rental often shows a tax loss while cash-flowing — sheltering income. Rental losses are passive: they offset passive income freely, and up to $25,000/yr can offset ordinary (W-2) income if you actively participate and your MAGI is under $100k (phasing out to $0 by $150k); unused losses carry forward. On sale, claimed depreciation is recaptured at up to 25%, and gains may owe capital-gains tax (a 1031 exchange can defer both). Figures are a year-1 estimate at your 24.0% rate — not tax advice; consult a CPA.
Condition & rehab AI · 1 photo
This home is in good condition with a good exterior and interior. It has potential for minor updates to enhance its curb appeal and interior, making it an attractive option for both resale and rental.
Value-add opportunities
- Both Painting the exterior siding — Fresh paint can enhance curb appeal and the home's value.
- Both Landscaping improvements — Enhanced landscaping can increase both resale and rental value.
- Both Interior touch-ups — Fresh paint and minor touch-ups can improve the home's appearance and value.
- Both Kitchen and bathroom updates — Modernizing these spaces can attract more buyers and renters.
- Both HVAC maintenance and minor repairs — A clean and functioning HVAC system is crucial for both comfort and energy efficiency.
Renovation cost estimate screening
Value-add ROI direction
- Both Painting the exterior siding — Fresh paint can enhance curb appeal and the home's value. ↑
- Both Landscaping improvements — Enhanced landscaping can increase both resale and rental value. ↑
- Both Interior touch-ups — Fresh paint and minor touch-ups can improve the home's appearance and value. ↑
- Both Kitchen and bathroom updates — Modernizing these spaces can attract more buyers and renters. ↑
- Both HVAC maintenance and minor repairs — A clean and functioning HVAC system is crucial for both comfort and energy efficiency. ↑
ⓘ Cost ranges are severity-bucket heuristics (US national rule-of-thumb). Get contractor quotes + a written scope before underwriting a rehab budget.
Schools (NCES district)
- District
- East Central ISD
- NCES district ID
- 4817850
- Math proficiency
- 16% ▼ -12.00%
- Reading proficiency
- 25% ▼ -6.00%
- Median HH income
- $53,941
- Composite
- 18.67/100
- National rank
- #8887
- State rank
- #758 of 826 in TX
Livability — San Antonio
- Score
- 80/100
- State rank
- #31
- US rank
- #1616
Category grades
Schools grade is shown separately in the Schools card above.
Census & demographics
- Census place
- San Antonio, TX
- County
- Bexar County · 1,990,555 people
- City population
- 1,806,925
- Metro
- San Antonio-New Braunfels, TX
- Population (ZIP)
- 26,476
- Household income
- $66,362
- Rent vs Own
- Severe rent burden
- 686.0
Population outlook (Bexar County) Hauer SSP2
- Today (2025)
- 2,336,851 people
- By 2030
- 2,560,728 · +9.6%
- By 2040
- 3,020,569 · +29.3%
- By 2050
- 3,493,522 · +49.5%
- By 2075
- 4,668,459 · +99.8%
- By 2100
- 5,533,242 · +136.8%
Race, ethnicity, and origin ACS 2023
- Neighborhood character
- Majority Hispanic (64%)
- Race & ethnicity
- Hispanic / Latino 64% Two or more races 26% White 19% Black 14% Asian 1%
- Hispanic origin (detail)
- Mexican 55%
- Common ancestry
- Romanian 1% Italian 1% Slovak 1%
- Foreign-born
- 14% · Canada
- Languages at home
- 61% English-only · Spanish 37% Arabic 1%
Political lean MEDSL · Bexar
- 2024 margin
- Lean D (+9.8) · D 54.3% · R 44.6% · Other 1.1%
- 2008→2024 swing
- +4.2pp toward D · 2008: 5.6pp · 2024: 9.8pp
- All cycles
- 2024: D+9.8 2020: D+18.2 2016: D+13.5 2012: D+4.6 2008: D+5.6
Not yet ingested
- Civics
- —
Market trends
- HPI YoY
- ▼ -14.18%
- Current HPI
- 278.8429
- Rent YoY
- ▲ 4.35%
- Metro
- San Antonio-New Braunfels, TX
- State GDP YoY
- ▲ 3.95%
- F500 in state
- 110
Industry mix (Fortune 500 HQ in TX)
| Industry | F500 HQs | Revenue |
|---|---|---|
| Energy | 16 | $1,198B |
|
||
| Technology | 5 | $198B |
|
||
| Engineering / Construction | 4 | $72B |
|
||
| Energy Services | 3 | $60B |
|
||
| Utilities | 3 | $41B |
|
||
| Healthcare | 2 | $330B |
|
||
Price history
2 events — show timeline
- 2026-05-01 Listing Removed — LERA
- 2026-04-23 Listed $189,900 LERA
Cash-flow waterfall
monthlySold comps — $/sqft
last 12 mo · ≤1 miLoading sold comps…