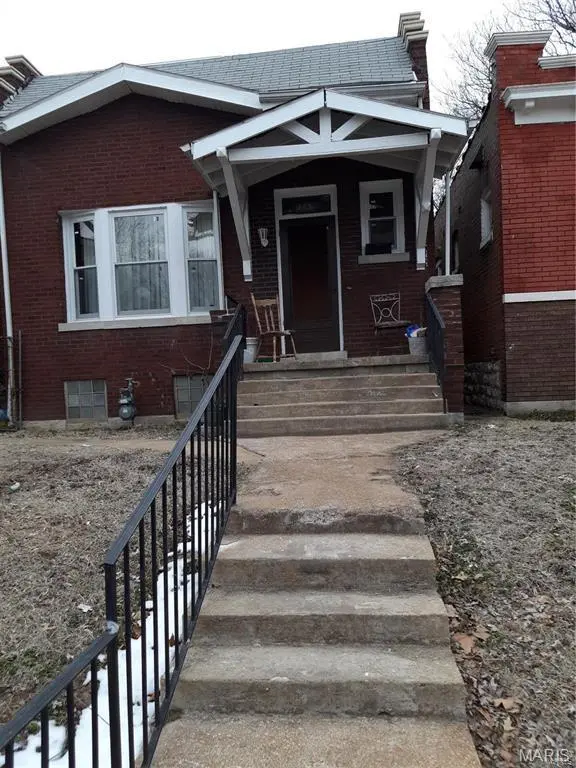
5119 Terry Ave · St. Louis, MO
Flood risk 1/10 · Minimal
- FEMA flood zone
- X (unshaded)
- Chance of flooding over 30 yrs
- 0.0%
- Est. flood insurance / yr
- $473 – $860
Fire risk 1/10 · Minimal
- Est. fire insurance / yr
- $1,054 – $1,958
Heat risk 5/10 · Moderate
- Hot days now (above 107°F)
- 7 days/yr
- Hot days in 30 yrs
- 21 days/yr
Wind risk 2/10 · Minimal
- Chance of severe wind over 30 yrs
- 1.0%
Air-quality risk 4/10 · Minor
- Unhealthy air days now
- 4 days/yr
- Unhealthy air days in 30 yrs
- 5 days/yr
Risk factors via First Street. Map © Google.
Why this score? — see what drove the C+ grade
The composite is a weighted blend of 9 inputs, each scored 0–100. Each bar is that input's sub-score; the figure is the points it added to the 100-point composite (weight × sub-score).
- Cash flow +30.0/30.0
- 1% rule +10.0/10.0
- DSCR +10.0/10.0
- Appreciation +3.3/10.0
- Rent growth +2.5/5.0
- Livability +2.5/5.0
- Condition / age +2.5/5.0
- Schools +1.2/10.0
- ARV discount +0.0/15.0
$35,000
🖨 Deal sheet 📄 Offer letter ✓ Due diligence
Listing remarks MLS
Three bedrooms brick house with one bath, living room, and separate kitchen. This home has a partially finished sunroom and partially finished backyard that can be used for additional parking. Great starter home and idea for investors. Must see! Motivated seller.
Key facts
- 3,550 sq ft lot
- Built 1915
- Listed 496 days
Neighborhood map
What this means for you Summary
Snapshot
- This is a 3-bed/1.0-bath single-family listed at $35k.
Deal economics
- At list price, monthly cash flow is $704 ($8k/yr) — positive.
- The deal already cash-flows at list — no discount required.
- Meets the 1% rule at list price ($1k rent vs $35k).
- Recommended offer: $31k (12.0% below list) — sets the bar for market timing.
- Cap rate 30.4% vs local median 5.0% in St. Louis — top-decile yield for the area; either an underpriced asset or a hidden risk that comps aren't pricing in. Stress-test before assuming the spread holds.
Location & tenants
- Location reads: area grade C — affects rentability + tenant quality, not the cash-flow math above.
- St. Louis City (urban): math 10% / reading 18% proficiency, ranked #312 of 324 in MO (top 96%) — low school quality limits family demand, transient renter base, plan for 1-2y turnover; 80% free/reduced lunch — lower-income household profile, screen leases tightly.
- Market conditions: 97 active listings in the ZIP; 24 comparable units currently listed for rent nearby; rentals lingering (median 44d on market — plan ~5-8 weeks vacancy on turnover, expect pricing pressure); 54% of comp listings sitting > 30 days — soft ceiling on asking rent; lower-income renter base — watch delinquency; 294 units permitted in St. Louis city in 2024 (227 in 5+ unit buildings).
- At $1,161/mo this rent would consume 45% of the median local household income ($31k/yr) (locally 1655% of renters already pay >50% of income on rent) — very limited rent-growth headroom before tenants either downsize or default.
Forward outlook
- Local home prices are declining (-3.0%/yr); year-one equity from $242 of loan paydown is wiped out by about $1k of value loss. Plan a longer hold.
- St. Louis County population projected to shrink 6% by 2050 — rents likely to lag national; underwrite the cash flow, not the appreciation.
- At projected returns (-3.0% appreciation + 3.0% rent growth), your $10k cash investment doubles in ~2 years — after that, you're playing with house money.
Negotiation context
- It's been on market 496 days — a 12% lower offer ($31k) is reasonable based on typical stale-listing flexibility.
- 2 sale attempts since 12y ago with the ask held roughly flat each time — persistent listings suggest the price (not the market) is what's stuck; bring a comps-based counter.
Risks & watch-outs
- Watch-outs: built in 1915 — expect roof / HVAC / electrical / plumbing capex.
- Climate carrying-cost: extreme-heat days projected 7→21/yr by 2055 (HVAC capex compounding) — expect insurance premiums to compound above CPI over the hold.
Questions for the listing agent
- It's been on market 496 days. Have you received any prior offers? Is the seller open to a 12% concession, seller financing, or rate buy-down credit?
- Built in 1915 — when were the roof, HVAC, electrical panel, plumbing, and water heater last replaced?
- Why hasn't it sold? Are there any deal-killer items the seller is aware of (foundation, flood, title, zoning, code violations)?
- Is there a deadline driving the sale (1031 exchange, divorce, estate, relocation)? That informs how much negotiation room exists.
- What's the average days-on-market for RENTAL listings here right now (not sales)? A rising rental-DOM trend means longer vacancies and softer asking-rent achievability than the comps imply.
- What's the recent tenant-quality profile in this submarket — average credit score on applications, eviction rate, late-payment / NSF rate, and stable-employment percentage? A property-management company in the area should have these aggregated.
- How much new for-sale + rental construction is in the pipeline within 1–3 miles? Heavy new supply typically softens prices + rents 12–24 months out; constrained supply supports both.
Investment metrics
- 1% rule
- 3.32% ✓
- Cap rate
- 30.43%
- Cash-on-cash
- 86.19%
- DSCR
- 4.84
- GRM
- 2.5
CMA / ARV
- ARV (median comp)
- $26,786
- List price
- $35,000
- Delta
- 30.66%
- Verdict
- OVERPRICED
- Comps
- 20 within 1.0 mi
Show comp detail 12 sales within ~0.75 mi
| Address | Dist | Beds/Ba | Sqft | Sold | Price | $/sf | Match |
|---|---|---|---|---|---|---|---|
| 5126 Terry Ave | 0.04mi | 2/1.0 (-1) | 1,091 (0%) | 6mo | $4,900 | $4 | 88 |
| 5226 Saint Louis Ave | 0.14mi | 2/1.0 (-1) | 1,050 (-4%) | 11mo | $65,000 | $62 | 74 |
| 5232 Highland Ave | 0.27mi | 3/1.5 | 1,030 (-6%) | 6mo | $65,000 | $63 | 71 |
| 2917 Abner Pl | 0.36mi | 3/1.0 | 1,104 (+1%) | 13mo | $25,000 | $23 | 70 |
| 5250 Highland Ave | 0.29mi | 4/3.0 (+1) | 1,129 (+4%) | 2mo | $102,000 | $90 | 66 |
| 4844 Northland Ave | 0.42mi | 3/1.0 | 1,128 (+3%) | 10mo | $58,500 | $52 | 66 |
| 5109 Cote Brilliante Ave | 0.41mi | 2/1.0 (-1) | 1,188 (+9%) | 4mo | $52,000 | $44 | 58 |
| 4859 Sacramento Ave | 0.67mi | 2/1.0 (-1) | 1,104 (+1%) | 11mo | $54,900 | $50 | 53 |
| 2810 Arlington Ave | 0.41mi | 2/1.0 (-1) | 968 (-11%) | 5mo | $25,000 | $26 | 53 |
| 4941 Lexington Ave | 0.41mi | 3/2.0 | 1,240 (+14%) | 11mo | $124,900 | $101 | 45 |
| 1636 Belt Ave | 0.72mi | 2/1.0 (-1) | 1,003 (-8%) | 9mo | $19,900 | $20 | 41 |
| 1632 Belt Ave | 0.72mi | 2/1.0 (-1) | 1,003 (-8%) | 12mo | $37,900 | $38 | 38 |
Match score weights: distance 35% · size 25% · config 20% · recency 20%. Top-matched comps best support the ARV.
Projected returns pro-forma
-3.0% appreciation · 3.0% rent growth · sell at horizon
- IRR
- 86.7%
- Equity multiple
- 5.00×
- Total profit
- $39,160
- Equity at exit
- $5,219
- IRR
- 89.8%
- Equity multiple
- 10.37×
- Total profit
- $91,827
- Equity at exit
- $3,026
Cash invested: $9,800 (down + closing). Projections, not guarantees.
Landlord ↔ Tenant lean methodology
- Overall (STATE)
- 81 Strongly Landlord-Friendly
- State Missouri
- 81 Strongly Landlord-Friendly · R+10
- County
- — inherits STATE
- City
- — inherits STATE
ZIP-level market 63115
- Home prices YoY
- -2.6%
- Active inventory
- 97
- Price-to-rent
- 2.5×
Monthly cashflow live
- Estimated rent
- $1,161 high interval (Pro) →
- Mortgage (P&I)
- −$184
- Tax from tax record
- −$15 /mo · $180/yr
- Insurance
- −$15
- HOA
- −$0
- Vacancy / Maint / Mgmt
- −$244
- Net cashflow
- $704
Break-even live
UW: 25.0% down · 7.5% · 30yr · 1.5% tax · 5.0% vac · 8.0% maint · 8.0% mgmt
Financing live
Cash to close
- Down payment
- $8,750
- Closing costs
- $1,050
- Reserves months
- —
- Total cash needed
- —
Loan-product check · same deal, 3 products live
Conventional
25% down · 7.5% · 30yr
- Down + closing
- —
- Monthly P&I
- —
- Monthly cashflow
- —
- DSCR
- —
- Eligible?
- —
Personal DTI + credit; lowest rate.
DSCR
20% down · 8.5% · 30yr
- Down + closing
- —
- Monthly P&I
- —
- Monthly cashflow
- —
- DSCR
- —
- Eligible?
- —
No personal income docs; deal must DSCR.
Hard money
10% down · 12.0% · 12mo
- Down + closing
- —
- Monthly P&I
- —
- Monthly cashflow
- —
- DSCR
- —
- Eligible?
- —
Short-term bridge; refi at stabilization.
Rent comps 24 comps
| Address | Beds | Baths | Sqft | Rent | $/sqft | DOM | Units | Dist |
|---|---|---|---|---|---|---|---|---|
| 2831 Abner Pl Unit 7 St. Louis, MO | 2.0 | 1.0 | 968 | $1,250 | $1.29 | 23d | 1 | 0.33mi |
| 1965 Arlington Ave Saint Louis, MO | 3.0 | 1.0 | 980 | $1,300 | $1.33 | 4d | 1 | 0.50mi |
| 5333 Patton Ave St. Louis, MO | 3.0 | 1.5 | 1262 | $1,250 | $0.99 | 44d | 1 | 0.52mi |
| 5345 Wells Ave Unit 2ND St. Louis, MO | 3.0 | 1.0 | 1127 | $1,095 | $0.97 | 23d | 1 | 0.75mi |
| 4627 Maffitt Ave Saint Louis, MO | 2.0 | 1.0 | 704 | $795 | $1.13 | 44d | 1 | 0.75mi |
| 1420 Union Blvd Unit 2F St. Louis, MO | 2.0 | 1.0 | 1096 | $995 | $0.91 | 44d | 1 | 0.78mi |
| 5608 Wabada Ave Saint Louis, MO | 2.0 | 1.0 | 910 | $1,300 | $1.43 | 16d | 1 | 0.79mi |
| 5662 Maffitt Ave Saint Louis, MO | 2.0 | 1.0 | 850 | $895 | $1.05 | 7d | 1 | 0.85mi |
| 4040 Shreve Ave Saint Louis, MO | 3.0 | 1.0 | 1201 | $1,250 | $1.04 | 44d | 1 | 0.93mi |
| 5203 Page Blvd Unit 5201 1st Floor St. Louis, MO | 2.0 | 1.0 | 1000 | $750 | $0.75 | 14d | 1 | 0.93mi |
| 1232 N Euclid Ave Saint Louis, MO | 3.0 | 1.5 | 982 | $1,395 | $1.42 | 44d | 1 | 0.94mi |
| 4642 Farlin Ave Unit 1F St. Louis, MO | 2.0 | 1.0 | 1056 | $800 | $0.76 | 44d | 1 | 1.02mi |
| 4847 Calvin Ave Saint Louis, MO | 3.0 | 2.0 | 1000 | $1,473 | $1.47 | 2d | 1 | 1.18mi |
| 5818 Ferris Ave Saint Louis, MO | 3.0 | 1.0 | 1014 | $1,500 | $1.48 | 44d | 1 | 1.25mi |
| 4497 Lee Ave Saint Louis, MO | 3.0 | 2.0 | 1012 | $1,000 | $0.99 | 16d | 1 | 1.26mi |
| 5824 Ferris Ave Saint Louis, MO | 4.0 | 2.0 | 1008 | $1,500 | $1.49 | 44d | 1 | 1.27mi |
| 5345 Cabanne Ave Unit 5345 Cabanne 1S St. Louis, MO | 2.0 | 1.0 | 800 | $950 | $1.19 | 44d | 1 | 1.27mi |
| 763 Walton Ave Unit 763 St. Louis, MO | 2.0 | 1.0 | 1100 | $1,100 | $1.00 | 44d | 1 | 1.32mi |
| 5130 Kensington Ave Unit 1 St. Louis, MO | 3.0 | 2.0 | 1200 | $1,245 | $1.04 | 23d | 1 | 1.33mi |
| 4493 Bessie Ave Saint Louis, MO | 3.0 | 1.0 | 880 | $1,250 | $1.42 | 44d | 1 | 1.36mi |
| 3720 Darby St Saint Louis, MO | 2.0 | 1.0 | 960 | $1,123 | $1.17 | 44d | 1 | 1.43mi |
| 625 N Euclid Ave St. Louis, MO | 2.0 | 1.0–2.0 | 984 | $3,120 | $3.17 | 1d | 16 | 1.44mi |
| 4919 Thekla Ave Saint Louis, MO | 2.0 | 1.0 | 931 | $700 | $0.75 | 44d | 1 | 1.47mi |
| 4715 Thrush Ave Unit 24 St. Louis, MO | 2.0 | 1.0 | 900 | $1,350 | $1.50 | 23d | 1 | 1.48mi |
Listing history 17 events
-
2026-06-18days on market $35,000 Active 496 DOM
-
2026-06-17days on market $35,000 Active 495 DOM
-
2026-06-16days on market $35,000 Active 494 DOM
-
2026-06-15days on market $35,000 Active 493 DOM
-
2026-06-13days on market $35,000 Active 491 DOM
-
2026-06-09days on market $35,000 Active 487 DOM
-
2026-06-08days on market $35,000 Active 486 DOM
-
2026-06-08days on market $35,000 Active 485 DOM
-
2026-06-05days on market $35,000 Active 482 DOM
-
2026-06-03days on market $35,000 Active 481 DOM
-
2026-06-02days on market $35,000 Active 480 DOM
-
2026-06-01days on market $35,000 Active 479 DOM
-
2026-06-01days on market $35,000 Active 478 DOM
-
2025-02-08$35,000 Active 264-char remark
Show marketing remark (264 chars)
Three bedrooms brick house with one bath, living room, and separate kitchen. This home has a partially finished sunroom and partially finished backyard that can be used for additional parking. Great starter home and idea for investors. Must see! Motivated seller.
-
2015-02-17soldstatus 712-char remark
Show marketing remark (712 chars)
ATTENTION FIRST TIME HOME BUYERS AND INVESTORS!!! This home Will Not Last Long!!! This property is LOADED with Potential! Bring your Great Ideas and Call It Yours! SCHEDULE YOUR SHOWING TODAY!!! Seller's Disclosure statement is not available. Special Sale Contract (form #2043) required. Must have a pre-qualification letter or proof of funds prior to considering the potential buyer' s offer. The following verbiage must be added to all offers, Pursuant to paragraph 28 of the Real Estate Purchase Addendum, this document is subject to all terms and conditions set forth in the Real Estate Purchase Addendum. Buyer is responsible for all title company fees. Property is subject to HUD Guidelines 24 CFR 206.125.
-
2014-12-23$6,000 712-char remark
Show marketing remark (712 chars)
ATTENTION FIRST TIME HOME BUYERS AND INVESTORS!!! This home Will Not Last Long!!! This property is LOADED with Potential! Bring your Great Ideas and Call It Yours! SCHEDULE YOUR SHOWING TODAY!!! Seller's Disclosure statement is not available. Special Sale Contract (form #2043) required. Must have a pre-qualification letter or proof of funds prior to considering the potential buyer' s offer. The following verbiage must be added to all offers, Pursuant to paragraph 28 of the Real Estate Purchase Addendum, this document is subject to all terms and conditions set forth in the Real Estate Purchase Addendum. Buyer is responsible for all title company fees. Property is subject to HUD Guidelines 24 CFR 206.125.
-
1996-11-06soldstatus
ⓘ Source: listings_history table (triggers on properties + properties_extension) + one-shot
backfill from property_details.listing_events for pre-trigger history.
Tax reassessment forecast MO · Resets to sale price
- Current annual tax
- $180 · $15/mo
- Projected year-2 tax
- $340 · $28/mo
- Expected delta
- +$159/yr (+$13/mo · 88.3%)
ⓘ Screening estimate from a state-policy table — verify with the county assessor before closing.
Climate risk First Street
- Flood 1/10 Low FEMA zone X (unshaded) · 0% chance over 30 yrs
- Wildfire 1/10 Low
- Heat 5/10 Major 7 d/yr ≥107°F today · 21 d/yr by 30 yrs out
- Wind 2/10 Low 100% chance of damaging wind over 30 yrs
- Air quality 4/10 Moderate 4 unhealthy d/yr today · 5 by 30 yrs out
Nearby sold comps map
Loading sold comps map…
Walkable amenities ~0.75 mi
Loading nearby amenities…
Taxation est. · year 1
- Rental income
- $13,930
- − Mortgage interest
- −$1,961
- − Property taxes
- −$180
- − Insurance
- −$175
- − Repairs & maintenance
- −$1,114
- − Management
- −$1,114
- − Depreciation
- −$1,018
- Taxable income
- $8,367
- Est. tax owed @ 24.0%
- −$2,008
- After-tax cash flow
- $6,439/yr
For passive investors: Depreciation is non-cash, so a rental often shows a tax loss while cash-flowing — sheltering income. Rental losses are passive: they offset passive income freely, and up to $25,000/yr can offset ordinary (W-2) income if you actively participate and your MAGI is under $100k (phasing out to $0 by $150k); unused losses carry forward. On sale, claimed depreciation is recaptured at up to 25%, and gains may owe capital-gains tax (a 1031 exchange can defer both). Figures are a year-1 estimate at your 24.0% rate — not tax advice; consult a CPA.
Schools (NCES district)
- District
- St. Louis City
- NCES district ID
- 2929280
- Math proficiency
- 10% ▼ -6.00%
- Reading proficiency
- 18% ▼ -3.00%
- Median HH income
- $35,685
- Composite
- 11.54/100
- National rank
- #9699
- State rank
- #312 of 324 in MO
Livability — St. Louis
No livability data for this city. (Only ~50 U.S. cities are tracked.)
Census & demographics
- Census place
- St. Louis, MO
- County
- Saint Louis City · 254,015 people
- City population
- 283,259
- Metro
- St. Louis, MO-IL
- Population (ZIP)
- 14,488
- Household income
- $30,622
- Rent vs Own
- Severe rent burden
- 1655.0
Population outlook (St. Louis County) Hauer SSP2
- Today (2025)
- 315,737 people
- By 2030
- 313,865 · -0.6%
- By 2040
- 305,439 · -3.3%
- By 2050
- 296,529 · -6.1%
- By 2075
- 271,028 · -14.2%
- By 2100
- 255,359 · -19.1%
Race, ethnicity, and origin ACS 2023
- Neighborhood character
- Predominantly Black (95%)
- Race & ethnicity
- Black 95% White 2% Two or more races 2%
- Foreign-born
- 0%
Political lean MEDSL · St. Louis
- 2024 margin
- Solid D (+64.7) · D 81.4% · R 16.7% · Other 2.0%
- 2008→2024 swing
- -3.5pp toward R · 2008: 68.2pp · 2024: 64.7pp
- All cycles
- 2024: D+64.7 2020: D+66.2 2016: D+63.7 2012: D+66.6 2008: D+68.2
Not yet ingested
- Civics
- —
Market trends
- HPI YoY
- ▼ -3.42%
- Current HPI
- 127.3403
- Rent YoY
- —
- Metro
- St. Louis, MO-IL
- State GDP YoY
- ▲ 1.84%
- F500 in state
- 20
Industry mix (Fortune 500 HQ in MO)
| Industry | F500 HQs | Revenue |
|---|---|---|
| Healthcare | 1 | $163B |
|
||
| Insurance | 1 | $21B |
|
||
| Industrial Technology | 1 | $17B |
|
||
| Retail | 1 | $16B |
|
||
| Industrial Distribution | 1 | $10B |
|
||
| Utilities | 1 | $9B |
|
||
Price history
+483.3% since first listed4 events — show timeline
- 2025-02-08 Listed $35,000 MARIS as Distributed by MLS Grid
- 2015-02-17 Sold (MLS) — MARIS as Distributed by MLS Grid
- 2014-12-23 Listed $6,000 MARIS as Distributed by MLS Grid
- 1996-11-06 Sold (Public Records) — Public Records
Property tax history
-4.3%/yrLatest (2024): $180 · +4.3% YoY. Source: county tax records.
Cash-flow waterfall
monthlySold comps — $/sqft
last 12 mo · ≤1 miLoading sold comps…