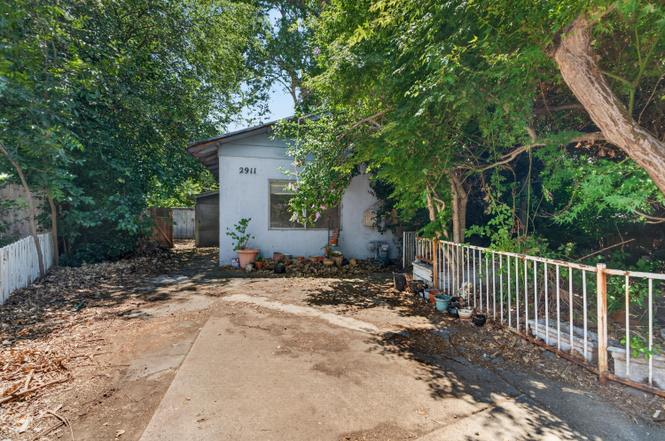
2911 Roan Ct · Anderson, CA
Flood risk 7/10 · Major
- FEMA flood zone
- X (shaded)
- Chance of flooding over 30 yrs
- 0.75%
- Est. flood insurance / yr
- $507 – $1,088
Fire risk 8/10 · Major
- Est. fire insurance / yr
- $659 – $1,223
Heat risk 8/10 · Major
- Hot days now (above 104°F)
- 7 days/yr
- Hot days in 30 yrs
- 15 days/yr
Wind risk 1/10 · Minimal
- Chance of severe wind over 30 yrs
- —
Air-quality risk 10/10 · Severe
- Unhealthy air days now
- 35 days/yr
- Unhealthy air days in 30 yrs
- 42 days/yr
Risk factors via First Street. Map © Google.
Why this score? — see what drove the B- grade
The composite is a weighted blend of 9 inputs, each scored 0–100. Each bar is that input's sub-score; the figure is the points it added to the 100-point composite (weight × sub-score).
- Cash flow +30.0/30.0
- 1% rule +10.0/10.0
- DSCR +10.0/10.0
- ARV discount +7.5/15.0
- Livability +3.4/5.0
- Rent growth +2.5/5.0
- Condition / age +2.5/5.0
- Schools +2.4/10.0
- Appreciation +0.0/10.0
$155,000
🖨 Deal sheet 📄 Offer letter ✓ Due diligence
Listing remarks
Opportunity is knocking! This 3-bedroom, 2-bath home sits on a generously sized lot and offers plenty of potential for the buyer ready to roll up their sleeves and make it their own. Featuring a garage conversion that adds valuable bonus living space, the flexible floor plan can adapt to a variety of needs including a second living area, game room, home office, or hobby space. Outside, you'll find a large covered patio perfect for entertaining, relaxing, or enjoying the shade of the mature trees that give the property character and charm. This is a contractors special, property sold as is. Bring your vision and unlock the potential this property has to offer.
Key facts
- Garage conversion
- Flexible floor plan
- Large covered patio
Tags
Property features AI
Exterior
- Utilities: Public water; Public sewer
- Home design: Single-family residence; One story
- Construction: Wood siding; Slab foundation
- Exterior features: Composition roof; City lot, level; Concrete road access; Property has a view
Interior
- Bathrooms: 2 full bathrooms
- Interior features: No fireplace; Has cooling (evaporative); Has heating (wall furnace)
Neighborhood map
What this means for you Summary
Snapshot
- This is a 4-bed/2.0-bath single-family listed at $155k.
Deal economics
- At list price, monthly cash flow is $748 ($9k/yr) — positive.
- The deal already cash-flows at list — no discount required.
- Meets the 1% rule at list price ($2k rent vs $155k).
- Cap rate 12.6% vs local median 3.5% in Anderson — top-decile yield for the area; either an underpriced asset or a hidden risk that comps aren't pricing in. Stress-test before assuming the spread holds.
Location & tenants
- Location reads 68/100 on livability (#277 in CA) — a middle-class / working-renter tenant base. Strengths: commute A+, health & safety A+, housing A-; Watch: employment D, crime F, amenities F.
- Cascade Union Elementary (suburban): math 25% / reading 32% proficiency, ranked #377 of 517 in CA (top 73%) — low school quality limits family demand, transient renter base, plan for 1-2y turnover; 70% free/reduced lunch — lower-income household profile, screen leases tightly.
- Market conditions: 224 active listings in the ZIP; 2 comparable units currently listed for rent nearby; 246 units permitted in Shasta County in 2024 (0 in 5+ unit buildings).
- At $2,358/mo this rent would consume 46% of the median local household income ($61k/yr) (locally 758% of renters already pay >50% of income on rent) — very limited rent-growth headroom before tenants either downsize or default.
Forward outlook
- Local home prices are declining (-3.0%/yr); year-one equity from $1k of loan paydown is wiped out by about $5k of value loss. Plan a longer hold.
- Shasta County population projected to shrink 9% by 2050 — rents likely to lag national; underwrite the cash flow, not the appreciation.
- At projected returns (-3.0% appreciation + 3.0% rent growth), your $43k cash investment doubles in ~6 years — after that, you're playing with house money.
Negotiation context
- Only 7 days on market — expect competitive offers; lowballing is unlikely to land.
Risks & watch-outs
- Watch-outs: flood insurance adds $66/mo; built in 1954 — expect roof / HVAC / electrical / plumbing capex.
- Climate carrying-cost: major flood risk; severe wildfire risk; extreme-heat days projected 7→15/yr by 2055 (HVAC capex compounding) — expect insurance premiums to compound above CPI over the hold.
Questions for the listing agent
- Built in 1954 — when were the roof, HVAC, electrical panel, plumbing, and water heater last replaced?
- What's the actual annual flood-insurance premium (NFIP or private), and is the property in a SFHA with mandatory coverage?
- Is there a deadline driving the sale (1031 exchange, divorce, estate, relocation)? That informs how much negotiation room exists.
- Crime grade is F in this area — have there been break-ins, vandalism, or insurance claims at this property in the last 3 years? What carrier currently insures it and at what premium?
- What's the average days-on-market for RENTAL listings here right now (not sales)? A rising rental-DOM trend means longer vacancies and softer asking-rent achievability than the comps imply.
- What's the recent tenant-quality profile in this submarket — average credit score on applications, eviction rate, late-payment / NSF rate, and stable-employment percentage? A property-management company in the area should have these aggregated.
- How much new for-sale + rental construction is in the pipeline within 1–3 miles? Heavy new supply typically softens prices + rents 12–24 months out; constrained supply supports both.
Investment metrics
- 1% rule
- 1.52% ✓
- Cap rate
- 12.60%
- Cash-on-cash
- 22.52%
- DSCR
- 2.00
- GRM
- 5.5
CMA / ARV
- ARV (on-the-fly)
- $352,404
- Comps found
- 12
Show comp detail 12 sales within ~0.75 mi
| Address | Dist | Beds/Ba | Sqft | Sold | Price | $/sf | Match |
|---|---|---|---|---|---|---|---|
| 3100 Driftstone Dr | 0.21mi | 3/2.0 (-1) | 1,382 (-2%) | 3mo | $315,000 | $228 | 80 |
| 2771 North St | 0.38mi | 3/2.0 (-1) | 1,373 (-2%) | 0mo | $365,000 | $266 | 73 |
| 2740 Sandstone Dr | 0.19mi | 3/2.0 (-1) | 1,300 (-7%) | 2mo | $335,000 | $258 | 72 |
| 2863 Sandstone Dr | 0.13mi | 3/2.0 (-1) | 1,538 (+10%) | 2mo | $303,975 | $198 | 71 |
| 3267 E Bailey Dr | 0.43mi | 3/2.0 (-1) | 1,433 (+2%) | 2mo | $322,000 | $225 | 70 |
| 3130 Driftstone Dr | 0.23mi | 3/2.0 (-1) | 1,290 (-8%) | 4mo | $305,000 | $236 | 67 |
| 2345 Shenandoah Dr | 0.53mi | 3/3.0 (-1) | 1,495 (+6%) | 6mo | $395,000 | $264 | 50 |
| 3414 Bardick Rd | 0.67mi | 3/2.0 (-1) | 1,257 (-10%) | 0mo | $290,000 | $231 | 46 |
| 3274 Marmac Rd | 0.54mi | 3/2.0 (-1) | 1,204 (-14%) | 1mo | $317,000 | $263 | 45 |
| 3701 Vinewood Dr | 0.74mi | 3/2.0 (-1) | 1,344 (-4%) | 10mo | $337,000 | $251 | 45 |
| 3381 Southwood Dr | 0.67mi | 3/2.0 (-1) | 1,262 (-10%) | 7mo | $369,900 | $293 | 41 |
| 3371 Bardick Rd | 0.67mi | 3/2.0 (-1) | 1,564 (+11%) | 7mo | $390,000 | $249 | 39 |
Match score weights: distance 35% · size 25% · config 20% · recency 20%. Top-matched comps best support the ARV.
Projected returns pro-forma
-3.0% appreciation · 3.0% rent growth · sell at horizon
- IRR
- 13.1%
- Equity multiple
- 1.52×
- Total profit
- $22,583
- Equity at exit
- $23,111
- IRR
- 21.9%
- Equity multiple
- 2.87×
- Total profit
- $81,258
- Equity at exit
- $13,402
Cash invested: $43,400 (down + closing). Projections, not guarantees.
Landlord ↔ Tenant lean methodology
- Overall (STATE)
- 18 Strongly Tenant-Friendly
- State California
- 18 Strongly Tenant-Friendly · D+13
- County
- — inherits STATE
- City
- — inherits STATE
ZIP-level market 96007
- Active inventory
- 224
- Price-to-rent
- 5.5×
Monthly cashflow live
- Estimated rent
- $2,358 medium interval (Pro) →
- Mortgage (P&I)
- −$813
- Tax from tax record
- −$171 /mo · $2,053/yr
- Insurance
- −$65
- Flood insurance flood zone
- −$66 /mo · $798/yr
- HOA
- −$0
- Vacancy / Maint / Mgmt
- −$495
- Net cashflow
- $748
Break-even live
UW: 25.0% down · 7.5% · 30yr · 1.5% tax · 5.0% vac · 8.0% maint · 8.0% mgmt
Financing live
Cash to close
- Down payment
- $38,750
- Closing costs
- $4,650
- Reserves months
- —
- Total cash needed
- —
Loan-product check · same deal, 3 products live
Conventional
25% down · 7.5% · 30yr
- Down + closing
- —
- Monthly P&I
- —
- Monthly cashflow
- —
- DSCR
- —
- Eligible?
- —
Personal DTI + credit; lowest rate.
DSCR
20% down · 8.5% · 30yr
- Down + closing
- —
- Monthly P&I
- —
- Monthly cashflow
- —
- DSCR
- —
- Eligible?
- —
No personal income docs; deal must DSCR.
Hard money
10% down · 12.0% · 12mo
- Down + closing
- —
- Monthly P&I
- —
- Monthly cashflow
- —
- DSCR
- —
- Eligible?
- —
Short-term bridge; refi at stabilization.
Rent comps 2 comps
| Address | Beds | Baths | Sqft | Rent | $/sqft | DOM | Units | Dist |
|---|---|---|---|---|---|---|---|---|
| 3190 Driftstone Dr Anderson, CA | 3.0 | 2.0 | 1750 | $2,200 | $1.26 | 21d | 1 | 0.27mi |
| 2601 Sapphire Ln Unit 3 Anderson, CA | 3.0 | 2.5 | 1538 | $2,150 | $1.40 | 13d | 1 | 0.67mi |
Listing history 8 events
-
2026-06-18status $155,000 Pending 7 DOM
-
2026-06-18days on market $155,000 Active 7 DOM
-
2026-06-17days on market $155,000 Active 6 DOM
-
2026-06-16days on market $155,000 Active 5 DOM
-
2026-06-15days on market $155,000 Active 4 DOM
-
2026-06-14days on market $155,000 Active 2 DOM
-
2026-06-13remarks 667-char remark
-
2026-06-13$155,000 Active 1 DOM
ⓘ Source: listings_history table (triggers on properties + properties_extension) + one-shot
backfill from property_details.listing_events for pre-trigger history.
Tax reassessment forecast CA · Resets to sale price
- Current annual tax
- $2,053 · $171/mo
- Projected year-2 tax
- $2,053 · $171/mo
- Expected delta
- $0/yr ($0/mo · 0.0%)
ⓘ Screening estimate from a state-policy table — verify with the county assessor before closing.
Climate risk First Street
- Flood 7/10 Severe FEMA zone X (shaded) · 75% chance over 30 yrs
- Wildfire 8/10 Severe
- Heat 8/10 Severe 7 d/yr ≥104°F today · 15 d/yr by 30 yrs out
- Wind 1/10 Low
- Air quality 10/10 Extreme 35 unhealthy d/yr today · 42 by 30 yrs out
Nearby sold comps map
Loading sold comps map…
Walkable amenities ~0.75 mi
Loading nearby amenities…
Taxation est. · year 1
- Rental income
- $28,297
- − Mortgage interest
- −$8,682
- − Property taxes
- −$2,053
- − Insurance
- −$1,572
- − Repairs & maintenance
- −$2,264
- − Management
- −$2,264
- − Depreciation
- −$4,509
- Taxable income
- $6,953
- Est. tax owed @ 24.0%
- −$1,669
- After-tax cash flow
- $7,307/yr
For passive investors: Depreciation is non-cash, so a rental often shows a tax loss while cash-flowing — sheltering income. Rental losses are passive: they offset passive income freely, and up to $25,000/yr can offset ordinary (W-2) income if you actively participate and your MAGI is under $100k (phasing out to $0 by $150k); unused losses carry forward. On sale, claimed depreciation is recaptured at up to 25%, and gains may owe capital-gains tax (a 1031 exchange can defer both). Figures are a year-1 estimate at your 24.0% rate — not tax advice; consult a CPA.
Schools (NCES district)
- District
- Cascade Union Elementary
- NCES district ID
- 0607680
- Math proficiency
- 25% ▲ 1.00%
- Reading proficiency
- 32% ▲ 1.00%
- Median HH income
- $35,602
- Composite
- 23.56/100
- National rank
- #7856
- State rank
- #377 of 517 in CA
Livability — Anderson
- Score
- 68/100
- State rank
- #277
- US rank
- #9315
Category grades
Schools grade is shown separately in the Schools card above.
Census & demographics
- Census place
- Anderson, CA
- County
- Shasta County · 147,641 people
- City population
- 24,768
- Metro
- Redding, CA
- Population (ZIP)
- 24,768
- Household income
- $61,357
- Rent vs Own
- Severe rent burden
- 758.0
Population outlook (Shasta County) Hauer SSP2
- Today (2025)
- 179,231 people
- By 2030
- 176,953 · -1.3%
- By 2040
- 169,982 · -5.2%
- By 2050
- 162,547 · -9.3%
- By 2075
- 145,649 · -18.7%
- By 2100
- 123,025 · -31.4%
Race, ethnicity, and origin ACS 2023
- Neighborhood character
- Predominantly White (74%)
- Race & ethnicity
- White 74% Hispanic / Latino 15% Two or more races 12% Asian 3% Native American 2%
- Hispanic origin (detail)
- Mexican 11%
- Common ancestry
- Italian 6% Portuguese 2% Lithuanian 2%
- Foreign-born
- 6% · Canada, China, Vietnam
- Languages at home
- 90% English-only · Spanish 8% Other Indo-European 1% Chinese 1%
Political lean MEDSL · Shasta
- 2024 margin
- Solid R (+36.5) · D 30.5% · R 67.0% · Other 2.5%
- 2008→2024 swing
- -10.7pp toward R · 2008: -25.8pp · 2024: -36.5pp
- All cycles
- 2024: R+36.5 2020: R+33.1 2016: R+37.4 2012: R+30.3 2008: R+25.8
Not yet ingested
- Civics
- —
Market trends
- HPI YoY
- ▼ -191.70%
- Current HPI
- 179.6613
- Rent YoY
- —
- Metro
- Redding, CA
- State GDP YoY
- ▲ 3.21%
- F500 in state
- 116
Industry mix (Fortune 500 HQ in CA)
| Industry | F500 HQs | Revenue |
|---|---|---|
| Technology | 27 | $1,492B |
|
||
| Financial Services | 3 | $174B |
|
||
| Retail | 3 | $44B |
|
||
| Insurance | 3 | $26B |
|
||
| Media / Entertainment | 2 | $115B |
|
||
| Pharmaceuticals / Biotech | 2 | $62B |
|
||
Price history
1 event — show timeline
- 2026-06-11 Listed $155,000 SAOR
Property tax history
+2.5%/yrLatest (2025): $2,053 · +12.7% YoY. Source: county tax records.
Cash-flow waterfall
monthlySold comps — $/sqft
last 12 mo · ≤1 miLoading sold comps…