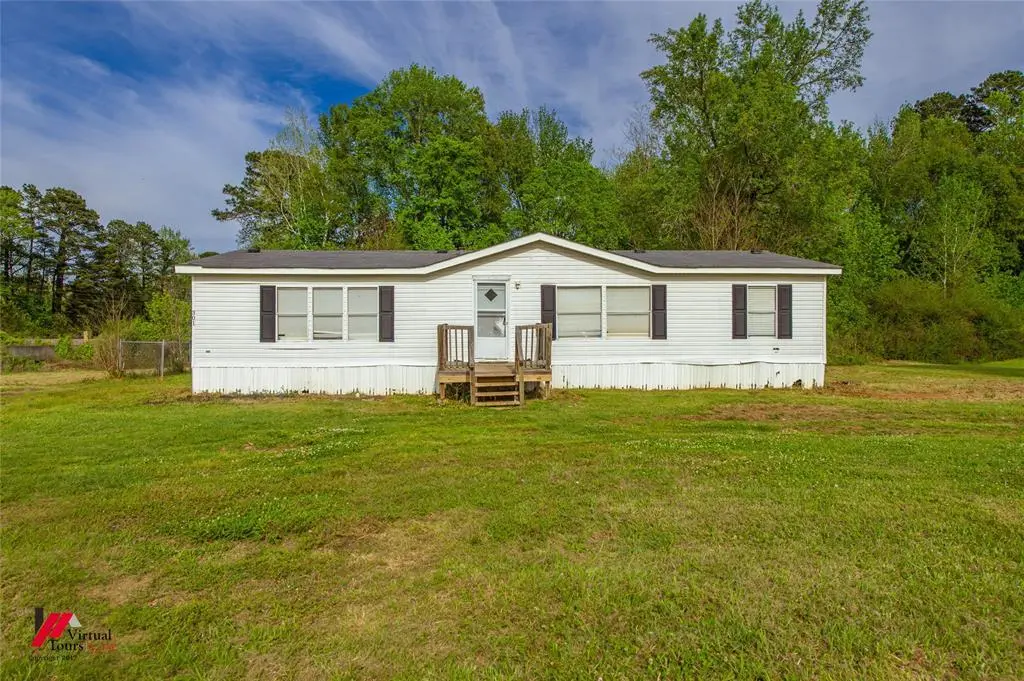
301 Fox Creek Dr · Haughton, LA
Flood risk 4/10 · Minor
- FEMA flood zone
- X (unshaded)
- Chance of flooding over 30 yrs
- 0.21%
- Est. flood insurance / yr
- $507 – $1,088
Fire risk 3/10 · Minor
- Est. fire insurance / yr
- $1,269 – $2,357
Heat risk 7/10 · Major
- Hot days now (above 110°F)
- 7 days/yr
- Hot days in 30 yrs
- 22 days/yr
Wind risk 6/10 · Moderate
- Chance of severe wind over 30 yrs
- 65.0%
Air-quality risk 1/10 · Minimal
- Unhealthy air days now
- 0 days/yr
- Unhealthy air days in 30 yrs
- 0 days/yr
Risk factors via First Street. Map © Google.
Why this score? — see what drove the B- grade
The composite is a weighted blend of 9 inputs, each scored 0–100. Each bar is that input's sub-score; the figure is the points it added to the 100-point composite (weight × sub-score).
- Cash flow +30.0/30.0
- DSCR +10.0/10.0
- 1% rule +9.9/10.0
- ARV discount +7.5/15.0
- Schools +3.8/10.0
- Livability +3.4/5.0
- Rent growth +2.5/5.0
- Condition / age +2.5/5.0
- Appreciation +0.0/10.0
$139,900
🖨 Deal sheet 📄 Offer letter ✓ Due diligence
Listing remarks
Welcome to this well-maintained 3 bedroom, 2 bathroom home situated on a spacious . 66-acre corner lot in a growing and convenient area. This property offers comfort, value, and versatility—ideal for first-time buyers, families, or investors. Inside, you’ll find brand new flooring installed in 2025, giving the home a fresh and updated feel throughout. The kitchen features updated appliances, and the home includes a washer and dryer for added convenience. With central heat and a functional layout, this home is move-in ready! The roof is approximately 8 years old, offering added peace of mind. Utilities include city water, sewer, and garbage service, providing easy and reliable
Key facts
- 0.66 acre lot
- Built 2000
- Listed 3 days
Property features AI
Finance
- Other: Property classified as a manufactured home; County: Bossier; Country: United States; Directions: GPS or Google/Apple Maps
- HOA & community: No homeowner association
Exterior
- Parking: Driveway parking; On-street and on-site parking; Unpaved parking areas; No garage or covered/carport spaces
- Utilities: City water; City sewer; Electricity available; Not in a municipal utility district
- Home design: Manufactured home (residential); One story; Not attached to other properties
- Construction: Built in 2000; Pillar/post/pier foundation
- Exterior features: Lot in Fox Creek Estate subdivision; Lot approximately 0.66 acres; Will not subdivide
Interior
- Kitchen: Dishwasher; Electric cooktop; Electric oven; Microwave; Refrigerator; Kitchen island; Eat-in kitchen; Tile counters
- Bedrooms: 3 bedrooms (all on first level); Primary bedroom with ensuite bath and walk-in closet; Secondary bedroom with walk-in closet
- Flooring: Combination of carpet, laminate, luxury vinyl plank and tile
- Bathrooms: 2 full bathrooms; Primary bathroom with garden tub, separate shower, dual sinks and a drip/dry area; Additional bathroom includes drip/dry area
- Heating & cooling: Central heating
- Interior features: Eat-in kitchen with island and tile counters; High-speed internet available; Kitchen island; Pantry; Built-in cabinets in laundry; 9 total rooms; 1 living area; 1 dining area; One-level layout
- Laundry & utility: Utility room with washer hookup; Washer and dryer included; On-site laundry
Neighborhood map
What this means for you Summary
Snapshot
- This is a 3-bed/2.0-bath manufactured listed at $140k.
Deal economics
- At list price, monthly cash flow is $825 ($10k/yr) — positive.
- The deal already cash-flows at list — no discount required.
- Meets the 1% rule at list price ($2k rent vs $140k).
- Cap rate 13.4% vs local median 5.4% in Haughton — top-decile yield for the area; either an underpriced asset or a hidden risk that comps aren't pricing in. Stress-test before assuming the spread holds.
Location & tenants
- Location reads 67/100 on livability (#105 in LA) — a middle-class / working-renter tenant base. Strengths: crime A+, cost of living A+, housing A+; Watch: employment C-, amenities F, commute F.
- Bossier Parish (urban): math 40% / reading 47% proficiency, ranked #17 of 98 in LA (top 17%) — families likely to look elsewhere, expect single-tenant / working-renter base with shorter leases.
- Market conditions: 333 active listings in the ZIP; 2 comparable units currently listed for rent nearby; solid renter incomes; 716 units permitted in Bossier Parish in 2024 (0 in 5+ unit buildings).
- This rent runs 32% of the median local income ($79k/yr) — at the standard rent-burdened threshold; future hikes will face affordability resistance.
Forward outlook
- Local home prices are declining (-3.0%/yr); year-one equity from $967 of loan paydown is wiped out by about $4k of value loss. Plan a longer hold.
- Bossier County population projected at +28% by 2050 — long-run rental-demand tailwind backs the buy-and-hold thesis.
- At projected returns (-3.0% appreciation + 3.0% rent growth), your $39k cash investment doubles in ~5 years — after that, you're playing with house money.
Negotiation context
- Only 3 days on market — expect competitive offers; lowballing is unlikely to land.
- Current owner paid $75k; list at $140k implies a 87% gain — meaningful room to come down on a strong offer.
Risks & watch-outs
- Climate carrying-cost: major wind risk, 65% chance of damaging wind over 30y; extreme-heat days projected 7→22/yr by 2055 (HVAC capex compounding) — expect insurance premiums to compound above CPI over the hold.
Questions for the listing agent
- Is there a deadline driving the sale (1031 exchange, divorce, estate, relocation)? That informs how much negotiation room exists.
- Schools are B-rated — typically a magnet for longer-tenancy family renters. What's the average tenant stay here, and is there a school-zone premium baked into asking?
- What's the average days-on-market for RENTAL listings here right now (not sales)? A rising rental-DOM trend means longer vacancies and softer asking-rent achievability than the comps imply.
- What's the recent tenant-quality profile in this submarket — average credit score on applications, eviction rate, late-payment / NSF rate, and stable-employment percentage? A property-management company in the area should have these aggregated.
- How much new for-sale + rental construction is in the pipeline within 1–3 miles? Heavy new supply typically softens prices + rents 12–24 months out; constrained supply supports both.
Investment metrics
- 1% rule
- 1.49% ✓
- Cap rate
- 13.37%
- Cash-on-cash
- 25.27%
- DSCR
- 2.12
- GRM
- 5.6
CMA / ARV
- ARV (on-the-fly)
- $139,776
- Comps found
- 1
Show comp detail 1 sale within ~0.75 mi
| Address | Dist | Beds/Ba | Sqft | Sold | Price | $/sf | Match |
|---|---|---|---|---|---|---|---|
| 301 Fox Creek Dr | 0.00mi | 3/2.0 | 1,456 (0%) | 1mo | $139,900 | $96 | 99 |
Match score weights: distance 35% · size 25% · config 20% · recency 20%. Top-matched comps best support the ARV.
Projected returns pro-forma
-3.0% appreciation · 3.0% rent growth · sell at horizon
- IRR
- 18.8%
- Equity multiple
- 1.76×
- Total profit
- $29,816
- Equity at exit
- $20,860
- IRR
- 27.1%
- Equity multiple
- 3.38×
- Total profit
- $93,382
- Equity at exit
- $12,096
Cash invested: $39,172 (down + closing). Projections, not guarantees.
Landlord ↔ Tenant lean methodology
- Overall (STATE)
- 90 Strongly Landlord-Friendly
- State Louisiana
- 90 Strongly Landlord-Friendly · R+12
- County
- — inherits STATE
- City
- — inherits STATE
ZIP-level market 71037
- Home prices YoY
- -27.8%
- Active inventory
- 333
- Price-to-rent
- 5.6×
Monthly cashflow live
- Estimated rent
- $2,081 medium interval (Pro) →
- Mortgage (P&I)
- −$734
- Tax from tax record
- −$27 /mo · $323/yr
- Insurance
- −$58
- HOA
- −$0
- Vacancy / Maint / Mgmt
- −$437
- Net cashflow
- $825
Break-even live
UW: 25.0% down · 7.5% · 30yr · 1.5% tax · 5.0% vac · 8.0% maint · 8.0% mgmt
Financing live
Cash to close
- Down payment
- $34,975
- Closing costs
- $4,197
- Reserves months
- —
- Total cash needed
- —
Loan-product check · same deal, 3 products live
Conventional
25% down · 7.5% · 30yr
- Down + closing
- —
- Monthly P&I
- —
- Monthly cashflow
- —
- DSCR
- —
- Eligible?
- —
Personal DTI + credit; lowest rate.
DSCR
20% down · 8.5% · 30yr
- Down + closing
- —
- Monthly P&I
- —
- Monthly cashflow
- —
- DSCR
- —
- Eligible?
- —
No personal income docs; deal must DSCR.
Hard money
10% down · 12.0% · 12mo
- Down + closing
- —
- Monthly P&I
- —
- Monthly cashflow
- —
- DSCR
- —
- Eligible?
- —
Short-term bridge; refi at stabilization.
Rent comps 2 comps
| Address | Beds | Baths | Sqft | Rent | $/sqft | DOM | Units | Dist |
|---|---|---|---|---|---|---|---|---|
| 190 Berkshire Pl Haughton, LA | 3.0 | 2.0 | 1867 | $2,200 | $1.18 | 13d | 1 | 0.62mi |
| 204 Southern Creek Cir Haughton, LA | 3.0 | 2.0 | 1560 | $2,000 | $1.28 | 13d | 1 | 1.37mi |
Listing history 4 events
-
2026-04-13status Pending
-
2026-04-10$139,900 Active
-
2019-02-06soldstatus $75,000
-
2000-11-27soldstatus $14,400
ⓘ Source: listings_history table (triggers on properties + properties_extension) + one-shot
backfill from property_details.listing_events for pre-trigger history.
Tax reassessment forecast LA · Resets to sale price
- Current annual tax
- $323 · $27/mo
- Projected year-2 tax
- $769 · $64/mo
- Expected delta
- +$447/yr (+$37/mo · 138.3%)
ⓘ Screening estimate from a state-policy table — verify with the county assessor before closing.
Climate risk First Street
- Flood 4/10 Moderate FEMA zone X (unshaded) · 21% chance over 30 yrs
- Wildfire 3/10 Moderate
- Heat 7/10 Severe 7 d/yr ≥110°F today · 22 d/yr by 30 yrs out
- Wind 6/10 Major 65% chance of damaging wind over 30 yrs
- Air quality 1/10 Low 0 unhealthy d/yr today · 0 by 30 yrs out
Nearby sold comps map
Loading sold comps map…
Walkable amenities ~0.75 mi
Loading nearby amenities…
Taxation est. · year 1
- Rental income
- $24,970
- − Mortgage interest
- −$7,837
- − Property taxes
- −$323
- − Insurance
- −$700
- − Repairs & maintenance
- −$1,998
- − Management
- −$1,998
- − Depreciation
- −$4,070
- Taxable income
- $8,046
- Est. tax owed @ 24.0%
- −$1,931
- After-tax cash flow
- $7,969/yr
For passive investors: Depreciation is non-cash, so a rental often shows a tax loss while cash-flowing — sheltering income. Rental losses are passive: they offset passive income freely, and up to $25,000/yr can offset ordinary (W-2) income if you actively participate and your MAGI is under $100k (phasing out to $0 by $150k); unused losses carry forward. On sale, claimed depreciation is recaptured at up to 25%, and gains may owe capital-gains tax (a 1031 exchange can defer both). Figures are a year-1 estimate at your 24.0% rate — not tax advice; consult a CPA.
Schools (NCES district)
- District
- Bossier Parish
- NCES district ID
- 2200270
- Math proficiency
- 40% ▼ -32.00%
- Reading proficiency
- 47% ▼ -28.00%
- Median HH income
- $51,326
- Composite
- 37.5/100
- National rank
- #4402
- State rank
- #17 of 98 in LA
Livability — Haughton
- Score
- 67/100
- State rank
- #105
- US rank
- #10251
Category grades
Schools grade is shown separately in the Schools card above.
Census & demographics
- Census place
- Haughton, LA
- County
- Bossier Parish · 98,704 people
- City population
- 21,192
- Metro
- Shreveport-Bossier City, LA
- Population (ZIP)
- 21,192
- Household income
- $78,571
- Rent vs Own
- Severe rent burden
- 171.0
Population outlook (Bossier County) Hauer SSP2
- Today (2025)
- 143,247 people
- By 2030
- 151,802 · +6.0%
- By 2040
- 168,194 · +17.4%
- By 2050
- 183,533 · +28.1%
- By 2075
- 217,009 · +51.5%
- By 2100
- 230,091 · +60.6%
Race, ethnicity, and origin ACS 2023
- Neighborhood character
- Predominantly White (76%)
- Race & ethnicity
- White 76% Black 15% Hispanic / Latino 6% Two or more races 3%
- Hispanic origin (detail)
- Mexican 4%
- Common ancestry
- Lithuanian 2% Italian 1% Slovak 1%
- Foreign-born
- 3% · Canada
- Languages at home
- 95% English-only · Spanish 4%
Political lean MEDSL · Bossier
- 2024 margin
- Solid R (+43.3) · D 27.7% · R 71.0% · Other 1.3%
- 2008→2024 swing
- +0.3pp no change · 2008: -43.7pp · 2024: -43.3pp
- All cycles
- 2024: R+43.3 2020: R+41.0 2016: R+45.8 2012: R+45.4 2008: R+43.7
Not yet ingested
- Civics
- —
Market trends
- HPI YoY
- ▼ -59.53%
- Current HPI
- 154.5064
- Rent YoY
- —
- Metro
- Shreveport-Bossier City, LA
- State GDP YoY
- ▲ 3.29%
- F500 in state
- 10
Industry mix (Fortune 500 HQ in LA)
| Industry | F500 HQs | Revenue |
|---|---|---|
| Telecommunications | 2 | $23B |
|
||
| Utilities | 1 | $12B |
|
||
| Wholesale / Distribution | 1 | $5B |
|
||
| Advertising | 1 | $2B |
|
||
Price history
+871.5% since first listed4 events — show timeline
- 2026-04-13 Pending — NTREIS
- 2026-04-10 Listed $139,900 NTREIS
- 2019-02-06 Sold (Public Records) $75,000 Public Records
- 2000-11-27 Sold (Public Records) $14,400 Public Records
Property tax history
-3.8%/yrLatest (2025): $323 · +796.9% YoY. Source: county tax records.
Cash-flow waterfall
monthlySold comps — $/sqft
last 12 mo · ≤1 miLoading sold comps…