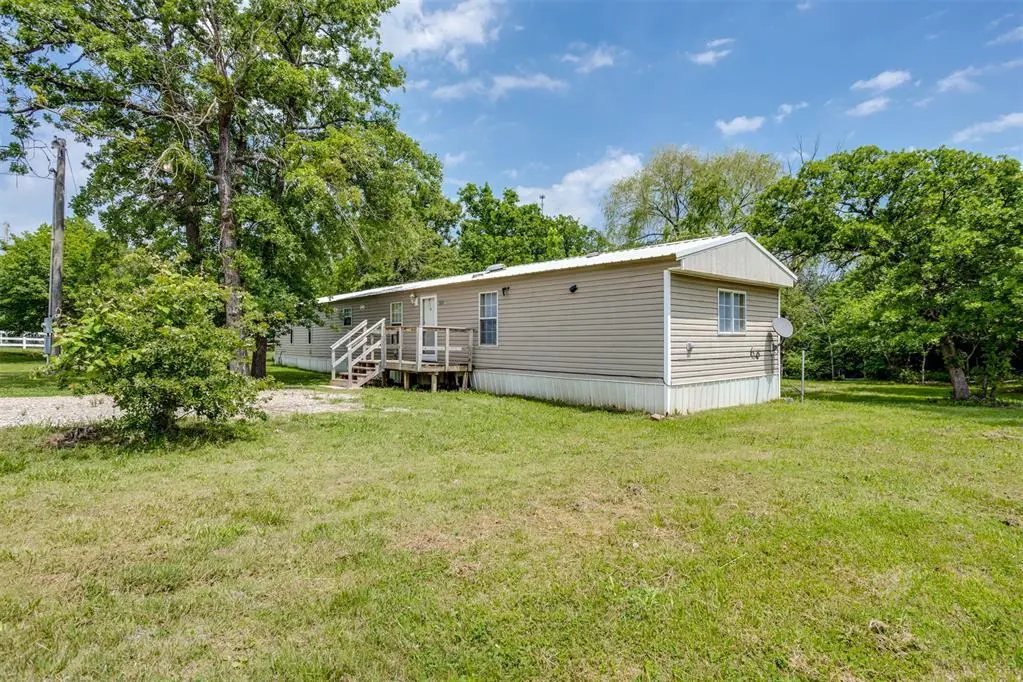
1001 Wildfire Dr · Norman, OK
Flood risk 1/10 · Minimal
- FEMA flood zone
- X (unshaded)
- Chance of flooding over 30 yrs
- 0.0%
- Est. flood insurance / yr
- $507 – $1,088
Fire risk 6/10 · Moderate
- Est. fire insurance / yr
- $2,463 – $4,575
Heat risk 5/10 · Moderate
- Hot days now (above 109°F)
- 7 days/yr
- Hot days in 30 yrs
- 18 days/yr
Wind risk 3/10 · Minor
- Chance of severe wind over 30 yrs
- 6.0%
Air-quality risk 2/10 · Minimal
- Unhealthy air days now
- 1 days/yr
- Unhealthy air days in 30 yrs
- 1 days/yr
Risk factors via First Street. Map © Google.
Why this score? — see what drove the D+ grade
The composite is a weighted blend of 9 inputs, each scored 0–100. Each bar is that input's sub-score; the figure is the points it added to the 100-point composite (weight × sub-score).
- Cash flow +20.7/30.0
- ARV discount +7.5/15.0
- DSCR +6.6/10.0
- Livability +4.2/5.0
- 1% rule +4.1/10.0
- Rent growth +2.5/5.0
- Condition / age +2.5/5.0
- Schools +1.1/10.0
- Appreciation +0.0/10.0
$125,000
🖨 Deal sheet (PDF) 📄 Offer letter ✓ Due diligence
Listing remarks
Located on nearly a full acre in the peaceful countryside just minutes from Thunderbird Lake, this 3-bedroom, 2-bathroom manufactured home offers space, privacy, and plenty of potential. Situated on approximately . 94 acres, this property provides room to garden, entertain, keep pets, or simply enjoy the quiet surroundings and open skies. Whether you're looking for an affordable home, investment opportunity, or a place to make your own, this home combines country charm with everyday convenience. Enjoy the freedom of rural living while still being close to town amenities.
Key facts
- Rural living
- Open skies
- Full acre
Tags
Property features AI
Finance
- Other: Lot is approximately 0.94 acre; Located in Wildfire 1 legal addition; Occupancy: not occupied; Listed as active
- Financial info: Not assumable
- HOA & community: No mandatory association dues
Exterior
- Utilities: No storm shelter
- Home design: Single family residence; One level; Faces west
- Construction: Manufactured / Mobile construction; Metal roof; Built as existing property
- Exterior features: Outbuildings; Rural setting
Interior
- Kitchen: Electric free‑standing range
- Bedrooms: 3 bedrooms
- Bathrooms: 2 full bathrooms
- Heating & cooling: Electric heating
- Interior features: Dishwasher, Microwave, Refrigerator; No fireplace; Conventional foundation
- Laundry & utility: Washer and dryer included
Neighborhood map
What this means for you Summary
Snapshot
- This is a 3-bed/2.0-bath manufactured listed at $125k.
Deal economics
- At list price, monthly cash flow is $168 ($2k/yr) — positive.
- The deal already cash-flows at list — no discount required.
- To meet the 1% rule (rent ≥ 1% of price), the offer needs to be $114k (8.6% below list).
- Recommended offer: $114k (8.6% below list) — sets the bar for 1% rule.
- Cap rate 7.9% vs local median 3.6% in Norman — top-decile yield for the area; either an underpriced asset or a hidden risk that comps aren't pricing in. Stress-test before assuming the spread holds.
Location & tenants
- Location reads 85/100 on livability (#1 in OK, #557 nationally) — a professional / high-income tenant draw. Strengths: amenities A+, commute A+, cost of living A+.
- Little Axe (rural): math 10% / reading 14% proficiency, ranked #236 of 270 in OK (top 87%) — low school quality limits family demand, transient renter base, plan for 1-2y turnover; 63% free/reduced lunch — lower-income household profile, screen leases tightly.
- Zoned schools: Little Axe Es (math 10% / reading 14%, grade F, #667 of 845 statewide, top 82%, 587 students, 0% FRL); Little Axe Ms (math 12% / reading 12%, grade F, #269 of 345 statewide, top 79%, 256 students, 0% FRL); Little Axe Hs (math 8% / reading 22%, grade F, #332 of 447 statewide, top 78%, 331 students, 0% FRL) — zoned schools average 0% FRL vs 63% district-wide (63 pts lower); this property's tenant base skews higher-income than the district average.
- Market conditions: 193 active listings in the ZIP; 592 units permitted in Cleveland County in 2024 (12 in 5+ unit buildings).
Forward outlook
- Local home prices are declining (-3.0%/yr); year-one equity from $864 of loan paydown is wiped out by about $4k of value loss. Plan a longer hold.
- Cleveland County population projected at +40% by 2050 — long-run rental-demand tailwind backs the buy-and-hold thesis.
Negotiation context
- It's been on market 52 days — a 3% lower offer ($121k) is reasonable based on typical stale-listing flexibility.
Risks & watch-outs
- Climate carrying-cost: major wildfire risk; extreme-heat days projected 7→18/yr by 2055 (HVAC capex compounding) — expect insurance premiums to compound above CPI over the hold.
Questions for the listing agent
- It's been on market 52 days. Have you received any prior offers? Is the seller open to a 9% concession, seller financing, or rate buy-down credit?
- Is there a deadline driving the sale (1031 exchange, divorce, estate, relocation)? That informs how much negotiation room exists.
- The area grade is low — what's the realistic commute time and amenity access for the typical tenant pool here? Any planned neighborhood developments (good or bad) we should know about?
- What's the average days-on-market for RENTAL listings here right now (not sales)? A rising rental-DOM trend means longer vacancies and softer asking-rent achievability than the comps imply.
- What's the recent tenant-quality profile in this submarket — average credit score on applications, eviction rate, late-payment / NSF rate, and stable-employment percentage? A property-management company in the area should have these aggregated.
- How much new for-sale + rental construction is in the pipeline within 1–3 miles? Heavy new supply typically softens prices + rents 12–24 months out; constrained supply supports both.
Investment metrics
- 1% rule
- 0.91% ✗
- Cap rate
- 7.91%
- Cash-on-cash
- 5.77%
- DSCR
- 1.26
- GRM
- 9.1
CMA / ARV
No comps found within radius.
Projected returns pro-forma
-3.0% appreciation · 3.0% rent growth · sell at horizon
- IRR
- -7.4%
- Equity multiple
- 0.73×
- Total profit
- $-9,603
- Equity at exit
- $18,638
- IRR
- 2.1%
- Equity multiple
- 1.15×
- Total profit
- $5,181
- Equity at exit
- $10,808
Cash invested: $35,000 (down + closing). Projections, not guarantees.
Landlord ↔ Tenant lean methodology
- Overall (STATE)
- 83 Strongly Landlord-Friendly
- State Oklahoma
- 83 Strongly Landlord-Friendly · R+20
- County
- — inherits STATE
- City
- — inherits STATE
ZIP-level market 73026
- Home prices YoY
- -8.5%
- Active inventory
- 193
- Price-to-rent
- 9.1×
Monthly cashflow live
- Estimated rent
- $1,142 medium interval (Pro) →
- Mortgage (P&I)
- −$656
- Tax from tax record
- −$26 /mo · $317/yr
- Insurance
- −$52
- HOA
- −$0
- Vacancy / Maint / Mgmt
- −$240
- Net cashflow
- $168
Break-even live
Sensitivity live
| Price | -10% $239 | -5% $204 | +0% $168 | +5% $133 | +10% $97 |
|---|---|---|---|---|---|
| Rent | -10% $78 | -5% $123 | +0% $168 | +5% $213 | +10% $258 |
| Rate | -1.0pp $231 | -0.5pp $200 | base $168 | +0.5pp $136 | +1.0pp $103 |
UW: 25.0% down · 7.5% · 30yr · 1.5% tax · 5.0% vac · 8.0% maint · 8.0% mgmt
Financing live
Cash to close
- Down payment
- $31,250
- Closing costs
- $3,750
- Reserves months
- —
- Total cash needed
- —
Loan-product check · same deal, 3 products live
Conventional
25% down · 7.5% · 30yr
- Down + closing
- —
- Monthly P&I
- —
- Monthly cashflow
- —
- DSCR
- —
- Eligible?
- —
Personal DTI + credit; lowest rate.
DSCR
20% down · 8.5% · 30yr
- Down + closing
- —
- Monthly P&I
- —
- Monthly cashflow
- —
- DSCR
- —
- Eligible?
- —
No personal income docs; deal must DSCR.
Hard money
10% down · 12.0% · 12mo
- Down + closing
- —
- Monthly P&I
- —
- Monthly cashflow
- —
- DSCR
- —
- Eligible?
- —
Short-term bridge; refi at stabilization.
Listing history 15 events
-
2026-06-21days on market $125,000 Active 52 DOM
-
2026-06-18days on market $125,000 Active 49 DOM
-
2026-06-17days on market $125,000 Active 48 DOM
-
2026-06-16days on market $125,000 Active 47 DOM
-
2026-06-15days on market $125,000 Active 46 DOM
-
2026-06-13days on market $125,000 Active 44 DOM
-
2026-06-13days on market $125,000 Active 43 DOM
-
2026-06-09days on market $125,000 Active 40 DOM
-
2026-06-08days on market $125,000 Active 39 DOM
-
2026-06-07days on market $125,000 Active 38 DOM
-
2026-06-03days on market $125,000 Active 34 DOM
-
2026-06-02days on market $125,000 Active 33 DOM
-
2026-06-01days on market $125,000 Active 32 DOM
-
2026-05-31days on market $125,000 Active 31 DOM
-
2026-04-30$125,000 Active
ⓘ Source: listings_history table (triggers on properties + properties_extension) + one-shot
backfill from property_details.listing_events for pre-trigger history.
Tax reassessment forecast OK · Resets to sale price
- Current annual tax
- $317 · $26/mo
- Projected year-2 tax
- $1,125 · $94/mo
- Expected delta
- +$808/yr (+$67/mo · 254.9%)
ⓘ Screening estimate from a state-policy table — verify with the county assessor before closing.
Climate risk First Street
- Flood 1/10 Low FEMA zone X (unshaded) · 0% chance over 30 yrs
- Wildfire 6/10 Major
- Heat 5/10 Major 7 d/yr ≥109°F today · 18 d/yr by 30 yrs out
- Wind 3/10 Moderate 6% chance of damaging wind over 30 yrs
- Air quality 2/10 Low 1 unhealthy d/yr today · 1 by 30 yrs out
Nearby sold comps map
Loading sold comps map…
Walkable amenities ~0.75 mi
Loading nearby amenities…
Taxation est. · year 1
- Rental income
- $13,705
- − Mortgage interest
- −$7,002
- − Property taxes
- −$317
- − Insurance
- −$625
- − Repairs & maintenance
- −$1,096
- − Management
- −$1,096
- − Depreciation
- −$3,636
- Taxable loss
- −$68
- Est. tax savings @ 24.0%
- +$16
- After-tax cash flow
- $2,035/yr
For passive investors: Depreciation is non-cash, so a rental often shows a tax loss while cash-flowing — sheltering income. Rental losses are passive: they offset passive income freely, and up to $25,000/yr can offset ordinary (W-2) income if you actively participate and your MAGI is under $100k (phasing out to $0 by $150k); unused losses carry forward. On sale, claimed depreciation is recaptured at up to 25%, and gains may owe capital-gains tax (a 1031 exchange can defer both). Figures are a year-1 estimate at your 24.0% rate — not tax advice; consult a CPA.
Schools (NCES district)
- District
- Little Axe
- NCES district ID
- 4017880
- Math proficiency
- 10% ▼ -17.00%
- Reading proficiency
- 14% ▼ -13.00%
- Median HH income
- $51,174
- Composite
- 11.38/100
- National rank
- #9708
- State rank
- #236 of 270 in OK
Livability — Norman
- Score
- 85/100
- State rank
- #1
- US rank
- #557
Category grades
Schools grade is shown separately in the Schools card above.
Census & demographics
- City population
- 123,141
- Population (ZIP)
- 11,131
Population outlook (Cleveland County) Hauer SSP2
- Today (2025)
- 323,621 people
- By 2030
- 349,070 · +7.9%
- By 2040
- 400,168 · +23.7%
- By 2050
- 454,101 · +40.3%
- By 2075
- 602,926 · +86.3%
- By 2100
- 734,485 · +127.0%
Race, ethnicity, and origin ACS 2023
- Neighborhood character
- Predominantly White (81%)
- Race & ethnicity
- White 81% Two or more races 9% Native American 8% Hispanic / Latino 4%
- Common ancestry
- Portuguese 3% Slovak 3% Lithuanian 2%
- Foreign-born
- 1% · Canada
- Languages at home
- 97% English-only · Spanish 1%
Political lean MEDSL · Cleveland
- 2024 margin
- R (+14.9) · D 41.4% · R 56.4% · Other 2.2%
- 2008→2024 swing
- +9.1pp toward D · 2008: -24.0pp · 2024: -14.9pp
- All cycles
- 2024: R+14.9 2020: R+14.1 2016: R+21.7 2012: R+25.9 2008: R+24.0
Not yet ingested
- Civics
- —
Market trends
- HPI YoY
- ▼ -26.82%
- Current HPI
- 287.5097
- Rent YoY
- —
- Metro
- —
- State GDP YoY
- ▲ 1.55%
- F500 in state
- 6
Industry mix (Fortune 500 HQ in OK)
| Industry | F500 HQs | Revenue |
|---|---|---|
| Energy | 3 | $48B |
|
||
Price history
1 event — show timeline
- 2026-04-30 Listed $125,000 MLSOK
Property tax history
+2.4%/yrLatest (2024): $317 · -3.4% YoY. Source: county tax records.
Cash-flow waterfall
monthlySold comps — $/sqft
last 12 mo · ≤1 miLoading sold comps…