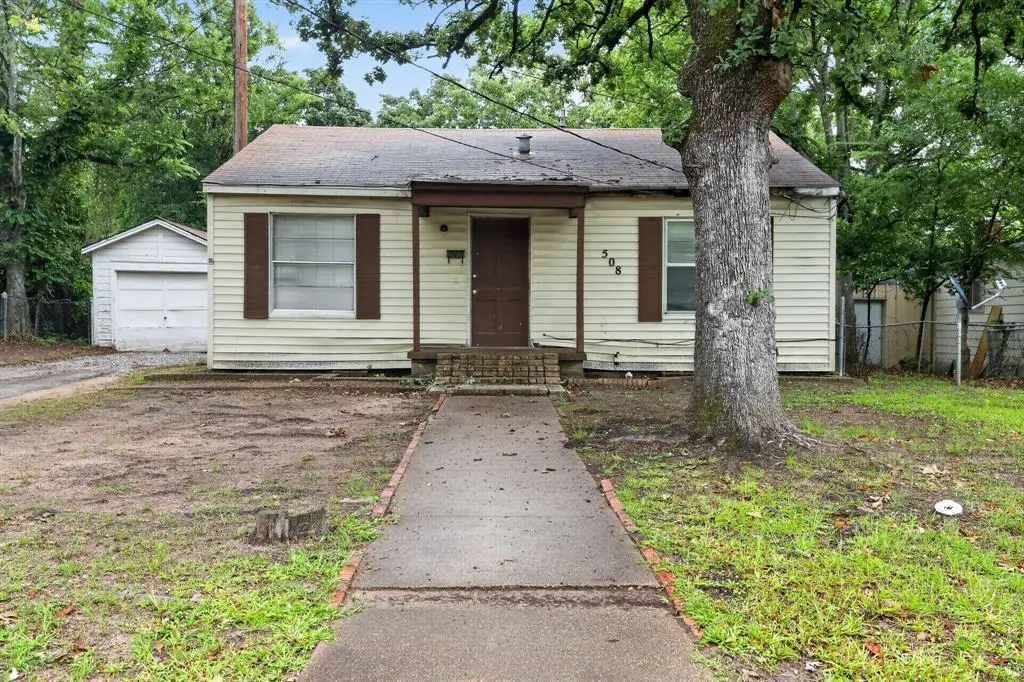
508 Southgate Ave · Tyler, TX
Flood risk 1/10 · Minimal
- FEMA flood zone
- X (unshaded)
- Chance of flooding over 30 yrs
- 0.0%
- Est. flood insurance / yr
- $507 – $1,088
Fire risk 3/10 · Minor
- Est. fire insurance / yr
- $1,222 – $2,270
Heat risk 6/10 · Moderate
- Hot days now (above 109°F)
- 7 days/yr
- Hot days in 30 yrs
- 26 days/yr
Wind risk 6/10 · Moderate
- Chance of severe wind over 30 yrs
- 59.0%
Air-quality risk 2/10 · Minimal
- Unhealthy air days now
- 0 days/yr
- Unhealthy air days in 30 yrs
- 1 days/yr
Risk factors via First Street. Map © Google.
Why this score? — see what drove the B- grade
The composite is a weighted blend of 9 inputs, each scored 0–100. Each bar is that input's sub-score; the figure is the points it added to the 100-point composite (weight × sub-score).
- Cash flow +28.1/30.0
- DSCR +10.0/10.0
- 1% rule +8.3/10.0
- ARV discount +7.5/15.0
- Livability +3.8/5.0
- Schools +3.3/10.0
- Rent growth +3.1/5.0
- Condition / age +2.5/5.0
- Appreciation +0.0/10.0
$79,000
🖨 Deal sheet 📄 Offer letter ✓ Due diligence
Listing remarks
Opportunity awaits in the heart of Tyler with this 1-bath cottage, offering 854 sq ft of living space on a generous 0.21-acre lot. Located just minutes from Downtown Tyler, the Caldwell Zoo, and Tyler Junior College, this property provides a solid foundation for a fix-and-flip, rental, or custom renovation. With its competitive price point and prime location in the 75702 zip code, this home is a blank canvas ready for a creative transformation. Whether you are looking to build your rental portfolio or take on a rewarding restoration project, this property offers significant value-add potential in a well-connected neighborhood.
Key facts
- Tyler junior college
- Generous lot
- Caldwell zoo
Tags
Property features AI
Finance
- Other: Parcel number: 150000074900023000
- Financial info: Treat as clear loan type; No second mortgage
- HOA & community: No homeowners association
Exterior
- Parking: Covered parking (1 space); Driveway and garage present; Garage faces front; 1-car garage
- Utilities: City water; City sewer; Electricity connected; Not in a municipal utility district
- Home design: Single-family residence; One story; Residential property
- Construction: Built in 1949
- Exterior features: Lot in Herndon Hills subdivision; Less than 0.5 acre lot (about 0.211 acres)
Interior
- Kitchen: No appliances included
- Bedrooms: Primary bedroom (1st level) — ~10 x 10
- Bathrooms: 1 full bathroom
- Interior features: Two total rooms; One living area; One dining area; Other interior features
- Laundry & utility: No specific laundry or utility appliances listed
Neighborhood map
What this means for you Summary
Snapshot
- This is a 1-bed/1.0-bath single-family listed at $79k.
Deal economics
- At list price, monthly cash flow is $249 ($3k/yr) — positive.
- The deal already cash-flows at list — no discount required.
- Meets the 1% rule at list price ($1k rent vs $79k).
- Recommended offer: $78k (1.5% below list) — sets the bar for market timing.
- Cap rate 10.1% vs local median 3.6% in Tyler — top-decile yield for the area; either an underpriced asset or a hidden risk that comps aren't pricing in. Stress-test before assuming the spread holds.
Location & tenants
- Location reads 75/100 on livability (#147 in TX, #4,181 nationally) — a middle-class / working-renter tenant base. Strengths: cost of living A+, housing A+, health & safety A+; Watch: employment C-, crime D+, commute F.
- Tyler ISD (urban): math 39% / reading 38% proficiency, ranked #449 of 826 in TX (top 54%) — families likely to look elsewhere, expect single-tenant / working-renter base with shorter leases; 66% free/reduced lunch — lower-income household profile, screen leases tightly.
- Zoned schools: Peete El (math 22% / reading 17%, grade F, #3,583 of 4,322 statewide, top 86%, 414 students, 98% FRL) — zoned schools average 98% FRL vs 66% district-wide (32 pts higher); higher-poverty schools than district average — tighter screening recommended.
- Zoned-school proficiency averages 20% at this address vs 38% district-wide (-19 pts) — the specific schools serving this property underperform the Tyler ISD average; the district grade overstates school quality for this exact location.
- Market conditions: Rents rising (+2.3%/yr); 155 active listings in the ZIP; 14 comparable units currently listed for rent nearby; rentals at typical pace (median 21d on market — plan ~3-4 weeks tenant-placement turnaround); 595 units permitted in Smith County in 2024 (45 in 5+ unit buildings).
Forward outlook
- Local home prices are declining (-3.0%/yr); year-one equity from $546 of loan paydown is wiped out by about $2k of value loss. Plan a longer hold.
- Smith County population projected at +24% by 2050 — long-run rental-demand tailwind backs the buy-and-hold thesis.
- At projected returns (-3.0% appreciation + 2.3% rent growth), your $22k cash investment doubles in ~10 years — after that, you're playing with house money.
Negotiation context
- It's been on market 22 days — a 2% lower offer ($78k) is reasonable based on typical stale-listing flexibility.
Risks & watch-outs
- Watch-outs: built in 1949 — expect roof / HVAC / electrical / plumbing capex.
- Climate carrying-cost: major wind risk, 59% chance of damaging wind over 30y; extreme-heat days projected 7→26/yr by 2055 (HVAC capex compounding) — expect insurance premiums to compound above CPI over the hold.
Questions for the listing agent
- Built in 1949 — when were the roof, HVAC, electrical panel, plumbing, and water heater last replaced?
- Is there a deadline driving the sale (1031 exchange, divorce, estate, relocation)? That informs how much negotiation room exists.
- Schools are D-rated, which usually means shorter tenancies and higher turnover. Who's the typical renter profile here, and what's been the actual vacancy rate?
- Crime grade is D in this area — have there been break-ins, vandalism, or insurance claims at this property in the last 3 years? What carrier currently insures it and at what premium?
- What's the average days-on-market for RENTAL listings here right now (not sales)? A rising rental-DOM trend means longer vacancies and softer asking-rent achievability than the comps imply.
- What's the recent tenant-quality profile in this submarket — average credit score on applications, eviction rate, late-payment / NSF rate, and stable-employment percentage? A property-management company in the area should have these aggregated.
- How much new for-sale + rental construction is in the pipeline within 1–3 miles? Heavy new supply typically softens prices + rents 12–24 months out; constrained supply supports both.
Investment metrics
- 1% rule
- 1.33% ✓
- Cap rate
- 10.07%
- Cash-on-cash
- 13.49%
- DSCR
- 1.60
- GRM
- 6.3
CMA / ARV
No comps found within radius.
Projected returns pro-forma
-3.0% appreciation · 2.27% rent growth · sell at horizon
- IRR
- 2.7%
- Equity multiple
- 1.10×
- Total profit
- $2,313
- Equity at exit
- $11,779
- IRR
- 11.6%
- Equity multiple
- 1.88×
- Total profit
- $19,471
- Equity at exit
- $6,830
Cash invested: $22,120 (down + closing). Projections, not guarantees.
Landlord ↔ Tenant lean methodology
- Overall (STATE)
- 87 Strongly Landlord-Friendly
- State Texas
- 87 Strongly Landlord-Friendly · R+5
- County
- — inherits STATE
- City
- — inherits STATE
ZIP-level market 75702
- Home prices YoY
- -5.8%
- Rents YoY
- 2.3%
- Active inventory
- 155
- Price-to-rent
- 6.3×
Monthly cashflow live
- Estimated rent
- $1,048 high interval (Pro) →
- Mortgage (P&I)
- −$414
- Tax from tax record
- −$132 /mo · $1,583/yr
- Insurance
- −$33
- HOA
- −$0
- Vacancy / Maint / Mgmt
- −$220
- Net cashflow
- $249
Break-even live
UW: 25.0% down · 7.5% · 30yr · 1.5% tax · 5.0% vac · 8.0% maint · 8.0% mgmt
Financing live
Cash to close
- Down payment
- $19,750
- Closing costs
- $2,370
- Reserves months
- —
- Total cash needed
- —
Loan-product check · same deal, 3 products live
Conventional
25% down · 7.5% · 30yr
- Down + closing
- —
- Monthly P&I
- —
- Monthly cashflow
- —
- DSCR
- —
- Eligible?
- —
Personal DTI + credit; lowest rate.
DSCR
20% down · 8.5% · 30yr
- Down + closing
- —
- Monthly P&I
- —
- Monthly cashflow
- —
- DSCR
- —
- Eligible?
- —
No personal income docs; deal must DSCR.
Hard money
10% down · 12.0% · 12mo
- Down + closing
- —
- Monthly P&I
- —
- Monthly cashflow
- —
- DSCR
- —
- Eligible?
- —
Short-term bridge; refi at stabilization.
Rent comps 14 comps
| Address | Beds | Baths | Sqft | Rent | $/sqft | DOM | Units | Dist |
|---|---|---|---|---|---|---|---|---|
| 2813 W Shaw St Tyler, TX | 1.0 | 2.0 | 895 | $1,200 | $1.34 | 13d | 1 | 0.56mi |
| 2815 W Shaw St Unit 2 Tyler, TX | 2.0 | 1.0 | 875 | $1,200 | $1.37 | 43d | 1 | 0.56mi |
| 2803 W Shaw St Tyler, TX | 2.0 | 1.0 | 900 | $1,050 | $1.17 | 21d | 1 | 0.57mi |
| 2717 W Shaw St Tyler, TX | 2.0 | 1.0 | 985 | $1,200 | $1.22 | 21d | 1 | 0.57mi |
| 310 S Boon Ave Tyler, TX | 2.0 | 1.0 | 819 | $1,200 | $1.47 | 43d | 1 | 0.63mi |
| 1822 W Oakwood St Tyler, TX | 2.0 | 1.0 | 900 | $1,100 | $1.22 | 43d | 1 | 0.97mi |
| 1806 W Oakwood St Tyler, TX | 2.0 | 1.0 | 900 | $975 | $1.08 | 21d | 1 | 1.00mi |
| 1800 W Oakwood St Tyler, TX | 2.0 | 1.0 | 900 | $975 | $1.08 | 21d | 1 | 1.01mi |
| 1523 W 2nd St Tyler, TX | 2.0 | 1.0 | 810 | $750 | $0.93 | 13d | 1 | 1.15mi |
| 210 N Ross Ave Tyler, TX | 2.0 | 1.0 | 850 | $695 | $0.82 | 21d | 1 | 1.24mi |
| 1216 S Glenwood Blvd Tyler, TX | 2.0 | 1.0 | 808 | $1,200 | $1.49 | 13d | 1 | 1.37mi |
| 1011 W 2nd St Tyler, TX | 2.0 | 1.0 | 840 | $895 | $1.07 | 43d | 1 | 1.45mi |
| 710 S Kennedy Ave Unit 710-13 Tyler, TX | 1.0 | 1.0 | 577 | $895 | $1.55 | 13d | 1 | 1.50mi |
| 710 S Kennedy Ave Unit 710-15 Tyler, TX | 1.0 | 1.0 | 577 | $895 | $1.55 | 43d | 1 | 1.50mi |
Listing history 20 events
-
2026-06-19days on market $79,000 Active 22 DOM
-
2026-06-18days on market $79,000 Active 21 DOM
-
2026-06-17days on market $79,000 Active 20 DOM
-
2026-06-16days on market $79,000 Active 19 DOM
-
2026-06-15days on market $79,000 Active 18 DOM
-
2026-06-14days on market $79,000 Active 16 DOM
-
2026-06-13pricedays on market $79,000 Active 15 DOM
-
2026-06-10days on market $89,000 Active 13 DOM
-
2026-06-09days on market $89,000 Active 12 DOM
-
2026-06-08days on market $89,000 Active 11 DOM
-
2026-06-07days on market $89,000 Active 10 DOM
-
2026-06-05days on market $89,000 Active 7 DOM
-
2026-06-03price $89,000 Active 5 DOM
-
2026-06-02days on market $99,000 Active 5 DOM
-
2026-06-01days on market $99,000 Active 4 DOM
-
2026-05-31days on market $99,000 Active 3 DOM
-
2026-05-30days on market $99,000 Active 2 DOM
-
2026-05-28$99,000 Active
-
2007-08-30soldstatus
-
1997-12-18soldstatus
ⓘ Source: listings_history table (triggers on properties + properties_extension) + one-shot
backfill from property_details.listing_events for pre-trigger history.
Tax reassessment forecast TX · Resets to sale price
- Current annual tax
- $1,583 · $132/mo
- Projected year-2 tax
- $1,583 · $132/mo
- Expected delta
- $0/yr ($0/mo · 0.0%)
ⓘ Screening estimate from a state-policy table — verify with the county assessor before closing.
Climate risk First Street
- Flood 1/10 Low FEMA zone X (unshaded) · 0% chance over 30 yrs
- Wildfire 3/10 Moderate
- Heat 6/10 Major 7 d/yr ≥109°F today · 26 d/yr by 30 yrs out
- Wind 6/10 Major 59% chance of damaging wind over 30 yrs
- Air quality 2/10 Low 0 unhealthy d/yr today · 1 by 30 yrs out
Nearby sold comps map
Loading sold comps map…
Walkable amenities ~0.75 mi
Loading nearby amenities…
Taxation est. · year 1
- Rental income
- $12,576
- − Mortgage interest
- −$4,425
- − Property taxes
- −$1,583
- − Insurance
- −$395
- − Repairs & maintenance
- −$1,006
- − Management
- −$1,006
- − Depreciation
- −$2,298
- Taxable income
- $1,862
- Est. tax owed @ 24.0%
- −$447
- After-tax cash flow
- $2,538/yr
For passive investors: Depreciation is non-cash, so a rental often shows a tax loss while cash-flowing — sheltering income. Rental losses are passive: they offset passive income freely, and up to $25,000/yr can offset ordinary (W-2) income if you actively participate and your MAGI is under $100k (phasing out to $0 by $150k); unused losses carry forward. On sale, claimed depreciation is recaptured at up to 25%, and gains may owe capital-gains tax (a 1031 exchange can defer both). Figures are a year-1 estimate at your 24.0% rate — not tax advice; consult a CPA.
Schools (NCES district)
- District
- Tyler ISD
- NCES district ID
- 4843470
- Math proficiency
- 39% ▼ -4.00%
- Reading proficiency
- 38% ▼ -1.00%
- Median HH income
- $44,090
- Composite
- 32.69/100
- National rank
- #5650
- State rank
- #449 of 826 in TX
Livability — Tyler
- Score
- 75/100
- State rank
- #147
- US rank
- #4181
Category grades
Schools grade is shown separately in the Schools card above.
Census & demographics
- Census place
- Tyler, TX
- County
- Smith County · 180,570 people
- City population
- 127,842
- Metro
- Tyler, TX
- Population (ZIP)
- 27,927
- Household income
- $51,564
- Rent vs Own
- Severe rent burden
- 803.0
Population outlook (Smith County) Hauer SSP2
- Today (2025)
- 248,890 people
- By 2030
- 261,665 · +5.1%
- By 2040
- 286,114 · +15.0%
- By 2050
- 308,006 · +23.8%
- By 2075
- 354,171 · +42.3%
- By 2100
- 372,828 · +49.8%
Race, ethnicity, and origin ACS 2023
- Neighborhood character
- Diverse neighborhood (Simpson 0.61)
- Race & ethnicity
- Hispanic / Latino 49% Black 37% White 12% Two or more races 11% Native American 1%
- Hispanic origin (detail)
- Mexican 47%
- Common ancestry
- Lithuanian 1%
- Foreign-born
- 20% · Canada
- Languages at home
- 56% English-only · Spanish 44%
Political lean MEDSL · Smith
- 2024 margin
- Solid R (+45.1) · D 27.0% · R 72.1%
- 2008→2024 swing
- -5.6pp toward R · 2008: -39.5pp · 2024: -45.1pp
- All cycles
- 2024: R+45.1 2020: R+39.4 2016: R+43.9 2012: R+46.9 2008: R+39.5
Not yet ingested
- Civics
- —
Market trends
- HPI YoY
- ▼ -12.63%
- Current HPI
- 207.1573
- Rent YoY
- ▲ 2.27%
- Metro
- Tyler, TX
- State GDP YoY
- ▲ 3.95%
- F500 in state
- 110
Industry mix (Fortune 500 HQ in TX)
| Industry | F500 HQs | Revenue |
|---|---|---|
| Energy | 16 | $1,198B |
|
||
| Technology | 5 | $198B |
|
||
| Engineering / Construction | 4 | $72B |
|
||
| Energy Services | 3 | $60B |
|
||
| Utilities | 3 | $41B |
|
||
| Healthcare | 2 | $330B |
|
||
Price history
3 events — show timeline
- 2026-05-28 Listed $99,000 NTREIS
- 2007-08-30 Sold (Public Records) — Public Records
- 1997-12-18 Sold (Public Records) — Public Records
Property tax history
+6.6%/yrLatest (2024): $1,583 · +17.1% YoY. Source: county tax records.
Cash-flow waterfall
monthlySold comps — $/sqft
last 12 mo · ≤1 miLoading sold comps…