1414 Shelby Dr · Clarksdale, MS
Flood risk 1/10 · Minimal
- FEMA flood zone
- X (unshaded)
- Chance of flooding over 30 yrs
- 0.0%
- Est. flood insurance / yr
- $507 – $1,088
Fire risk 1/10 · Minimal
- Est. fire insurance / yr
- $1,241 – $2,305
Heat risk 6/10 · Moderate
- Hot days now (above 109°F)
- 7 days/yr
- Hot days in 30 yrs
- 20 days/yr
Wind risk 5/10 · Moderate
- Chance of severe wind over 30 yrs
- 26.0%
Air-quality risk 1/10 · Minimal
- Unhealthy air days now
- 0 days/yr
- Unhealthy air days in 30 yrs
- 0 days/yr
Risk factors via First Street. Map © Google.
Why this score? — see what drove the D grade
The composite is a weighted blend of 9 inputs, each scored 0–100. Each bar is that input's sub-score; the figure is the points it added to the 100-point composite (weight × sub-score).
- Cash flow +17.3/30.0
- Appreciation +6.9/10.0
- DSCR +5.4/10.0
- 1% rule +4.2/10.0
- Livability +3.1/5.0
- Rent growth +2.5/5.0
- Condition / age +2.5/5.0
- Schools +0.7/10.0
- ARV discount +0.0/15.0
$125,000
🖨 Deal sheet (PDF) 📄 Offer letter ✓ Due diligence
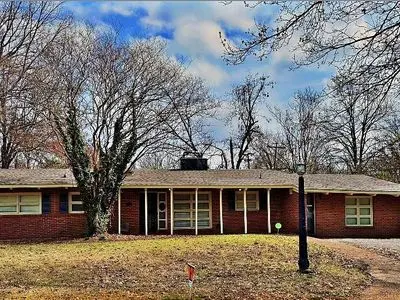
Listing remarks
Brick home for sale at 1414 Shelby Drive in Clarksdale, Coahoma County. This property has three bedrooms, two bathrooms, and 1,645 sq. ft. of heated and cooled living space. The cozy living room features a wood-burning fireplace, built-in cabinets, and abundant natural light from several windows. The home has hardwood and tile flooring throughout, complemented by wood-beamed ceilings. The backyard is fenced with a wooden fence and includes a storage shed and a covered patio. Located on a quiet dead-end street, this home would be perfect for renters or first-time buyers.
Key facts
- Hardwood flooring
- Natural light
- Wood beamed ceilings
Tags
Neighborhood map
What this means for you Summary
Snapshot
- This is a 3-bed/2.0-bath single-family listed at $125k.
Deal economics
- At list price, monthly cash flow is $92 ($1k/yr) — positive.
- The deal already cash-flows at list — no discount required.
- To meet the 1% rule (rent ≥ 1% of price), the offer needs to be $115k (8.0% below list).
- Recommended offer: $115k (8.0% below list) — sets the bar for 1% rule.
Location & tenants
- Location reads 61/100 on livability (#188 in MS) — a middle-class / working-renter tenant base. Strengths: cost of living A+, housing A+; Watch: amenities F, commute F, employment F.
- Clarksdale Municipal School District (town): math 7% / reading 12% proficiency, ranked #121 of 130 in MS (top 93%) — low school quality limits family demand, transient renter base, plan for 1-2y turnover; 94% free/reduced lunch — lower-income household profile, screen leases tightly.
- Zoned schools: Oakhurst Intermediate Academy (math 4% / reading 12%, grade F, #165 of 179 statewide, top 93%, 306 students, 100% FRL); Clarksdale High School (math 2% / reading 17%, grade F, #170 of 197 statewide, top 90%, 466 students, 100% FRL).
- Market conditions: 53 active listings in the ZIP; 1 comparable units currently listed for rent nearby; 26 units permitted in Coahoma County in 2024 (0 in 5+ unit buildings).
Forward outlook
- In year one you build about $6k of equity ($864 loan paydown + $5k appreciation (3.7% local appreciation)).
- Coahoma County population projected at -36% by 2050 — secular population decline; favor cash flow + early exit over multi-decade hold.
- At projected returns (3.7% appreciation + 3.0% rent growth), your $35k cash investment doubles in ~5 years — after that, you're playing with house money.
- By year 7, paydown + projected appreciation supports a ~$35k cash-out refi (75% LTV) — recoverable capital for the next deal without selling this one.
Negotiation context
- Only 11 days on market — expect competitive offers; lowballing is unlikely to land.
Risks & watch-outs
- Watch-outs: built in 1954 — expect roof / HVAC / electrical / plumbing capex.
- Climate carrying-cost: moderate wind risk, 26% chance of damaging wind over 30y; extreme-heat days projected 7→20/yr by 2055 (HVAC capex compounding) — expect insurance premiums to compound above CPI over the hold.
Questions for the listing agent
- Built in 1954 — when were the roof, HVAC, electrical panel, plumbing, and water heater last replaced?
- Is there a deadline driving the sale (1031 exchange, divorce, estate, relocation)? That informs how much negotiation room exists.
- Schools are F-rated, which usually means shorter tenancies and higher turnover. Who's the typical renter profile here, and what's been the actual vacancy rate?
- The area grade is low — what's the realistic commute time and amenity access for the typical tenant pool here? Any planned neighborhood developments (good or bad) we should know about?
- What's the average days-on-market for RENTAL listings here right now (not sales)? A rising rental-DOM trend means longer vacancies and softer asking-rent achievability than the comps imply.
- What's the recent tenant-quality profile in this submarket — average credit score on applications, eviction rate, late-payment / NSF rate, and stable-employment percentage? A property-management company in the area should have these aggregated.
- How much new for-sale + rental construction is in the pipeline within 1–3 miles? Heavy new supply typically softens prices + rents 12–24 months out; constrained supply supports both.
Investment metrics
- 1% rule
- 0.92% ✗
- Cap rate
- 7.18%
- Cash-on-cash
- 3.15%
- DSCR
- 1.14
- GRM
- 9.1
CMA / ARV
- ARV (on-the-fly)
- $101,990
- Comps found
- 12
Show comp detail 12 sales within ~0.75 mi
| Address | Dist | Beds/Ba | Sqft | Sold | Price | $/sf | Match |
|---|---|---|---|---|---|---|---|
| 1120 Rose Cir | 0.26mi | 3/1.5 | 1,700 (+3%) | 3mo | $100,000 | $59 | 78 |
| 1312 King St | 0.21mi | 3/2.0 | 1,584 (-4%) | 10mo | $102,000 | $64 | 76 |
| 1303 Park Ln | 0.24mi | 4/2.0 (+1) | 1,544 (-6%) | 2mo | $149,000 | $97 | 72 |
| 839 W 2nd St | 0.31mi | 3/2.0 | 1,705 (+4%) | 13mo | $109,900 | $64 | 69 |
| 1212 Park Center Dr | 0.21mi | 3/1.5 | 1,452 (-12%) | 1mo | $68,000 | $47 | 68 |
| 1304 Buena Vista St | 0.41mi | 3/1.5 | 1,549 (-6%) | 4mo | $32,500 | $21 | 66 |
| 901 Westhaven Cir | 0.53mi | 3/1.5 | 1,709 (+4%) | 6mo | $108,000 | $63 | 62 |
| 618 Catalpa St | 0.54mi | 4/3.0 (+1) | 1,618 (-2%) | 5mo | $159,000 | $98 | 59 |
| 711 Catalpa St | 0.44mi | 3/2.0 | 1,444 (-12%) | 2mo | $47,500 | $33 | 58 |
| 945 School St | 0.34mi | 4/2.0 (+1) | 1,792 (+9%) | 13mo | $17,500 | $10 | 53 |
| 1576 Wisteria St | 0.48mi | 3/2.0 | 1,438 (-13%) | 8mo | $89,000 | $62 | 50 |
| 629 Catalpa St | 0.50mi | 2/1.0 (-1) | 1,557 (-5%) | 13mo | $45,000 | $29 | 47 |
Match score weights: distance 35% · size 25% · config 20% · recency 20%. Top-matched comps best support the ARV.
Projected returns pro-forma
3.73% appreciation · 3.0% rent growth · sell at horizon
- IRR
- 12.4%
- Equity multiple
- 1.74×
- Total profit
- $25,803
- Equity at exit
- $61,420
- IRR
- 14.0%
- Equity multiple
- 3.22×
- Total profit
- $77,773
- Equity at exit
- $98,928
Cash invested: $35,000 (down + closing). Projections, not guarantees.
Landlord ↔ Tenant lean methodology
- Overall (STATE)
- 90 Strongly Landlord-Friendly
- State Mississippi
- 90 Strongly Landlord-Friendly · R+11
- County
- — inherits STATE
- City
- — inherits STATE
ZIP-level market 38614
- Home prices YoY
- 3.1%
- Active inventory
- 53
- Price-to-rent
- 9.1×
Monthly cashflow live
- Estimated rent
- $1,150 medium interval (Pro) →
- Mortgage (P&I)
- −$656
- Tax from tax record
- −$109 /mo · $1,308/yr
- Insurance
- −$52
- HOA
- −$0
- Vacancy / Maint / Mgmt
- −$242
- Net cashflow
- $92
Break-even live
Sensitivity live
| Price | -10% $163 | -5% $127 | +0% $92 | +5% $57 | +10% $21 |
|---|---|---|---|---|---|
| Rent | -10% $1 | -5% $46 | +0% $92 | +5% $137 | +10% $183 |
| Rate | -1.0pp $155 | -0.5pp $124 | base $92 | +0.5pp $60 | +1.0pp $27 |
UW: 25.0% down · 7.5% · 30yr · 1.5% tax · 5.0% vac · 8.0% maint · 8.0% mgmt
Financing live
Cash to close
- Down payment
- $31,250
- Closing costs
- $3,750
- Reserves months
- —
- Total cash needed
- —
Loan-product check · same deal, 3 products live
Conventional
25% down · 7.5% · 30yr
- Down + closing
- —
- Monthly P&I
- —
- Monthly cashflow
- —
- DSCR
- —
- Eligible?
- —
Personal DTI + credit; lowest rate.
DSCR
20% down · 8.5% · 30yr
- Down + closing
- —
- Monthly P&I
- —
- Monthly cashflow
- —
- DSCR
- —
- Eligible?
- —
No personal income docs; deal must DSCR.
Hard money
10% down · 12.0% · 12mo
- Down + closing
- —
- Monthly P&I
- —
- Monthly cashflow
- —
- DSCR
- —
- Eligible?
- —
Short-term bridge; refi at stabilization.
Rent comps 1 comps
| Address | Beds | Baths | Sqft | Rent | $/sqft | DOM | Units | Dist |
|---|---|---|---|---|---|---|---|---|
| 807 Cuyahoga St Clarksdale, MS | 2.0 | 2.0 | 1600 | $1,150 | $0.72 | 46d | 1 | 1.09mi |
Listing history 19 events
-
2026-06-21days on market $125,000 Active 11 DOM
-
2026-06-21days on market $125,000 Active 10 DOM
-
2026-06-18days on market $125,000 Active 8 DOM
-
2026-06-17days on market $125,000 Active 7 DOM
-
2026-06-16days on market $125,000 Active 6 DOM
-
2026-06-15days on market $125,000 Active 5 DOM
-
2026-06-13days on market $125,000 Active 3 DOM
-
2026-06-12remarks 576-char remark
-
2026-06-12pricedays on market $125,000 Active 2 DOM
-
2026-06-09days on market $130,000 Active 14 DOM
-
2026-06-08days on market $130,000 Active 13 DOM
-
2026-06-07days on market $130,000 Active 12 DOM
-
2026-06-07days on market $130,000 Active 11 DOM
-
2026-06-04days on market $130,000 Active 8 DOM
-
2026-06-02days on market $130,000 Active 7 DOM
-
2026-06-01days on market $130,000 Active 6 DOM
-
2026-05-31days on market $130,000 Active 5 DOM
-
2026-05-26$130,000 Active
-
2005-09-02soldstatus
ⓘ Source: listings_history table (triggers on properties + properties_extension) + one-shot
backfill from property_details.listing_events for pre-trigger history.
Tax reassessment forecast MS · Resets to sale price
- Current annual tax
- $1,308 · $109/mo
- Projected year-2 tax
- $1,308 · $109/mo
- Expected delta
- $0/yr ($0/mo · 0.0%)
ⓘ Screening estimate from a state-policy table — verify with the county assessor before closing.
Climate risk First Street
- Flood 1/10 Low FEMA zone X (unshaded) · 0% chance over 30 yrs
- Wildfire 1/10 Low
- Heat 6/10 Major 7 d/yr ≥109°F today · 20 d/yr by 30 yrs out
- Wind 5/10 Major 26% chance of damaging wind over 30 yrs
- Air quality 1/10 Low 0 unhealthy d/yr today · 0 by 30 yrs out
Nearby sold comps map
Loading sold comps map…
Walkable amenities ~0.75 mi
Loading nearby amenities…
Taxation est. · year 1
- Rental income
- $13,800
- − Mortgage interest
- −$7,002
- − Property taxes
- −$1,308
- − Insurance
- −$625
- − Repairs & maintenance
- −$1,104
- − Management
- −$1,104
- − Depreciation
- −$3,636
- Taxable loss
- −$979
- Est. tax savings @ 24.0%
- +$235
- After-tax cash flow
- $1,338/yr
For passive investors: Depreciation is non-cash, so a rental often shows a tax loss while cash-flowing — sheltering income. Rental losses are passive: they offset passive income freely, and up to $25,000/yr can offset ordinary (W-2) income if you actively participate and your MAGI is under $100k (phasing out to $0 by $150k); unused losses carry forward. On sale, claimed depreciation is recaptured at up to 25%, and gains may owe capital-gains tax (a 1031 exchange can defer both). Figures are a year-1 estimate at your 24.0% rate — not tax advice; consult a CPA.
Schools (NCES district)
- District
- Clarksdale Municipal School District
- NCES district ID
- 2801050
- Math proficiency
- 7% ▼ -12.00%
- Reading proficiency
- 12% ▼ -6.00%
- Median HH income
- $27,495
- Composite
- 7.04/100
- National rank
- #9969
- State rank
- #121 of 130 in MS
Livability — Clarksdale
- Score
- 61/100
- State rank
- #188
- US rank
- #17376
Category grades
Schools grade is shown separately in the Schools card above.
Census & demographics
- Census place
- Clarksdale, MS
- Population (ZIP)
- 16,384
Population outlook (Coahoma County) Hauer SSP2
- Today (2025)
- 21,158 people
- By 2030
- 19,442 · -8.1%
- By 2040
- 16,248 · -23.2%
- By 2050
- 13,486 · -36.3%
- By 2075
- 8,777 · -58.5%
- By 2100
- 6,568 · -69.0%
Race, ethnicity, and origin ACS 2023
- Neighborhood character
- Predominantly Black (77%)
- Race & ethnicity
- Black 77% White 18% Two or more races 4% Hispanic / Latino 3%
- Common ancestry
- Slovak 1%
- Foreign-born
- 2% · Canada
- Languages at home
- 98% English-only · Spanish 2%
Political lean MEDSL · Coahoma
- 2024 margin
- Solid D (+39.8) · D 69.4% · R 29.6% · Other 1.1%
- 2008→2024 swing
- -4.5pp toward R · 2008: 44.3pp · 2024: 39.8pp
- All cycles
- 2024: D+39.8 2020: D+42.9 2016: D+44.4 2012: D+50.3 2008: D+44.3
Not yet ingested
- Civics
- —
Market trends
- HPI YoY
- ▲ 3.73%
- Current HPI
- 125.1302
- Rent YoY
- —
- Metro
- —
- State GDP YoY
- —
- F500 in state
- 0
Price history
2 events — show timeline
- 2026-05-26 Listed $130,000 FSBO.com
- 2005-09-02 Sold (Public Records) — Public Records
Property tax history
+0.4%/yrLatest (2025): $1,308 · +5.2% YoY. Source: county tax records.
Cash-flow waterfall
monthlySold comps — $/sqft
last 12 mo · ≤1 miLoading sold comps…