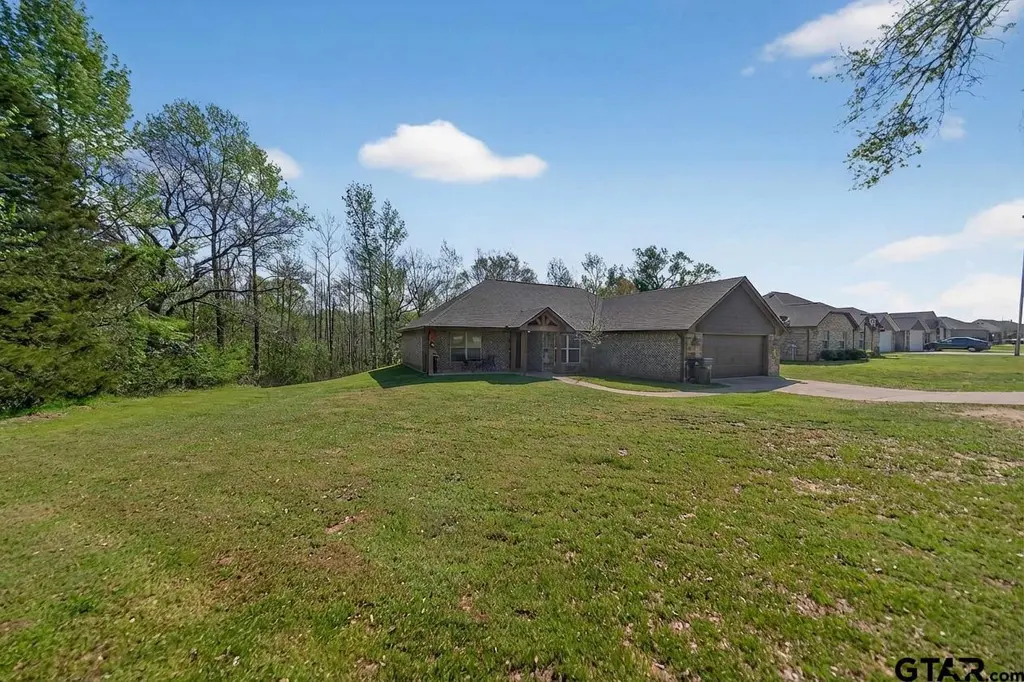
14618 County Road 463 · Lindale, TX
Flood risk 1/10 · Minimal
- FEMA flood zone
- X (unshaded)
- Chance of flooding over 30 yrs
- 0.0%
- Est. flood insurance / yr
- $507 – $1,088
Fire risk 3/10 · Minor
- Est. fire insurance / yr
- $1,222 – $2,270
Heat risk 6/10 · Moderate
- Hot days now (above 110°F)
- 7 days/yr
- Hot days in 30 yrs
- 25 days/yr
Wind risk 6/10 · Moderate
- Chance of severe wind over 30 yrs
- 53.0%
Air-quality risk 2/10 · Minimal
- Unhealthy air days now
- 0 days/yr
- Unhealthy air days in 30 yrs
- 1 days/yr
Risk factors via First Street. Map © Google.
Why this score? — see what drove the D- grade
The composite is a weighted blend of 9 inputs, each scored 0–100. Each bar is that input's sub-score; the figure is the points it added to the 100-point composite (weight × sub-score).
- ARV discount +14.6/15.0
- Cash flow +6.3/30.0
- Schools +5.9/10.0
- Livability +4.0/5.0
- Rent growth +2.5/5.0
- Condition / age +2.5/5.0
- 1% rule +1.5/10.0
- DSCR +0.6/10.0
- Appreciation +0.0/10.0
$275,000
🖨 Deal sheet (PDF) 📄 Offer letter ✓ Due diligence
Listing remarks MLS
Beautiful 3 bedroom, 2 bath, 2 car garage home located in highly sought after Lindale ISD. Situated on a spacious half-acre lot, this home features an open-concept layout with granite countertops, custom knotty alder cabinetry, breakfast bar, and stainless steel appliances. Enjoy a split floor plan with a large primary suite and walk-in closet. The separate but open dining area is perfect for entertaining. The outdoor space is a blank slate and just waiting on you to create your own oasis. Don’t miss this one!
Key facts
- 0.5 acre lot
- 2 garage spots
- Built 2016
Neighborhood map
What this means for you Summary
Snapshot
- This is a 3-bed/2.0-bath single-family listed at $275k.
Deal economics
- At list price, monthly cash flow is $-489 ($-6k/yr) — negative.
- To cash-flow at today's rent, offer at most $204k (25.7% below list).
- To meet the 1% rule (rent ≥ 1% of price), the offer needs to be $179k (35.0% below list).
- Recommended offer: $179k (35.0% below list) — sets the bar for 1% rule.
- Cap rate 4.2% vs local median 3.3% in Lindale — meaningfully above typical; check what's discounted (condition, days-on-market, listing class) to confirm the premium yield is real.
Location & tenants
- Location reads 79/100 on livability (#52 in TX, #2,100 nationally) — a middle-class / working-renter tenant base. Strengths: employment A+, cost of living A+, housing A+; Watch: amenities F, commute F.
- Lindale ISD (town): math 71% / reading 66% proficiency, ranked #20 of 826 in TX (top 2%) — acceptable for families but not a draw, mixed tenant base, ~2y average lease.
- Zoned schools: Velma Penny El (math 67% / reading 67%, grade B+, #199 of 4,322 statewide, top 5%, 541 students, 48% FRL); E J Moss Int (math 66% / reading 59%, grade B+, #128 of 1,662 statewide, top 8%, 981 students, 45% FRL); Lindale H S (math 79% / reading 75%, grade A-, #60 of 1,632 statewide, top 4%, 1,265 students, 38% FRL).
- Market conditions: 640 active listings in the ZIP; 1 comparable units currently listed for rent nearby; solid renter incomes; 595 units permitted in Smith County in 2024 (45 in 5+ unit buildings).
Forward outlook
- Local home prices are declining (-3.0%/yr); year-one equity from $2k of loan paydown is wiped out by about $8k of value loss. Plan a longer hold.
- Smith County population projected at +24% by 2050 — long-run rental-demand tailwind backs the buy-and-hold thesis.
Negotiation context
- It's been on market 87 days — a 6% lower offer ($258k) is reasonable based on typical stale-listing flexibility.
- 3 sale attempts since 10y ago; this cycle's ask has dropped $20k (7%) from the opening price — seller is motivated, your offer sets the floor, not the list.
Risks & watch-outs
- Climate carrying-cost: major wind risk, 53% chance of damaging wind over 30y; extreme-heat days projected 7→25/yr by 2055 (HVAC capex compounding) — expect insurance premiums to compound above CPI over the hold.
Questions for the listing agent
- What do current leases actually rent for vs. the listed asking? Can we see a recent rent roll and the last 12 months of T-12 income?
- It's been on market 87 days. Have you received any prior offers? Is the seller open to a 35% concession, seller financing, or rate buy-down credit?
- Why hasn't it sold? Are there any deal-killer items the seller is aware of (foundation, flood, title, zoning, code violations)?
- Is there a deadline driving the sale (1031 exchange, divorce, estate, relocation)? That informs how much negotiation room exists.
- The area grade is low — what's the realistic commute time and amenity access for the typical tenant pool here? Any planned neighborhood developments (good or bad) we should know about?
- What's the average days-on-market for RENTAL listings here right now (not sales)? A rising rental-DOM trend means longer vacancies and softer asking-rent achievability than the comps imply.
- What's the recent tenant-quality profile in this submarket — average credit score on applications, eviction rate, late-payment / NSF rate, and stable-employment percentage? A property-management company in the area should have these aggregated.
- How much new for-sale + rental construction is in the pipeline within 1–3 miles? Heavy new supply typically softens prices + rents 12–24 months out; constrained supply supports both.
Investment metrics
- 1% rule
- 0.65% ✗
- Cap rate
- 4.16%
- Cash-on-cash
- -7.62%
- DSCR
- 0.66
- GRM
- 12.8
CMA / ARV
- ARV (median comp)
- $326,399
- List price
- $275,000
- Delta
- -15.75%
- Verdict
- UNDERPRICED
- Comps
- 20 within 1.0 mi
Show comp detail 7 sales within ~0.75 mi
| Address | Dist | Beds/Ba | Sqft | Sold | Price | $/sf | Match |
|---|---|---|---|---|---|---|---|
| 357 Smith Cir | 0.20mi | 3/2.0 | 1,594 (+1%) | 22mo | $299,900 | $188 | 70 |
| 1525 Shug Ln | 0.44mi | 3/2.0 | 1,546 (-2%) | 12mo | $294,990 | $191 | 67 |
| 346 Smith Cir | 0.25mi | 3/2.0 | 1,548 (-2%) | 23mo | $309,900 | $200 | 66 |
| 1533 Shug Ln | 0.41mi | 3/2.0 | 1,546 (-2%) | 15mo | $299,990 | $194 | 65 |
| 15006 High Country Acres | 0.66mi | 3/2.0 | 1,674 (+6%) | 6mo | $384,000 | $229 | 54 |
| 14447 County Road 463 | 0.10mi | 2/2.0 (-1) | 1,808 (+15%) | 21mo | $334,900 | $185 | 48 |
| 15092 High Country Acres Ln | 0.66mi | 3/2.0 | 1,791 (+14%) | 9mo | $388,000 | $217 | 39 |
Match score weights: distance 35% · size 25% · config 20% · recency 20%. Top-matched comps best support the ARV.
Projected returns pro-forma
-3.0% appreciation · 3.0% rent growth · sell at horizon
- IRR
- -29.6%
- Equity multiple
- 0.02×
- Total profit
- $-75,677
- Equity at exit
- $41,003
- IRR
- -30.4%
- Equity multiple
- -0.38×
- Total profit
- $-105,888
- Equity at exit
- $23,777
Cash invested: $77,000 (down + closing). Projections, not guarantees.
Landlord ↔ Tenant lean methodology
- Overall (STATE)
- 87 Strongly Landlord-Friendly
- State Texas
- 87 Strongly Landlord-Friendly · R+5
- County
- — inherits STATE
- City
- — inherits STATE
ZIP-level market 75771
- Home prices YoY
- -30.6%
- Active inventory
- 640
- Price-to-rent
- 12.8×
Monthly cashflow live
- Estimated rent
- $1,787 medium interval (Pro) →
- Mortgage (P&I)
- −$1,442
- Tax est. 1.5%
- −$344 /mo · $4,125/yr
- Insurance
- −$115
- HOA
- −$0
- Vacancy / Maint / Mgmt
- −$375
- Net cashflow
- $-489
Break-even live
Sensitivity live
| Price | -10% $-299 | -5% $-394 | +0% $-489 | +5% $-584 | +10% $-679 |
|---|---|---|---|---|---|
| Rent | -10% $-630 | -5% $-560 | +0% $-489 | +5% $-418 | +10% $-348 |
| Rate | -1.0pp $-350 | -0.5pp $-419 | base $-489 | +0.5pp $-560 | +1.0pp $-633 |
UW: 25.0% down · 7.5% · 30yr · 1.5% tax · 5.0% vac · 8.0% maint · 8.0% mgmt
Financing live
Cash to close
- Down payment
- $68,750
- Closing costs
- $8,250
- Reserves months
- —
- Total cash needed
- —
Loan-product check · same deal, 3 products live
Conventional
25% down · 7.5% · 30yr
- Down + closing
- —
- Monthly P&I
- —
- Monthly cashflow
- —
- DSCR
- —
- Eligible?
- —
Personal DTI + credit; lowest rate.
DSCR
20% down · 8.5% · 30yr
- Down + closing
- —
- Monthly P&I
- —
- Monthly cashflow
- —
- DSCR
- —
- Eligible?
- —
No personal income docs; deal must DSCR.
Hard money
10% down · 12.0% · 12mo
- Down + closing
- —
- Monthly P&I
- —
- Monthly cashflow
- —
- DSCR
- —
- Eligible?
- —
Short-term bridge; refi at stabilization.
Rent comps 1 comps
| Address | Beds | Baths | Sqft | Rent | $/sqft | DOM | Units | Dist |
|---|---|---|---|---|---|---|---|---|
| 15614 Garden Ln Lindale, TX | 3.0 | 2.0 | 1607 | $2,250 | $1.40 | 45d | 1 | 1.09mi |
Listing history 22 events
-
2026-06-22days on market $275,000 Active 87 DOM
-
2026-06-19days on market $275,000 Active 85 DOM
-
2026-06-18days on market $275,000 Active 84 DOM
-
2026-06-17days on market $275,000 Active 83 DOM
-
2026-06-16days on market $275,000 Active 82 DOM
-
2026-06-15days on market $275,000 Active 81 DOM
-
2026-06-14days on market $275,000 Active 79 DOM
-
2026-06-13pricedays on market $275,000 Active 78 DOM
-
2026-06-10days on market $287,000 Active 76 DOM
-
2026-06-09days on market $287,000 Active 75 DOM
-
2026-06-08days on market $287,000 Active 74 DOM
-
2026-06-07days on market $287,000 Active 73 DOM
-
2026-06-03days on market $287,000 Active 69 DOM
-
2026-06-02days on market $287,000 Active 68 DOM
-
2026-06-01days on market $287,000 Active 67 DOM
-
2026-05-31days on market $287,000 Active 66 DOM
-
2026-05-30days on market $287,000 Active 65 DOM
-
2026-03-26$295,000 Active 522-char remark
Show marketing remark (522 chars)
Beautiful 3 bedroom, 2 bath, 2 car garage home located in highly sought after Lindale ISD. Situated on a spacious half-acre lot, this home features an open-concept layout with granite countertops, custom knotty alder cabinetry, breakfast bar, and stainless steel appliances. Enjoy a split floor plan with a large primary suite and walk-in closet. The separate but open dining area is perfect for entertaining. The outdoor space is a blank slate and just waiting on you to create your own oasis. Don’t miss this one!
-
2021-04-29soldstatus 364-char remark
Show marketing remark (364 chars)
Come see all that this beautiful 3/2/2 in Lindale ISD has to offer. Sitting on a half acre lot this home boasts an open concept, granite countertops, customer knotty alder cabinets, a breakfast bar , stainless steel appliances, split floor plan with large master bedroom and walk in closet, separate but open dining area and so much more! This one won't last long!
-
2021-03-11$245,500 364-char remark
Show marketing remark (364 chars)
Come see all that this beautiful 3/2/2 in Lindale ISD has to offer. Sitting on a half acre lot this home boasts an open concept, granite countertops, customer knotty alder cabinets, a breakfast bar , stainless steel appliances, split floor plan with large master bedroom and walk in closet, separate but open dining area and so much more! This one won't last long!
-
2016-04-20soldstatus
-
2016-03-12$179,900
ⓘ Source: listings_history table (triggers on properties + properties_extension) + one-shot
backfill from property_details.listing_events for pre-trigger history.
Climate risk First Street
- Flood 1/10 Low FEMA zone X (unshaded) · 0% chance over 30 yrs
- Wildfire 3/10 Moderate
- Heat 6/10 Major 7 d/yr ≥110°F today · 25 d/yr by 30 yrs out
- Wind 6/10 Major 53% chance of damaging wind over 30 yrs
- Air quality 2/10 Low 0 unhealthy d/yr today · 1 by 30 yrs out
Nearby sold comps map
Loading sold comps map…
Walkable amenities ~0.75 mi
Loading nearby amenities…
Taxation est. · year 1
- Rental income
- $21,441
- − Mortgage interest
- −$15,404
- − Property taxes
- −$4,125
- − Insurance
- −$1,375
- − Repairs & maintenance
- −$1,715
- − Management
- −$1,715
- − Depreciation
- −$8,000
- Taxable loss
- −$10,894
- Est. tax savings @ 24.0%
- +$2,615
- After-tax cash flow
- $-3,253/yr
For passive investors: Depreciation is non-cash, so a rental often shows a tax loss while cash-flowing — sheltering income. Rental losses are passive: they offset passive income freely, and up to $25,000/yr can offset ordinary (W-2) income if you actively participate and your MAGI is under $100k (phasing out to $0 by $150k); unused losses carry forward. On sale, claimed depreciation is recaptured at up to 25%, and gains may owe capital-gains tax (a 1031 exchange can defer both). Figures are a year-1 estimate at your 24.0% rate — not tax advice; consult a CPA.
Schools (NCES district)
- District
- Lindale ISD
- NCES district ID
- 4827510
- Math proficiency
- 71% ▼ -2.00%
- Reading proficiency
- 66% ▲ 4.00%
- Median HH income
- $57,325
- Composite
- 58.85/100
- National rank
- #974
- State rank
- #20 of 826 in TX
Livability — Lindale
- Score
- 79/100
- State rank
- #52
- US rank
- #2100
Category grades
Schools grade is shown separately in the Schools card above.
Census & demographics
- County
- Smith County · 180,570 people
- City population
- 21,238
- Metro
- Tyler, TX
- Population (ZIP)
- 21,238
- Household income
- $93,462
- Rent vs Own
- Severe rent burden
- 166.0
Population outlook (Smith County) Hauer SSP2
- Today (2025)
- 248,890 people
- By 2030
- 261,665 · +5.1%
- By 2040
- 286,114 · +15.0%
- By 2050
- 308,006 · +23.8%
- By 2075
- 354,171 · +42.3%
- By 2100
- 372,828 · +49.8%
Race, ethnicity, and origin ACS 2023
- Neighborhood character
- Predominantly White (81%)
- Race & ethnicity
- White 81% Hispanic / Latino 9% Two or more races 6% Black 5% Asian 2%
- Hispanic origin (detail)
- Mexican 8%
- Common ancestry
- Slovak 3% Serbian 2% Lithuanian 1%
- Foreign-born
- 5% · Canada, China
- Languages at home
- 93% English-only · Spanish 6%
Political lean MEDSL · Smith
- 2024 margin
- Solid R (+45.1) · D 27.0% · R 72.1%
- 2008→2024 swing
- -5.6pp toward R · 2008: -39.5pp · 2024: -45.1pp
- All cycles
- 2024: R+45.1 2020: R+39.4 2016: R+43.9 2012: R+46.9 2008: R+39.5
Not yet ingested
- Civics
- —
Market trends
- HPI YoY
- ▼ -88.40%
- Current HPI
- 200.187
- Rent YoY
- —
- Metro
- Tyler, TX
- State GDP YoY
- ▲ 3.95%
- F500 in state
- 110
Industry mix (Fortune 500 HQ in TX)
| Industry | F500 HQs | Revenue |
|---|---|---|
| Energy | 16 | $1,198B |
|
||
| Technology | 5 | $198B |
|
||
| Engineering / Construction | 4 | $72B |
|
||
| Energy Services | 3 | $60B |
|
||
| Utilities | 3 | $41B |
|
||
| Healthcare | 2 | $330B |
|
||
Price history
+64.0% since first listed5 events — show timeline
- 2026-03-26 Listed $295,000 GTAR
- 2021-04-29 Sold (MLS) — GTAR
- 2021-03-11 Listed $245,500 GTAR
- 2016-04-20 Sold (MLS) — GTAR
- 2016-03-12 Listed $179,900 GTAR
Cash-flow waterfall
monthlySold comps — $/sqft
last 12 mo · ≤1 miLoading sold comps…