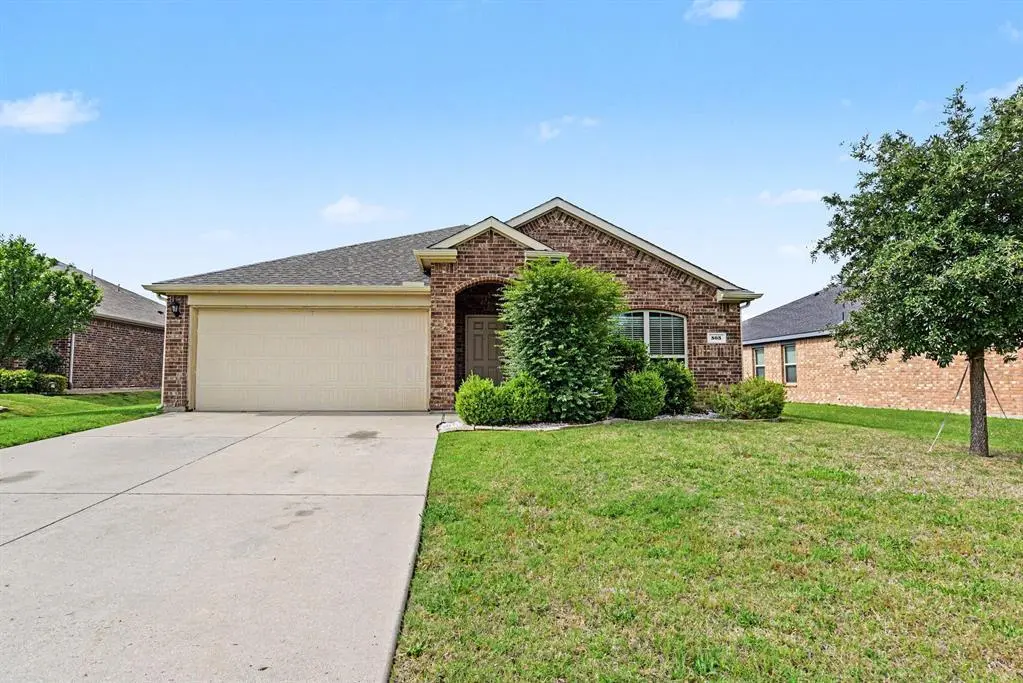
503 Plum Dr · Josephine, TX
Flood risk 1/10 · Minimal
- FEMA flood zone
- X (unshaded)
- Chance of flooding over 30 yrs
- 0.0%
- Est. flood insurance / yr
- $507 – $1,088
Fire risk 3/10 · Minor
- Est. fire insurance / yr
- $1,222 – $2,270
Heat risk 8/10 · Major
- Hot days now (above 110°F)
- 7 days/yr
- Hot days in 30 yrs
- 23 days/yr
Wind risk 6/10 · Moderate
- Chance of severe wind over 30 yrs
- 27.0%
Air-quality risk 2/10 · Minimal
- Unhealthy air days now
- 1 days/yr
- Unhealthy air days in 30 yrs
- 1 days/yr
Risk factors via First Street. Map © Google.
Why this score? — see what drove the C- grade
The composite is a weighted blend of 9 inputs, each scored 0–100. Each bar is that input's sub-score; the figure is the points it added to the 100-point composite (weight × sub-score).
- ARV discount +15.0/15.0
- Cash flow +11.1/30.0
- Appreciation +10.0/10.0
- 1% rule +4.1/10.0
- DSCR +3.2/10.0
- Schools +3.2/10.0
- Livability +3.0/5.0
- Rent growth +2.5/5.0
- Condition / age +2.5/5.0
$225,000
🖨 Deal sheet 📄 Offer letter ✓ Due diligence
Listing remarks
If you’ve been looking for a home that just feels easy to live in, this is it. Located in Fountain View in Josephine, this 4-bedroom, 2-bath home features an open layout, large kitchen island, walk-in pantry, and split bedrooms for extra privacy in the primary suite. Tucked toward the back of the neighborhood, you’ll enjoy a quieter setting, fenced backyard, walking trail, and stocked fishing pond nearby. Plus — no MUD or PID fees and easy access to HWY 30.
Key facts
- Large kitchen island
- Walking trail
- Open layout
Tags
Property features AI
Finance
- Other: Association management: FOUNTAINVIEW HOA SOUTH
- HOA & community: Mandatory HOA; HOA fee $200 annually (includes management fees)
Exterior
- Parking: Attached 2-car garage; 2 covered parking spaces; Garage faces front
- Utilities: City water; City sewer; Not in a municipal utility district
- Home design: Single family residence; One-story; Built in 2016; Residential property
- Construction: Preowned (built 2016)
- Exterior features: Lot under 0.5 acre (approx. 0.1557 acres); Subdivision: Fountain View Ph 4; No known restrictions
Interior
- Kitchen: Dishwasher; Disposal; Electric range; Microwave
- Bedrooms: 4 bedrooms (all on the main level); Primary bedroom with walk-in closet
- Bathrooms: 2 full bathrooms
- Heating & cooling: Central heating; Central air conditioning; Electric system; Ceiling fans
- Interior features: Kitchen island; Walk-in closet(s); Eat-in kitchen; Pantry
Neighborhood map
What this means for you Summary
Snapshot
- This is a 4-bed/2.0-bath single-family listed at $225k.
Deal economics
- At list price, monthly cash flow is $-90 ($-1k/yr) — negative.
- To cash-flow at today's rent, offer at most $209k (7.1% below list).
- To meet the 1% rule (rent ≥ 1% of price), the offer needs to be $204k (9.2% below list).
- Recommended offer: $204k (9.2% below list) — sets the bar for 1% rule.
- Cap rate 5.8% vs local median 4.4% in Josephine — top-decile yield for the area; either an underpriced asset or a hidden risk that comps aren't pricing in. Stress-test before assuming the spread holds.
Location & tenants
- Location reads 60/100 on livability (#1,076 in TX) — a middle-class / working-renter tenant base. Strengths: cost of living A+, housing A+, crime A-; Watch: schools F, amenities F, commute F.
- Community ISD (rural): math 30% / reading 38% proficiency, ranked #479 of 826 in TX (top 58%) — families likely to look elsewhere, expect single-tenant / working-renter base with shorter leases.
- Market conditions: 421 active listings in the ZIP; 27 comparable units currently listed for rent nearby; rentals leasing fast (median 13d on market — plan ~1-2 weeks tenant-placement turnaround); 19,194 units permitted in Collin County in 2024 (3,988 in 5+ unit buildings).
Forward outlook
- In year one you build about $24k of equity ($2k loan paydown + $22k appreciation (10.0% local appreciation)).
- Collin County population projected at +60% by 2050 — long-run rental-demand tailwind backs the buy-and-hold thesis.
- By year 2, paydown + projected appreciation supports a ~$39k cash-out refi (75% LTV) — recoverable capital for the next deal without selling this one.
Negotiation context
- It's been on market 15 days — a 2% lower offer ($222k) is reasonable based on typical stale-listing flexibility.
- 4 sale attempts with the ask held roughly flat each time — persistent listings suggest the price (not the market) is what's stuck; bring a comps-based counter.
Risks & watch-outs
- Climate carrying-cost: major wind risk, 27% chance of damaging wind over 30y; extreme-heat days projected 7→23/yr by 2055 (HVAC capex compounding) — expect insurance premiums to compound above CPI over the hold.
Questions for the listing agent
- What do current leases actually rent for vs. the listed asking? Can we see a recent rent roll and the last 12 months of T-12 income?
- What does the HOA fee cover, when was the last increase, and are there any pending special assessments or reserve-fund shortfalls?
- Is there a deadline driving the sale (1031 exchange, divorce, estate, relocation)? That informs how much negotiation room exists.
- Schools are F-rated, which usually means shorter tenancies and higher turnover. Who's the typical renter profile here, and what's been the actual vacancy rate?
- What's the average days-on-market for RENTAL listings here right now (not sales)? A rising rental-DOM trend means longer vacancies and softer asking-rent achievability than the comps imply.
- What's the recent tenant-quality profile in this submarket — average credit score on applications, eviction rate, late-payment / NSF rate, and stable-employment percentage? A property-management company in the area should have these aggregated.
- How much new for-sale + rental construction is in the pipeline within 1–3 miles? Heavy new supply typically softens prices + rents 12–24 months out; constrained supply supports both.
Investment metrics
- 1% rule
- 0.91% ✗
- Cap rate
- 5.81%
- Cash-on-cash
- -1.72%
- DSCR
- 0.92
- GRM
- 9.2
CMA / ARV
- ARV (median comp)
- $293,308
- List price
- $225,000
- Delta
- -23.29%
- Verdict
- UNDERPRICED
- Comps
- 20 within 1.0 mi
Show comp detail 12 sales within ~0.75 mi
| Address | Dist | Beds/Ba | Sqft | Sold | Price | $/sf | Match |
|---|---|---|---|---|---|---|---|
| 511 Magnolia Dr | 0.17mi | 3/2.0 (-1) | 1,526 (-4%) | 2mo | $219,900 | $144 | 79 |
| 406 Shady Bank Way | 0.10mi | 3/2.0 (-1) | 1,712 (+8%) | 6mo | $319,235 | $186 | 72 |
| 913 W Cook St | 0.39mi | 3/2.0 (-1) | 1,527 (-4%) | 7mo | $525,000 | $344 | 65 |
| 406 Gooseberry Dr | 0.48mi | 4/2.0 | 1,655 (+4%) | 8mo | $278,490 | $168 | 64 |
| 305 Pine Hollow Way | 0.73mi | 4/2.0 | 1,568 (-1%) | 6mo | $249,900 | $159 | 59 |
| 104 Milton St | 0.74mi | 4/2.0 | 1,604 (+1%) | 7mo | $247,500 | $154 | 58 |
| 505 Jasmine Cir | 0.23mi | 3/2.0 (-1) | 1,810 (+14%) | 4mo | $275,000 | $152 | 58 |
| 506 Saddle Blanket Dr | 0.41mi | 4/2.0 | 1,801 (+14%) | 1mo | $290,990 | $162 | 57 |
| 407 Saddle Blanket Dr | 0.44mi | 4/2.0 | 1,801 (+14%) | 2mo | $273,990 | $152 | 55 |
| 409 Saddle Blanket Dr | 0.44mi | 3/2.0 (-1) | 1,404 (-12%) | 3mo | $270,990 | $193 | 53 |
| 800 Rustic Way | 0.63mi | 4/2.0 | 1,796 (+13%) | 3mo | $275,000 | $153 | 46 |
| 806 Independence | 0.52mi | 3/2.0 (-1) | 1,420 (-10%) | 9mo | $245,000 | $173 | 46 |
Match score weights: distance 35% · size 25% · config 20% · recency 20%. Top-matched comps best support the ARV.
Projected returns pro-forma
10.0% appreciation · 3.0% rent growth · sell at horizon
- IRR
- 23.1%
- Equity multiple
- 2.86×
- Total profit
- $116,919
- Equity at exit
- $202,698
- IRR
- 20.6%
- Equity multiple
- 6.54×
- Total profit
- $349,068
- Equity at exit
- $437,126
Cash invested: $63,000 (down + closing). Projections, not guarantees.
Landlord ↔ Tenant lean methodology
- Overall (STATE)
- 87 Strongly Landlord-Friendly
- State Texas
- 87 Strongly Landlord-Friendly · R+5
- County
- — inherits STATE
- City
- — inherits STATE
ZIP-level market 75173
- Home prices YoY
- 3.1%
- Active inventory
- 421
- Price-to-rent
- 9.2×
Monthly cashflow live
- Estimated rent
- $2,042 high interval (Pro) →
- Mortgage (P&I)
- −$1,180
- Tax from tax record
- −$413 /mo · $4,956/yr
- Insurance
- −$94
- HOA
- −$17
- Vacancy / Maint / Mgmt
- −$429
- Net cashflow
- $-90
Break-even live
UW: 25.0% down · 7.5% · 30yr · 1.5% tax · 5.0% vac · 8.0% maint · 8.0% mgmt
Financing live
Cash to close
- Down payment
- $56,250
- Closing costs
- $6,750
- Reserves months
- —
- Total cash needed
- —
Loan-product check · same deal, 3 products live
Conventional
25% down · 7.5% · 30yr
- Down + closing
- —
- Monthly P&I
- —
- Monthly cashflow
- —
- DSCR
- —
- Eligible?
- —
Personal DTI + credit; lowest rate.
DSCR
20% down · 8.5% · 30yr
- Down + closing
- —
- Monthly P&I
- —
- Monthly cashflow
- —
- DSCR
- —
- Eligible?
- —
No personal income docs; deal must DSCR.
Hard money
10% down · 12.0% · 12mo
- Down + closing
- —
- Monthly P&I
- —
- Monthly cashflow
- —
- DSCR
- —
- Eligible?
- —
Short-term bridge; refi at stabilization.
Rent comps 27 comps
| Address | Beds | Baths | Sqft | Rent | $/sqft | DOM | Units | Dist |
|---|---|---|---|---|---|---|---|---|
| 319 Plum Dr Nevada, TX | 4.0 | 2.0 | 1587 | $1,899 | $1.20 | 10d | 1 | 0.16mi |
| 504 Saddle Blanket Dr Nevada, TX | 4.0 | 2.0 | 1649 | $1,949 | $1.18 | 15d | 1 | 0.41mi |
| 504 Saddle Blanket Dr Nevada, TX | 4.0 | 2.0 | 1649 | $1,925 | $1.17 | 6d | 1 | 0.41mi |
| 503 Saddle Blanket Dr Nevada, TX | 4.0 | 3.0 | 2077 | $2,190 | $1.05 | 43d | 1 | 0.44mi |
| 214 Crooked Field Dr Royse City, TX | 3.0 | 2.0 | 1398 | $1,900 | $1.36 | 24d | 1 | 0.53mi |
| 802 Turnbuckle Ct Royse City, TX | 4.0 | 2.0 | 1577 | $1,849 | $1.17 | 43d | 1 | 0.73mi |
| 305 Silo Cir Royse City, TX | 4.0 | 2.0 | 2074 | $2,100 | $1.01 | 24d | 1 | 0.76mi |
| 311 Milo Way Royse City, TX | 4.0 | 2.0 | 2074 | $2,200 | $1.06 | 6d | 1 | 0.78mi |
| 315 Pine Hollow Way Josephine, TX | 4.0 | 3.0 | 2212 | $2,300 | $1.04 | 7d | 1 | 0.81mi |
| 306 E Cook St Josephine, TX | 3.0 | 2.0 | 1817 | $2,100 | $1.16 | 1d | 1 | 0.83mi |
| 722 Windmill St Josephine, TX | 4.0 | 2.0 | 1568 | $2,190 | $1.40 | 2d | 1 | 0.86mi |
| 801 Meadow Creek Ln Josephine, TX | 4.0 | 2.0 | 1757 | $2,500 | $1.42 | 5d | 1 | 0.87mi |
| 800 Windmill St Josephine, TX | 4.0 | 2.0 | 1843 | $2,100 | $1.14 | 7d | 1 | 0.88mi |
| 1307 Community Way Royse City, TX | 4.0 | 2.0 | 2104 | $2,100 | $1.00 | 43d | 1 | 0.93mi |
| 1004 Cotton Gin Ct Royse City, TX | 4.0 | 2.0 | 1875 | $1,850 | $0.99 | 12d | 1 | 0.97mi |
| 1007 Cotton Gin Ct Royse City, TX | 3.0 | 2.0 | 1611 | $2,050 | $1.27 | 43d | 1 | 1.00mi |
| 717 Cottonwood WAY Josephine, TX | 4.0 | 3.0 | 2073 | $2,125 | $1.03 | 1d | 1 | 1.04mi |
| 508 Windrow Dr Royse City, TX | 3.0 | 2.0 | 1533 | $1,875 | $1.22 | 24d | 1 | 1.17mi |
| 508 Windrow Dr Royse City, TX | 3.0 | 2.0 | 1533 | $1,900 | $1.24 | 43d | 1 | 1.17mi |
| 503 Cistern Way Royse City, TX | 3.0 | 2.0 | 1294 | $1,795 | $1.39 | 2d | 1 | 1.18mi |
| 1210 Honeysuckle Dr Josephine, TX | 5.0 | 2.0 | 1995 | $2,100 | $1.05 | 12d | 1 | 1.22mi |
| 1503 Cotton Gin Ct Royse City, TX | 3.0 | 2.0 | 1566 | $2,200 | $1.40 | 43d | 1 | 1.26mi |
| 464 N Greenville St Farmersville, TX | 3.0 | 2.0 | 2000 | $3,000 | $1.50 | 1d | 1 | 1.28mi |
| 1501 Bridle Dr Josephine, TX | 4.0 | 2.0 | 2081 | $1,975 | $0.95 | 43d | 1 | 1.29mi |
| 1208 Fieldstone Ct Royse City, TX | 4.0 | 2.0 | 1835 | $2,000 | $1.09 | 43d | 1 | 1.29mi |
| 711 Cistern Way Royse City, TX | 4.0 | 2.0 | 2081 | $1,975 | $0.95 | 7d | 1 | 1.32mi |
| 1413 Thunder Canyon Way Josephine, TX | 5.0 | 2.0 | 2006 | $2,500 | $1.25 | 43d | 1 | 1.44mi |
HOA detail
- Monthly dues
- $17 · $204/yr
Listing history 7 events
-
2026-05-12$225,000 Active 480-char remark
-
2026-04-16status Active
-
2026-04-07historical Active Option Contract
-
2026-03-14$230,000 Active
-
2026-02-16price $247,000
-
2026-01-05price $249,900
-
2025-09-04$269,000 Active
ⓘ Source: listings_history table (triggers on properties + properties_extension) + one-shot
backfill from property_details.listing_events for pre-trigger history.
Tax reassessment forecast TX · Resets to sale price
- Current annual tax
- $4,956 · $413/mo
- Projected year-2 tax
- $4,956 · $413/mo
- Expected delta
- $0/yr ($0/mo · 0.0%)
ⓘ Screening estimate from a state-policy table — verify with the county assessor before closing.
Climate risk First Street
- Flood 1/10 Low FEMA zone X (unshaded) · 0% chance over 30 yrs
- Wildfire 3/10 Moderate
- Heat 8/10 Severe 7 d/yr ≥110°F today · 23 d/yr by 30 yrs out
- Wind 6/10 Major 27% chance of damaging wind over 30 yrs
- Air quality 2/10 Low 1 unhealthy d/yr today · 1 by 30 yrs out
Nearby sold comps map
Loading sold comps map…
Walkable amenities ~0.75 mi
Loading nearby amenities…
Taxation est. · year 1
- Rental income
- $24,509
- − Mortgage interest
- −$12,603
- − Property taxes
- −$4,956
- − Insurance
- −$1,125
- − Repairs & maintenance
- −$1,961
- − Management
- −$1,961
- − HOA
- −$204
- − Depreciation
- −$6,545
- Taxable loss
- −$4,847
- Est. tax savings @ 24.0%
- +$1,163
- After-tax cash flow
- $81/yr
For passive investors: Depreciation is non-cash, so a rental often shows a tax loss while cash-flowing — sheltering income. Rental losses are passive: they offset passive income freely, and up to $25,000/yr can offset ordinary (W-2) income if you actively participate and your MAGI is under $100k (phasing out to $0 by $150k); unused losses carry forward. On sale, claimed depreciation is recaptured at up to 25%, and gains may owe capital-gains tax (a 1031 exchange can defer both). Figures are a year-1 estimate at your 24.0% rate — not tax advice; consult a CPA.
Schools (NCES district)
- District
- Community ISD
- NCES district ID
- 4814850
- Math proficiency
- 30% ▼ -23.00%
- Reading proficiency
- 38% ▼ -11.00%
- Median HH income
- $71,841
- Composite
- 31.58/100
- National rank
- #5951
- State rank
- #479 of 826 in TX
Livability — Josephine
- Score
- 60/100
- State rank
- #1076
- US rank
- #19105
Category grades
Schools grade is shown separately in the Schools card above.
Census & demographics
- Census place
- Josephine, TX
- Population (ZIP)
- 9,284
Population outlook (Collin County) Hauer SSP2
- Today (2025)
- 1,210,074 people
- By 2030
- 1,358,201 · +12.2%
- By 2040
- 1,654,061 · +36.7%
- By 2050
- 1,937,359 · +60.1%
- By 2075
- 2,567,039 · +112.1%
- By 2100
- 2,952,048 · +144.0%
Race, ethnicity, and origin ACS 2023
- Neighborhood character
- Majority White (65%)
- Race & ethnicity
- White 65% Hispanic / Latino 28% Two or more races 15% Black 2% Native American 1%
- Hispanic origin (detail)
- Mexican 26%
- Common ancestry
- Slovak 2% Serbian 1% Iranian 1%
- Foreign-born
- 17% · Canada, Jamaica
- Languages at home
- 74% English-only · Spanish 24% Arabic 1%
Political lean MEDSL · Collin
- 2024 margin
- R (+11.1) · D 43.1% · R 54.3% · Other 2.6%
- 2008→2024 swing
- +14.4pp toward D · 2008: -25.6pp · 2024: -11.1pp
- All cycles
- 2024: R+11.1 2020: R+4.3 2016: R+17.0 2012: R+31.6 2008: R+25.6
Not yet ingested
- Civics
- —
Market trends
- HPI YoY
- ▲ 10.09%
- Current HPI
- 331.12
- Rent YoY
- —
- Metro
- —
- State GDP YoY
- ▲ 3.95%
- F500 in state
- 110
Industry mix (Fortune 500 HQ in TX)
| Industry | F500 HQs | Revenue |
|---|---|---|
| Energy | 16 | $1,198B |
|
||
| Technology | 5 | $198B |
|
||
| Engineering / Construction | 4 | $72B |
|
||
| Energy Services | 3 | $60B |
|
||
| Utilities | 3 | $41B |
|
||
| Healthcare | 2 | $330B |
|
||
Price history
-16.4% since first listed9 events — show timeline
- 2026-05-27 Pending — NTREIS
- 2026-05-20 Contingent — NTREIS
- 2026-05-12 Listed $225,000 NTREIS
- 2026-04-16 Relisted — NTREIS
- 2026-04-07 Contingent — NTREIS
- 2026-03-14 Listed $230,000 NTREIS
- 2026-02-16 Price Changed $247,000 NTREIS
- 2026-01-05 Price Changed $249,900 NTREIS
- 2025-09-04 Listed $269,000 NTREIS
Property tax history
+7.3%/yrLatest (2025): $4,956 · -9.8% YoY. Source: county tax records.
Cash-flow waterfall
monthlySold comps — $/sqft
last 12 mo · ≤1 miLoading sold comps…