 Multi-family
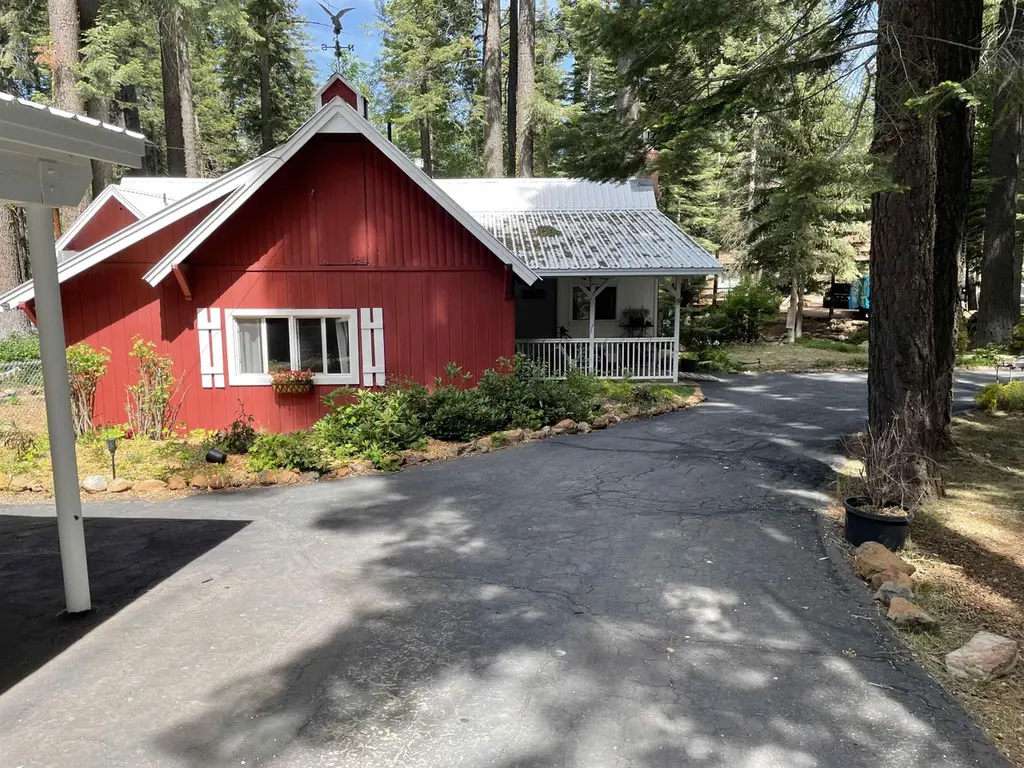
462-745 Circle Drive Dr · Clear Creek, CA
Flood risk 5/10 · Moderate
- FEMA flood zone
- X (unshaded)
- Chance of flooding over 30 yrs
- 0.24%
- Est. flood insurance / yr
- $507 – $1,088
Fire risk 5/10 · Moderate
- Est. fire insurance / yr
- $659 – $1,223
Heat risk 3/10 · Minor
- Hot days now (above 87°F)
- 6 days/yr
- Hot days in 30 yrs
- 15 days/yr
Wind risk 1/10 · Minimal
- Chance of severe wind over 30 yrs
- —
Air-quality risk 10/10 · Severe
- Unhealthy air days now
- 24 days/yr
- Unhealthy air days in 30 yrs
- 26 days/yr
Risk factors via First Street. Map © Google.
Why this score? — see what drove the C+ grade
The composite is a weighted blend of 9 inputs, each scored 0–100. Each bar is that input's sub-score; the figure is the points it added to the 100-point composite (weight × sub-score).
- Cash flow +24.2/30.0
- DSCR +7.8/10.0
- ARV discount +7.5/15.0
- Appreciation +5.7/10.0
- 1% rule +5.5/10.0
- Schools +3.0/10.0
- Livability +2.6/5.0
- Rent growth +2.5/5.0
- Condition / age +2.5/5.0
$399,000
🖨 Deal sheet 📄 Offer letter ✓ Due diligence
Multi-family units
County records classify this as Multi-Family (2-4 Unit). Listing-text estimate: 1 unit. estimate disagrees with records
Listing remarks MLS
First time on the market! Charming home on beautifully landscaped, Creek-side lot! Main home has 2 bedrooms/2baths, inviting front porch and large rear deck overlooking Clear Creek. Garden Window & Cedar Lined Closets. The "Bunk House" over the garage has 2 Bedrooms/1 Bath. The detached 2 Car Garage and Carport are perfect for storing your vehicles, ATV's, Boats, etc. Circular Driveway. This property is well maintained. Ideal for your Almanor Getaway Home, retirement/starter home and the Guest Apt will be perfect for Guests OR as a Vacation Rental! Furnished. Newly painted trim and newly stained deck. Owner has priced this to be AS IS. Home and Pest Inpsection Reports available. A little TLC and you are good to go! Come take a look soon!
Key facts
- Cedar lined closets
- Landscaped lot
- Garden window
Tags
Property features AI
Exterior
- Parking: 2-car garage; Detached carport; 2 carport spaces; Asphalt driveway; Off-street parking; On-street parking; Garage door opener
- Security: Security system; Carbon monoxide detector(s)
- Utilities: Electricity available; Sewer available; Water available; Generator (electric backup)
- Home design: Single-family residence; Two levels / 2-story
- Construction: Frame construction with wood siding; Metal roof; Concrete perimeter foundation; Built on a level lot
- Exterior features: Outdoor lighting; Deck; Porch; Chain-link and partial fencing; Fenced yard; Shed(s); Generator; Stream/creek on the property; Has a view
Interior
- Kitchen: Electric oven; Electric range; Dishwasher; Microwave; Refrigerator
- Flooring: Vinyl flooring
- Bathrooms: 2 full bathrooms
- Heating & cooling: Central heating; Fireplace insert heating; Ceiling fan(s)
- Interior features: Walk-in closet(s); Entrance foyer; Pantry; Double-pane windows; Fireplace insert; Wood-burning stove
- Laundry & utility: Washer hookup; Electric dryer hookup; Washer; Dryer
Neighborhood map
What this means for you Summary
Snapshot
- This is a 2-bed/1.0-bath multifamily listed at $399k.
Deal economics
- At list price, monthly cash flow is $794 ($10k/yr) — positive.
- The deal already cash-flows at list — no discount required.
- Meets the 1% rule at list price ($4k rent vs $399k).
- Recommended offer: $393k (1.5% below list) — sets the bar for market timing.
Location & tenants
- Location reads 51/100 on livability (#1,096 in CA) — a working-class tenant base; expect higher turnover. Strengths: housing A-; Watch: schools C-, employment D+, cost of living D+.
- Westwood Unified (rural): math 30% / reading 35% proficiency, ranked #995 of 1,400 in CA (top 71%) — families likely to look elsewhere, expect single-tenant / working-renter base with shorter leases.
- Market conditions: 240 active listings in the ZIP; 6 units permitted in Lassen County in 2024 (0 in 5+ unit buildings).
Forward outlook
- In year one you build about $8k of equity ($3k loan paydown + $5k appreciation (1.4% local appreciation)).
- Lassen County population projected at -14% by 2050 — secular population decline; favor cash flow + early exit over multi-decade hold.
- At projected returns (1.4% appreciation + 3.0% rent growth), your $112k cash investment doubles in ~6 years — after that, you're playing with house money.
- By year 5, paydown + projected appreciation supports a ~$37k cash-out refi (75% LTV) — recoverable capital for the next deal without selling this one.
Negotiation context
- It's been on market 17 days — a 2% lower offer ($393k) is reasonable based on typical stale-listing flexibility.
- 2 sale attempts since 4y ago with the ask held roughly flat each time — persistent listings suggest the price (not the market) is what's stuck; bring a comps-based counter.
- Current owner paid $300k; 33% above their basis — modest negotiation headroom, anchor on the comps not their cost.
Risks & watch-outs
- Watch-outs: built in 1950 — expect roof / HVAC / electrical / plumbing capex.
- Climate carrying-cost: moderate flood risk; moderate wildfire risk — expect insurance premiums to compound above CPI over the hold.
Questions for the listing agent
- Built in 1950 — when were the roof, HVAC, electrical panel, plumbing, and water heater last replaced?
- Is there a deadline driving the sale (1031 exchange, divorce, estate, relocation)? That informs how much negotiation room exists.
- Crime grade is F in this area — have there been break-ins, vandalism, or insurance claims at this property in the last 3 years? What carrier currently insures it and at what premium?
- What's the average days-on-market for RENTAL listings here right now (not sales)? A rising rental-DOM trend means longer vacancies and softer asking-rent achievability than the comps imply.
- What's the recent tenant-quality profile in this submarket — average credit score on applications, eviction rate, late-payment / NSF rate, and stable-employment percentage? A property-management company in the area should have these aggregated.
- How much new apartment / multifamily construction is in the pipeline within 1–3 miles? Heavy new supply (>2% of stock underway) typically softens rents 12–24 months out; light construction supports rent growth.
Investment metrics
- 1% rule
- 1.05% ✓
- Cap rate
- 8.68%
- Cash-on-cash
- 8.53%
- DSCR
- 1.38
- GRM
- 7.9
CMA / ARV
No comps found within radius.
Projected returns pro-forma
1.38% appreciation · 3.0% rent growth · sell at horizon
- IRR
- 11.2%
- Equity multiple
- 1.59×
- Total profit
- $65,373
- Equity at exit
- $144,100
- IRR
- 14.6%
- Equity multiple
- 2.84×
- Total profit
- $205,934
- Equity at exit
- $197,750
Cash invested: $111,720 (down + closing). Projections, not guarantees.
Landlord ↔ Tenant lean methodology
- Overall (STATE)
- 18 Strongly Tenant-Friendly
- State California
- 18 Strongly Tenant-Friendly · D+13
- County
- — inherits STATE
- City
- — inherits STATE
ZIP-level market 96137
- Home prices YoY
- 0.9%
- Active inventory
- 240
- Price-to-rent
- 23.7×
Monthly cashflow live
- Estimated rent
- $4,204 medium interval (Pro) →
- Mortgage (P&I)
- −$2,092
- Tax from tax record
- −$268 /mo · $3,221/yr
- Insurance
- −$166
- HOA
- −$0
- Vacancy / Maint / Mgmt
- −$883
- Net cashflow
- $794
Break-even live
3-unit breakdown (identical units grouped — click to expand)
| Units | Beds | Baths | Est. rent |
|---|---|---|---|
| 1× unit | 2 | 2 | $1,401 |
| 2× units | 2 | 1 | $2,802 |
| #2 | 2 | 1 | $1,401 |
| #3 | 2 | 1 | $1,401 |
| Total (3 units) | $4,204 | ||
UW: 25.0% down · 7.5% · 30yr · 1.5% tax · 5.0% vac · 8.0% maint · 8.0% mgmt
Financing live
Cash to close
- Down payment
- $99,750
- Closing costs
- $11,970
- Reserves months
- —
- Total cash needed
- —
Loan-product check · same deal, 3 products live
Conventional
25% down · 7.5% · 30yr
- Down + closing
- —
- Monthly P&I
- —
- Monthly cashflow
- —
- DSCR
- —
- Eligible?
- —
Personal DTI + credit; lowest rate.
DSCR
20% down · 8.5% · 30yr
- Down + closing
- —
- Monthly P&I
- —
- Monthly cashflow
- —
- DSCR
- —
- Eligible?
- —
No personal income docs; deal must DSCR.
Hard money
10% down · 12.0% · 12mo
- Down + closing
- —
- Monthly P&I
- —
- Monthly cashflow
- —
- DSCR
- —
- Eligible?
- —
Short-term bridge; refi at stabilization.
Listing history 12 events
-
2026-06-19days on market $399,000 Active 17 DOM
-
2026-06-18days on market $399,000 Active 16 DOM
-
2026-06-17days on market $399,000 Active 15 DOM
-
2026-06-16days on market $399,000 Active 14 DOM
-
2026-06-15days on market $399,000 Active 13 DOM
-
2026-06-14days on market $399,000 Active 11 DOM
-
2026-06-12days on market $399,000 Active 10 DOM
-
2026-06-09days on market $399,000 Active 7 DOM
-
2026-06-08days on market $399,000 Active 6 DOM
-
2026-06-07days on market $399,000 Active 5 DOM
-
2026-06-03remarks 689-char remark
-
2026-06-03$399,000 Active 1 DOM
ⓘ Source: listings_history table (triggers on properties + properties_extension) + one-shot
backfill from property_details.listing_events for pre-trigger history.
Tax reassessment forecast CA · Resets to sale price
- Current annual tax
- $3,221 · $268/mo
- Projected year-2 tax
- $3,221 · $268/mo
- Expected delta
- $0/yr ($0/mo · 0.0%)
ⓘ Screening estimate from a state-policy table — verify with the county assessor before closing.
Climate risk First Street
- Flood 5/10 Major FEMA zone X (unshaded) · 24% chance over 30 yrs
- Wildfire 5/10 Major
- Heat 3/10 Moderate 6 d/yr ≥87°F today · 15 d/yr by 30 yrs out
- Wind 1/10 Low
- Air quality 10/10 Extreme 24 unhealthy d/yr today · 26 by 30 yrs out
Nearby sold comps map
Loading sold comps map…
Walkable amenities ~0.75 mi
Loading nearby amenities…
Taxation est. · year 1
- Rental income
- $50,448
- − Mortgage interest
- −$22,350
- − Property taxes
- −$3,221
- − Insurance
- −$1,995
- − Repairs & maintenance
- −$4,036
- − Management
- −$4,036
- − Depreciation
- −$11,607
- Taxable income
- $3,203
- Est. tax owed @ 24.0%
- −$769
- After-tax cash flow
- $8,760/yr
For passive investors: Depreciation is non-cash, so a rental often shows a tax loss while cash-flowing — sheltering income. Rental losses are passive: they offset passive income freely, and up to $25,000/yr can offset ordinary (W-2) income if you actively participate and your MAGI is under $100k (phasing out to $0 by $150k); unused losses carry forward. On sale, claimed depreciation is recaptured at up to 25%, and gains may owe capital-gains tax (a 1031 exchange can defer both). Figures are a year-1 estimate at your 24.0% rate — not tax advice; consult a CPA.
Schools (NCES district)
- District
- Westwood Unified
- NCES district ID
- 0642300
- Math proficiency
- 30% ▬ 0.00%
- Reading proficiency
- 35% ▼ -10.00%
- Median HH income
- $38,831
- Composite
- 29.93/100
- National rank
- #11664
- State rank
- #995 of 1400 in CA
Livability — Clear Creek
- Score
- 51/100
- State rank
- #1096
- US rank
- #25439
Category grades
Schools grade is shown separately in the Schools card above.
Census & demographics
- Census place
- Clear Creek, CA
- Population (ZIP)
- 2,717
Population outlook (Lassen County) Hauer SSP2
- Today (2025)
- 27,112 people
- By 2030
- 26,732 · -1.4%
- By 2040
- 25,536 · -5.8%
- By 2050
- 23,262 · -14.2%
- By 2075
- 18,620 · -31.3%
- By 2100
- 14,679 · -45.9%
Race, ethnicity, and origin ACS 2023
- Neighborhood character
- Predominantly White (81%)
- Race & ethnicity
- White 81% Hispanic / Latino 10% Two or more races 8% Native American 4%
- Hispanic origin (detail)
- Mexican 5%
- Common ancestry
- Slovak 4% Lithuanian 3% Italian 2%
- Foreign-born
- 4% · Canada
- Languages at home
- 93% English-only · Spanish 5% Other Indo-European 1%
Political lean MEDSL · Lassen
- 2024 margin
- Solid R (+54.0) · D 21.8% · R 75.8% · Other 2.4%
- 2008→2024 swing
- -19.8pp toward R · 2008: -34.2pp · 2024: -54.0pp
- All cycles
- 2024: R+54.0 2020: R+51.5 2016: R+51.3 2012: R+39.8 2008: R+34.2
Not yet ingested
- Civics
- —
Market trends
- HPI YoY
- ▲ 1.38%
- Current HPI
- 153.1005
- Rent YoY
- —
- Metro
- —
- State GDP YoY
- ▲ 3.21%
- F500 in state
- 116
Industry mix (Fortune 500 HQ in CA)
| Industry | F500 HQs | Revenue |
|---|---|---|
| Technology | 27 | $1,492B |
|
||
| Financial Services | 3 | $174B |
|
||
| Retail | 3 | $44B |
|
||
| Insurance | 3 | $26B |
|
||
| Media / Entertainment | 2 | $115B |
|
||
| Pharmaceuticals / Biotech | 2 | $62B |
|
||
Price history
+33.0% since first listed5 events — show timeline
- 2026-06-02 Listed $399,000 PAR
- 2022-10-07 Sold (MLS) $300,000 PAR
- 2022-09-27 Delisted — PAR
- 2022-08-29 Delisted — PAR
- 2022-08-19 Listed $299,900 PAR
Property tax history
+7.7%/yrLatest (2025): $3,221 · +1.9% YoY. Source: county tax records.
Cash-flow waterfall
monthlySold comps — $/sqft
last 12 mo · ≤1 miLoading sold comps…