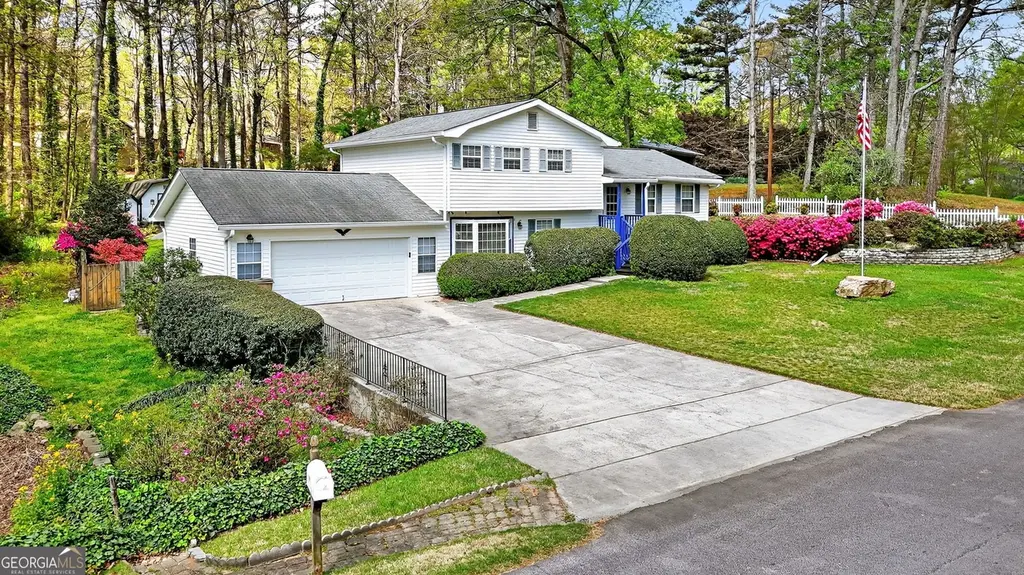
385 Charlotte Blvd · Stockbridge, GA
Flood risk 1/10 · Minimal
- FEMA flood zone
- X (unshaded)
- Chance of flooding over 30 yrs
- 0.0%
- Est. flood insurance / yr
- $507 – $1,088
Fire risk 2/10 · Minimal
- Est. fire insurance / yr
- $963 – $1,789
Heat risk 6/10 · Moderate
- Hot days now (above 106°F)
- 7 days/yr
- Hot days in 30 yrs
- 17 days/yr
Wind risk 6/10 · Moderate
- Chance of severe wind over 30 yrs
- 27.0%
Air-quality risk 4/10 · Minor
- Unhealthy air days now
- 4 days/yr
- Unhealthy air days in 30 yrs
- 6 days/yr
Risk factors via First Street. Map © Google.
Why this score? — see what drove the C+ grade
The composite is a weighted blend of 9 inputs, each scored 0–100. Each bar is that input's sub-score; the figure is the points it added to the 100-point composite (weight × sub-score).
- Cash flow +25.7/30.0
- ARV discount +10.0/15.0
- DSCR +8.6/10.0
- 1% rule +5.5/10.0
- Livability +3.0/5.0
- Rent growth +2.7/5.0
- Schools +2.6/10.0
- Condition / age +2.5/5.0
- Appreciation +0.0/10.0
$199,900
🖨 Deal sheet (PDF) 📄 Offer letter ✓ Due diligence
Listing remarks
just a walk in the Park! Literally in this park like setting, most cared for 3 bed 2 bath home in town with views of backyard oasis beautifully landscape to enjoy from dining, kitchen & sunroom, with multiple storage buildings that remain with property and also include a Gazebo, pergola to sip tea in the cool of the evenings! Don't miss this one schedule your viewing today! All of this Beauty makes this a Great Value! There is also 2 furry friends that remain with property for new owners, they are part of the landscape as they have lived there for approx 34 years!
Key facts
- Gazebo
- Backyard oasis
- Pergola
Tags
Neighborhood map
What this means for you Summary
Snapshot
- This is a 3-bed/2.0-bath single-family listed at $200k.
Deal economics
- At list price, monthly cash flow is $477 ($6k/yr) — positive.
- The deal already cash-flows at list — no discount required.
- Meets the 1% rule at list price ($2k rent vs $200k).
- Cap rate 9.2% vs local median 4.2% in Stockbridge — top-decile yield for the area; either an underpriced asset or a hidden risk that comps aren't pricing in. Stress-test before assuming the spread holds.
Location & tenants
- Location reads 60/100 on livability (#389 in GA) — a middle-class / working-renter tenant base. Strengths: housing A+, cost of living A; Watch: crime D, amenities F, commute F.
- Henry County (rural): math 24% / reading 33% proficiency, ranked #89 of 174 in GA (top 51%) — low school quality limits family demand, transient renter base, plan for 1-2y turnover.
- Zoned schools: Cotton Indian Elementary School (math 10% / reading 18%, grade F, #1,025 of 1,228 statewide, top 84%, 573 students, 67% FRL); Stockbridge Middle School (math 11% / reading 22%, grade F, #388 of 470 statewide, top 83%, 611 students, 70% FRL); Stockbridge High School (math 5% / reading 28%, grade F, #284 of 424 statewide, top 67%, 1,543 students, 54% FRL) — zoned schools average 64% FRL vs 43% district-wide (21 pts higher); higher-poverty schools than district average — tighter screening recommended.
- Zoned-school proficiency averages 16% at this address vs 28% district-wide (-13 pts) — the specific schools serving this property underperform the Henry County average; the district grade overstates school quality for this exact location.
- Market conditions: Rents flat; 611 active listings in the ZIP; 7 comparable units currently listed for rent nearby; rentals lingering (median 46d on market — plan ~5-8 weeks vacancy on turnover, expect pricing pressure); 57% of comp listings sitting > 30 days — soft ceiling on asking rent; 1,989 units permitted in Henry County in 2024 (92 in 5+ unit buildings).
- This rent runs 35% of the median local income ($71k/yr) — at the standard rent-burdened threshold; future hikes will face affordability resistance.
Forward outlook
- Local home prices are declining (-3.0%/yr); year-one equity from $1k of loan paydown is wiped out by about $6k of value loss. Plan a longer hold.
- Henry County population projected at +29% by 2050 — long-run rental-demand tailwind backs the buy-and-hold thesis.
Negotiation context
- Only 5 days on market — expect competitive offers; lowballing is unlikely to land.
- Current owner paid $70k; list at $200k implies a 186% gain — meaningful room to come down on a strong offer.
Risks & watch-outs
- Climate carrying-cost: major wind risk, 27% chance of damaging wind over 30y; extreme-heat days projected 7→17/yr by 2055 (HVAC capex compounding) — expect insurance premiums to compound above CPI over the hold.
Questions for the listing agent
- Is there a deadline driving the sale (1031 exchange, divorce, estate, relocation)? That informs how much negotiation room exists.
- Schools are D-rated, which usually means shorter tenancies and higher turnover. Who's the typical renter profile here, and what's been the actual vacancy rate?
- Crime grade is D in this area — have there been break-ins, vandalism, or insurance claims at this property in the last 3 years? What carrier currently insures it and at what premium?
- What's the average days-on-market for RENTAL listings here right now (not sales)? A rising rental-DOM trend means longer vacancies and softer asking-rent achievability than the comps imply.
- What's the recent tenant-quality profile in this submarket — average credit score on applications, eviction rate, late-payment / NSF rate, and stable-employment percentage? A property-management company in the area should have these aggregated.
- How much new for-sale + rental construction is in the pipeline within 1–3 miles? Heavy new supply typically softens prices + rents 12–24 months out; constrained supply supports both.
Investment metrics
- 1% rule
- 1.05% ✓
- Cap rate
- 9.16%
- Cash-on-cash
- 10.24%
- DSCR
- 1.46
- GRM
- 7.9
CMA / ARV
- ARV (on-the-fly)
- $211,584
- Comps found
- 7
Show comp detail 7 sales within ~0.75 mi
| Address | Dist | Beds/Ba | Sqft | Sold | Price | $/sf | Match |
|---|---|---|---|---|---|---|---|
| 295 Pinehurst Dr | 0.36mi | 3/2.0 | 1,770 (-3%) | 11mo | $201,000 | $114 | 69 |
| 80 Valley Dr | 0.52mi | 3/2.5 | 1,821 (-0%) | 12mo | $255,000 | $140 | 64 |
| 115 Charolette Blvd | 0.27mi | 3/2.0 | 1,615 (-12%) | 6mo | $188,000 | $116 | 64 |
| 315 Charlotte Blvd | 0.11mi | 3/2.0 | 1,566 (-14%) | 9mo | $202,000 | $129 | 63 |
| 400 Charlotte Blvd | 0.06mi | 3/2.5 | 1,995 (+9%) | 20mo | $339,000 | $170 | 63 |
| 290 Charlotte Blvd | 0.16mi | 3/2.0 | 1,648 (-10%) | 17mo | $168,000 | $102 | 62 |
| 416 E 416 Hwy Hwy | 0.66mi | 3/2.0 | 1,808 (-1%) | 18mo | $133,000 | $74 | 53 |
Match score weights: distance 35% · size 25% · config 20% · recency 20%. Top-matched comps best support the ARV.
Projected returns pro-forma
-3.0% appreciation · 0.87% rent growth · sell at horizon
- IRR
- -3.1%
- Equity multiple
- 0.88×
- Total profit
- $-6,479
- Equity at exit
- $29,806
- IRR
- 4.2%
- Equity multiple
- 1.28×
- Total profit
- $15,823
- Equity at exit
- $17,284
Cash invested: $55,972 (down + closing). Projections, not guarantees.
Landlord ↔ Tenant lean methodology
- Overall (STATE)
- 90 Strongly Landlord-Friendly
- State Georgia
- 90 Strongly Landlord-Friendly · R+3
- County
- — inherits STATE
- City
- — inherits STATE
ZIP-level market 30281
- Home prices YoY
- -33.6%
- Rents YoY
- 0.9%
- Active inventory
- 611
- Price-to-rent
- 7.9×
Monthly cashflow live
- Estimated rent
- $2,099 high interval (Pro) →
- Mortgage (P&I)
- −$1,048
- Tax from tax record
- −$49 /mo · $594/yr
- Insurance
- −$83
- HOA
- −$0
- Vacancy / Maint / Mgmt
- −$441
- Net cashflow
- $477
Break-even live
Sensitivity live
| Price | -10% $591 | -5% $534 | +0% $477 | +5% $421 | +10% $364 |
|---|---|---|---|---|---|
| Rent | -10% $312 | -5% $395 | +0% $477 | +5% $560 | +10% $643 |
| Rate | -1.0pp $578 | -0.5pp $528 | base $477 | +0.5pp $426 | +1.0pp $373 |
UW: 25.0% down · 7.5% · 30yr · 1.5% tax · 5.0% vac · 8.0% maint · 8.0% mgmt
Financing live
Cash to close
- Down payment
- $49,975
- Closing costs
- $5,997
- Reserves months
- —
- Total cash needed
- —
Loan-product check · same deal, 3 products live
Conventional
25% down · 7.5% · 30yr
- Down + closing
- —
- Monthly P&I
- —
- Monthly cashflow
- —
- DSCR
- —
- Eligible?
- —
Personal DTI + credit; lowest rate.
DSCR
20% down · 8.5% · 30yr
- Down + closing
- —
- Monthly P&I
- —
- Monthly cashflow
- —
- DSCR
- —
- Eligible?
- —
No personal income docs; deal must DSCR.
Hard money
10% down · 12.0% · 12mo
- Down + closing
- —
- Monthly P&I
- —
- Monthly cashflow
- —
- DSCR
- —
- Eligible?
- —
Short-term bridge; refi at stabilization.
Rent comps 7 comps
| Address | Beds | Baths | Sqft | Rent | $/sqft | DOM | Units | Dist |
|---|---|---|---|---|---|---|---|---|
| 245 Pinehurst Dr Stockbridge, GA | 3.0 | 2.0 | 1340 | $1,706 | $1.27 | 45d | 1 | 0.38mi |
| 120 Old Conyers Dr Stockbridge, GA | 3.0 | 2.5 | 2573 | $2,875 | $1.12 | 24d | 1 | 0.73mi |
| 120 Old Conyers Dr Stockbridge, GA | 3.0 | 2.5 | 2573 | $3,000 | $1.17 | 45d | 1 | 0.73mi |
| 217 Briarpatch Ct Stockbridge, GA | 3.0 | 2.0 | 1228 | $1,995 | $1.62 | 45d | 1 | 0.75mi |
| 10 Glenwood Way Stockbridge, GA | 1.0–3.0 | 1.0–2.0 | 981 | $1,821 | $1.86 | 0d | 21 | 0.84mi |
| 119 Lambert Dr Stockbridge, GA | 3.0 | 2.0 | 1392 | $1,800 | $1.29 | 6d | 1 | 0.95mi |
| 141 Edison Dr Stockbridge, GA | 3.0 | 2.5 | 1621 | $1,701 | $1.05 | 45d | 1 | 1.50mi |
Listing history 4 events
-
2026-04-07status Under Contract
-
2026-03-13$199,900 New
-
1992-02-06soldstatus $70,000
-
1989-06-23soldstatus $68,000
ⓘ Source: listings_history table (triggers on properties + properties_extension) + one-shot
backfill from property_details.listing_events for pre-trigger history.
Tax reassessment forecast GA · Resets to sale price
- Current annual tax
- $594 · $49/mo
- Projected year-2 tax
- $1,839 · $153/mo
- Expected delta
- +$1,245/yr (+$104/mo · 209.7%)
ⓘ Screening estimate from a state-policy table — verify with the county assessor before closing.
Climate risk First Street
- Flood 1/10 Low FEMA zone X (unshaded) · 0% chance over 30 yrs
- Wildfire 2/10 Low
- Heat 6/10 Major 7 d/yr ≥106°F today · 17 d/yr by 30 yrs out
- Wind 6/10 Major 27% chance of damaging wind over 30 yrs
- Air quality 4/10 Moderate 4 unhealthy d/yr today · 6 by 30 yrs out
Nearby sold comps map
Loading sold comps map…
Walkable amenities ~0.75 mi
Loading nearby amenities…
Taxation est. · year 1
- Rental income
- $25,193
- − Mortgage interest
- −$11,198
- − Property taxes
- −$594
- − Insurance
- −$1,000
- − Repairs & maintenance
- −$2,015
- − Management
- −$2,015
- − Depreciation
- −$5,815
- Taxable income
- $2,556
- Est. tax owed @ 24.0%
- −$614
- After-tax cash flow
- $5,116/yr
For passive investors: Depreciation is non-cash, so a rental often shows a tax loss while cash-flowing — sheltering income. Rental losses are passive: they offset passive income freely, and up to $25,000/yr can offset ordinary (W-2) income if you actively participate and your MAGI is under $100k (phasing out to $0 by $150k); unused losses carry forward. On sale, claimed depreciation is recaptured at up to 25%, and gains may owe capital-gains tax (a 1031 exchange can defer both). Figures are a year-1 estimate at your 24.0% rate — not tax advice; consult a CPA.
Schools (NCES district)
- District
- Henry County
- NCES district ID
- 1302820
- Math proficiency
- 24% ▼ -9.00%
- Reading proficiency
- 33% ▼ -7.00%
- Median HH income
- $62,594
- Composite
- 26.13/100
- National rank
- #7279
- State rank
- #89 of 174 in GA
Livability — Stockbridge
- Score
- 60/100
- State rank
- #389
- US rank
- #19479
Category grades
Schools grade is shown separately in the Schools card above.
Census & demographics
- County
- Henry County · 316,359 people
- City population
- 71,603
- Metro
- Atlanta-Sandy Springs-Alpharetta, GA
- Population (ZIP)
- 71,603
- Household income
- $71,213
- Rent vs Own
- Severe rent burden
- 2464.0
Population outlook (Henry County) Hauer SSP2
- Today (2025)
- 249,041 people
- By 2030
- 264,369 · +6.2%
- By 2040
- 294,459 · +18.2%
- By 2050
- 322,249 · +29.4%
- By 2075
- 392,310 · +57.5%
- By 2100
- 437,836 · +75.8%
Race, ethnicity, and origin ACS 2023
- Neighborhood character
- Diverse neighborhood (Simpson 0.61)
- Race & ethnicity
- Black 55% White 28% Hispanic / Latino 11% Two or more races 6% Asian 4%
- Hispanic origin (detail)
- Mexican 7%
- Common ancestry
- Hispanic 1% Italian 1% Romanian 1%
- Foreign-born
- 9% · Canada, Vietnam
- Languages at home
- 86% English-only · Spanish 8% Vietnamese 2% French/Haitian/Cajun 1%
Political lean MEDSL · Henry
- 2024 margin
- Strong D (+29.7) · D 64.5% · R 34.9%
- 2008→2024 swing
- +37.1pp toward D · 2008: -7.5pp · 2024: 29.7pp
- All cycles
- 2024: D+29.7 2020: D+20.5 2016: D+4.3 2012: R+3.2 2008: R+7.5
Not yet ingested
- Civics
- —
Market trends
- HPI YoY
- ▼ -104.76%
- Current HPI
- 207.2332
- Rent YoY
- ▲ 0.87%
- Metro
- Atlanta-Sandy Springs-Alpharetta, GA
- State GDP YoY
- ▲ 2.66%
- F500 in state
- 28
Industry mix (Fortune 500 HQ in GA)
| Industry | F500 HQs | Revenue |
|---|---|---|
| Paper / Packaging | 2 | $29B |
|
||
| Retail | 1 | $160B |
|
||
| Transportation / Logistics | 1 | $91B |
|
||
| Airlines | 1 | $62B |
|
||
| Consumer Goods | 1 | $47B |
|
||
| Utilities | 1 | $25B |
|
||
Price history
+194.0% since first listed4 events — show timeline
- 2026-04-07 Pending — GAMLS
- 2026-03-13 Listed $199,900 GAMLS
- 1992-02-06 Sold (Public Records) $70,000 Public Records
- 1989-06-23 Sold (Public Records) $68,000 Public Records
Property tax history
+2.2%/yrLatest (2024): $594 · +66.9% YoY. Source: county tax records.
Cash-flow waterfall
monthlySold comps — $/sqft
last 12 mo · ≤1 miLoading sold comps…