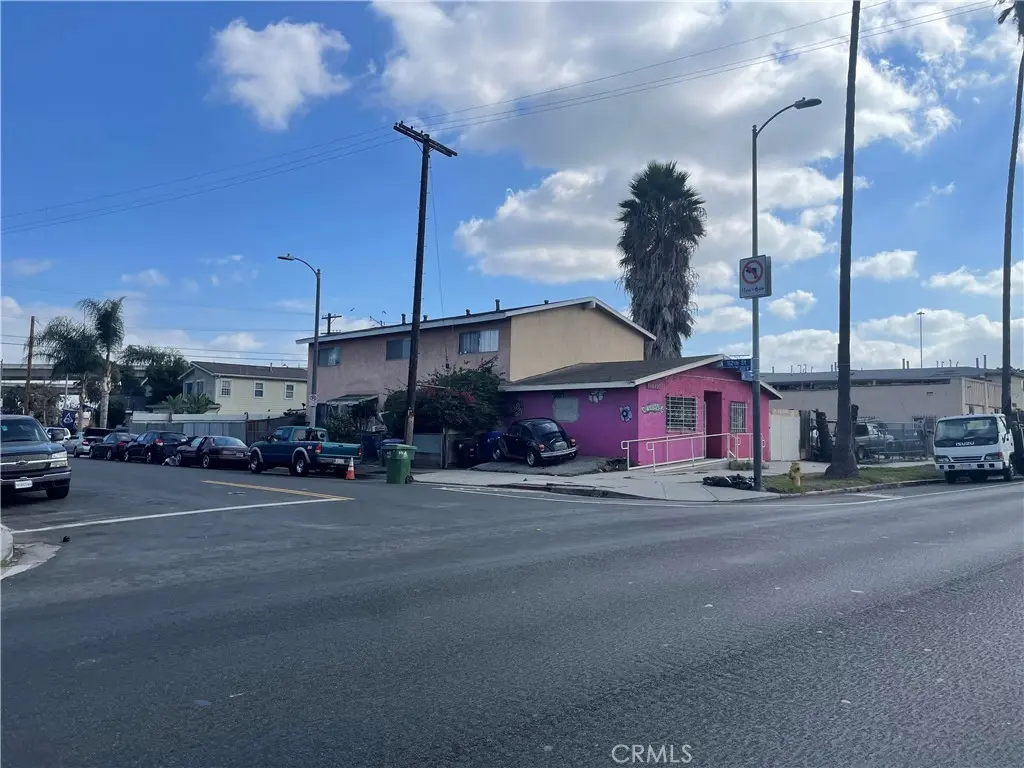
 Fourplex
442 112th St W · Los Angeles, CA
Flood risk 1/10 · Minimal
- FEMA flood zone
- X (unshaded)
- Chance of flooding over 30 yrs
- 0.0%
- Est. flood insurance / yr
- $507 – $1,088
Fire risk 1/10 · Minimal
- Est. fire insurance / yr
- $659 – $1,223
Heat risk 5/10 · Moderate
- Hot days now (above 89°F)
- 7 days/yr
- Hot days in 30 yrs
- 22 days/yr
Wind risk 1/10 · Minimal
- Chance of severe wind over 30 yrs
- —
Air-quality risk 5/10 · Moderate
- Unhealthy air days now
- 7 days/yr
- Unhealthy air days in 30 yrs
- 7 days/yr
Risk factors via First Street. Map © Google.
Why this score? — see what drove the B grade
The composite is a weighted blend of 9 inputs, each scored 0–100. Each bar is that input's sub-score; the figure is the points it added to the 100-point composite (weight × sub-score).
- Cash flow +29.2/30.0
- ARV discount +15.0/15.0
- DSCR +10.0/10.0
- 1% rule +8.2/10.0
- Schools +3.6/10.0
- Livability +3.4/5.0
- Rent growth +2.5/5.0
- Condition / age +2.2/5.0
- Appreciation +0.0/10.0
$795,000
🖨 Deal sheet 📄 Offer letter ✓ Due diligence
Multi-family units
County records classify this as Multi-Family (2-4 Unit). Listing-text estimate: 4 units. confirmed
Listing remarks MLS
Price Reduction!!!!!Fourplex Property with Mixed-Use Potential | Zoned LAR3, Fantastic investment opportunity! This corner-lot fourplex features three residential units—each a spacious two-story, 2-bedroom, 1.5-bathroom layout—all currently occupied, plus a street-front commercial unit along Figueroa Street that will be delivered vacant (previously a flower shop). The property offers strong upside potential thanks to below-market rents and the opportunity to add value through improvements. A large backyard with alley access provides additional flexibility for parking or future enhancements. Perfectly situated just off the I-110 and 105 (Imperial Highway), this property is minutes from Figueroa Elementary School, public transportation, Downtown Los Angeles, Inglewood’s SoFi Stadium, and Southern California’s world-famous beaches. Don’t miss this opportunity to own a prime income property in the heart of Los Angeles—ideal for investors seeking long-term growth, redevelopment potential, or mixed-use income opportunities.
Key facts
- Zoned lar3
- Alley access
- Large backyard
Tags
Neighborhood map
What this means for you Summary
Snapshot
- This is a 3×2bd/1.5ba + 1×?bd/?ba units multifamily listed at $795k. Condition is rated fair.
Deal economics
- At list price, monthly cash flow is $3k ($33k/yr) — positive. Per door: $695/mo.
- The deal already cash-flows at list — no discount required.
- Meets the 1% rule at list price ($10k rent vs $795k).
- Recommended offer: $700k (12.0% below list) — sets the bar for market timing.
- Cap rate 10.5% vs local median 2.1% in Los Angeles — top-decile yield for the area; either an underpriced asset or a hidden risk that comps aren't pricing in. Stress-test before assuming the spread holds.
Location & tenants
- Location reads 68/100 on livability (#273 in CA) — a middle-class / working-renter tenant base. Strengths: amenities A+, commute A+, employment B; Watch: health & safety C-, schools D+, crime F.
- Los Angeles Unified (urban): math 29% / reading 54% proficiency, ranked #223 of 517 in CA (top 43%) — families likely to look elsewhere, expect single-tenant / working-renter base with shorter leases; 67% free/reduced lunch — lower-income household profile, screen leases tightly.
- Market conditions: 36 active listings in the ZIP; 19,697 units permitted in Los Angeles County in 2024 (9,426 in 5+ unit buildings).
- At $10,475/mo this rent would consume 206% of the median local household income ($61k/yr) (locally 1975% of renters already pay >50% of income on rent) — very limited rent-growth headroom before tenants either downsize or default.
Forward outlook
- Local home prices are declining (-3.0%/yr); year-one equity from $5k of loan paydown is wiped out by about $24k of value loss. Plan a longer hold.
- Los Angeles County population projected at +9% by 2050 — modest demand growth; plan on rents tracking national, not racing it.
- At projected returns (-3.0% appreciation + 3.0% rent growth), your $223k cash investment doubles in ~8 years — after that, you're playing with house money.
Negotiation context
- It's been on market 220 days — a 12% lower offer ($700k) is reasonable based on typical stale-listing flexibility.
- 2 sale attempts since 3y ago; this cycle's ask has dropped $54k (6%) from the opening price — seller is motivated, your offer sets the floor, not the list.
Risks & watch-outs
- Climate carrying-cost: extreme-heat days projected 7→22/yr by 2055 (HVAC capex compounding) — expect insurance premiums to compound above CPI over the hold.
Questions for the listing agent
- It's been on market 220 days. Have you received any prior offers? Is the seller open to a 12% concession, seller financing, or rate buy-down credit?
- Can we see the unit-by-unit rent roll, current vacancy, and any below-market leases? What's the average tenancy length?
- What capital expenditures (roof, boiler, parking lot, exteriors) have been made in the last 5 years, and what's planned in the next 2?
- Have any recent inspections been done? Can we get a copy of the seller's disclosures and any deferred-maintenance estimates?
- Built in 1960 — when were the roof, HVAC, electrical panel, plumbing, and water heater last replaced?
- Why hasn't it sold? Are there any deal-killer items the seller is aware of (foundation, flood, title, zoning, code violations)?
- Is there a deadline driving the sale (1031 exchange, divorce, estate, relocation)? That informs how much negotiation room exists.
- Schools are D-rated, which usually means shorter tenancies and higher turnover. Who's the typical renter profile here, and what's been the actual vacancy rate?
- Crime grade is F in this area — have there been break-ins, vandalism, or insurance claims at this property in the last 3 years? What carrier currently insures it and at what premium?
- What's the average days-on-market for RENTAL listings here right now (not sales)? A rising rental-DOM trend means longer vacancies and softer asking-rent achievability than the comps imply.
- What's the recent tenant-quality profile in this submarket — average credit score on applications, eviction rate, late-payment / NSF rate, and stable-employment percentage? A property-management company in the area should have these aggregated.
- How much new apartment / multifamily construction is in the pipeline within 1–3 miles? Heavy new supply (>2% of stock underway) typically softens rents 12–24 months out; light construction supports rent growth.
Investment metrics
- 1% rule
- 1.32% ✓
- Cap rate
- 10.49%
- Cash-on-cash
- 14.99%
- DSCR
- 1.67
- GRM
- 6.3
CMA / ARV
- ARV (median comp)
- $954,368
- List price
- $795,000
- Delta
- -16.70%
- Verdict
- UNDERPRICED
- Comps
- 20 within 1.0 mi
Show comp detail 1 sale within ~0.75 mi
| Address | Dist | Beds/Ba | Sqft | Sold | Price | $/sf | Match |
|---|---|---|---|---|---|---|---|
| 409 E 104th | 0.64mi | 24/12.0 | 3,540 (+5%) | 6mo | $1,375,000 | $388 | 36 |
Match score weights: distance 35% · size 25% · config 20% · recency 20%. Top-matched comps best support the ARV.
Projected returns pro-forma
-3.0% appreciation · 3.0% rent growth · sell at horizon
- IRR
- 5.6%
- Equity multiple
- 1.22×
- Total profit
- $48,469
- Equity at exit
- $118,537
- IRR
- 15.0%
- Equity multiple
- 2.22×
- Total profit
- $270,938
- Equity at exit
- $68,737
Cash invested: $222,600 (down + closing). Projections, not guarantees.
Landlord ↔ Tenant lean methodology
- Overall (CITY)
- 0 Strongly Tenant-Friendly
- State California
- 18 Strongly Tenant-Friendly · D+13
- County
- — inherits STATE
- City Los Angeles
- 0 Strongly Tenant-Friendly · D+22
ZIP-level market 90061
- Active inventory
- 36
- Price-to-rent
- 24.9×
Monthly cashflow live
- Estimated rent
- $10,475 high interval (Pro) →
- Mortgage (P&I)
- −$4,169
- Tax est. 1.5%
- −$994 /mo · $11,925/yr
- Insurance
- −$331
- HOA
- −$0
- Vacancy / Maint / Mgmt
- −$2,200
- Net cashflow
- $2,781
Break-even live
4-unit breakdown (identical units grouped — click to expand)
| Units | Beds | Baths | Est. rent |
|---|---|---|---|
| 3× units | 2 | 1.5 | $7,980 |
| #1 | 2 | 1.5 | $2,660 |
| #2 | 2 | 1.5 | $2,660 |
| #3 | 2 | 1.5 | $2,660 |
| 1× unit | 0 | 0 | $2,494 |
| Total (4 units) | $10,475 | ||
UW: 25.0% down · 7.5% · 30yr · 1.5% tax · 5.0% vac · 8.0% maint · 8.0% mgmt
Financing live
Cash to close
- Down payment
- $198,750
- Closing costs
- $23,850
- Reserves months
- —
- Total cash needed
- —
Loan-product check · same deal, 3 products live
Conventional
25% down · 7.5% · 30yr
- Down + closing
- —
- Monthly P&I
- —
- Monthly cashflow
- —
- DSCR
- —
- Eligible?
- —
Personal DTI + credit; lowest rate.
DSCR
20% down · 8.5% · 30yr
- Down + closing
- —
- Monthly P&I
- —
- Monthly cashflow
- —
- DSCR
- —
- Eligible?
- —
No personal income docs; deal must DSCR.
Hard money
10% down · 12.0% · 12mo
- Down + closing
- —
- Monthly P&I
- —
- Monthly cashflow
- —
- DSCR
- —
- Eligible?
- —
Short-term bridge; refi at stabilization.
Listing history 4 events
-
2026-01-20price $795,000 1071-char remark
Show marketing remark (1071 chars)
Price Reduction!!!!!Fourplex Property with Mixed-Use Potential | Zoned LAR3, Fantastic investment opportunity! This corner-lot fourplex features three residential units—each a spacious two-story, 2-bedroom, 1.5-bathroom layout—all currently occupied, plus a street-front commercial unit along Figueroa Street that will be delivered vacant (previously a flower shop). The property offers strong upside potential thanks to below-market rents and the opportunity to add value through improvements. A large backyard with alley access provides additional flexibility for parking or future enhancements. Perfectly situated just off the I-110 and 105 (Imperial Highway), this property is minutes from Figueroa Elementary School, public transportation, Downtown Los Angeles, Inglewood’s SoFi Stadium, and Southern California’s world-famous beaches. Don’t miss this opportunity to own a prime income property in the heart of Los Angeles—ideal for investors seeking long-term growth, redevelopment potential, or mixed-use income opportunities.
-
2025-10-21$849,000 Active 1071-char remark
Show marketing remark (1071 chars)
Price Reduction!!!!!Fourplex Property with Mixed-Use Potential | Zoned LAR3, Fantastic investment opportunity! This corner-lot fourplex features three residential units—each a spacious two-story, 2-bedroom, 1.5-bathroom layout—all currently occupied, plus a street-front commercial unit along Figueroa Street that will be delivered vacant (previously a flower shop). The property offers strong upside potential thanks to below-market rents and the opportunity to add value through improvements. A large backyard with alley access provides additional flexibility for parking or future enhancements. Perfectly situated just off the I-110 and 105 (Imperial Highway), this property is minutes from Figueroa Elementary School, public transportation, Downtown Los Angeles, Inglewood’s SoFi Stadium, and Southern California’s world-famous beaches. Don’t miss this opportunity to own a prime income property in the heart of Los Angeles—ideal for investors seeking long-term growth, redevelopment potential, or mixed-use income opportunities.
-
2024-05-07historical
-
2023-09-13$849,000 Active
ⓘ Source: listings_history table (triggers on properties + properties_extension) + one-shot
backfill from property_details.listing_events for pre-trigger history.
Climate risk First Street
- Flood 1/10 Low FEMA zone X (unshaded) · 0% chance over 30 yrs
- Wildfire 1/10 Low
- Heat 5/10 Major 7 d/yr ≥89°F today · 22 d/yr by 30 yrs out
- Wind 1/10 Low
- Air quality 5/10 Major 7 unhealthy d/yr today · 7 by 30 yrs out
Nearby sold comps map
Loading sold comps map…
Walkable amenities ~0.75 mi
Loading nearby amenities…
Taxation est. · year 1
- Rental income
- $125,700
- − Mortgage interest
- −$44,532
- − Property taxes
- −$11,925
- − Insurance
- −$3,975
- − Repairs & maintenance
- −$10,056
- − Management
- −$10,056
- − Depreciation
- −$23,127
- Taxable income
- $22,028
- Est. tax owed @ 24.0%
- −$5,287
- After-tax cash flow
- $28,087/yr
For passive investors: Depreciation is non-cash, so a rental often shows a tax loss while cash-flowing — sheltering income. Rental losses are passive: they offset passive income freely, and up to $25,000/yr can offset ordinary (W-2) income if you actively participate and your MAGI is under $100k (phasing out to $0 by $150k); unused losses carry forward. On sale, claimed depreciation is recaptured at up to 25%, and gains may owe capital-gains tax (a 1031 exchange can defer both). Figures are a year-1 estimate at your 24.0% rate — not tax advice; consult a CPA.
Condition & rehab AI · 7 photos
This fourplex requires significant repairs and maintenance, including repainting, re-roofing, and flooring replacement, to improve its condition and value.
Repairs flagged
- Major Exterior siding — Significant wear and tear
- Major Roof — Aged and showing signs of wear
- Major Flooring — Exposed subflooring suggests structural damage
- Major Paint — Painted walls appear dull and worn
Value-add opportunities
- Both Painting and repainting the exterior and interior — Enhances curb appeal and interior aesthetics
- Both Re-roofing — Improves structural integrity and enhances curb appeal
- Both Flooring replacement — Fixes structural damage and improves living conditions
- Both Landscaping and curb appeal improvements — Enhances property's visual appeal and value
Renovation cost estimate screening
| Repair item | Severity | Est. cost |
|---|---|---|
| Exterior siding · Significant wear and tear | Major | $15,000–50,000 |
| Roof · Aged and showing signs of wear | Major | $15,000–50,000 |
| Flooring · Exposed subflooring suggests structural damage | Major | $15,000–50,000 |
| Paint · Painted walls appear dull and worn | Major | $15,000–50,000 |
| Total estimated repair cost · 4 items | $60,000–200,000 |
Value-add ROI direction
- Both Painting and repainting the exterior and interior — Enhances curb appeal and interior aesthetics ↑
- Both Re-roofing — Improves structural integrity and enhances curb appeal ↑
- Both Flooring replacement — Fixes structural damage and improves living conditions ↑
- Both Landscaping and curb appeal improvements — Enhances property's visual appeal and value ↑
ⓘ Cost ranges are severity-bucket heuristics (US national rule-of-thumb). Get contractor quotes + a written scope before underwriting a rehab budget.
Schools (NCES district)
- District
- Los Angeles Unified
- NCES district ID
- 0622710
- Math proficiency
- 29% ▼ -4.00%
- Reading proficiency
- 54% ▲ 10.00%
- Median HH income
- $50,403
- Composite
- 35.67/100
- National rank
- #4875
- State rank
- #223 of 517 in CA
Livability — Los Angeles
- Score
- 68/100
- State rank
- #273
- US rank
- #9237
Category grades
Schools grade is shown separately in the Schools card above.
Census & demographics
- Census place
- Los Angeles, CA
- County
- Los Angeles County · 9,444,647 people
- City population
- 3,838,149
- Metro
- Los Angeles-Long Beach-Anaheim, CA
- Population (ZIP)
- 30,051
- Household income
- $61,046
- Rent vs Own
- Severe rent burden
- 1975.0
Population outlook (Los Angeles County) Hauer SSP2
- Today (2025)
- 10,940,515 people
- By 2030
- 11,256,481 · +2.9%
- By 2040
- 11,729,929 · +7.2%
- By 2050
- 11,948,407 · +9.2%
- By 2075
- 11,818,114 · +8.0%
- By 2100
- 10,842,928 · -0.9%
Race, ethnicity, and origin ACS 2023
- Neighborhood character
- Predominantly Hispanic (70%)
- Race & ethnicity
- Hispanic / Latino 70% Black 26% Two or more races 22% Native American 3% White 2%
- Hispanic origin (detail)
- Mexican 51%
- Common ancestry
- British 1%
- Foreign-born
- 32% · Canada, Jamaica
- Languages at home
- 38% English-only · Spanish 61%
Political lean MEDSL · Los Angeles
- 2024 margin
- Solid D (+32.9) · D 64.8% · R 31.9% · Other 3.3%
- 2008→2024 swing
- -7.4pp toward R · 2008: 40.4pp · 2024: 32.9pp
- All cycles
- 2024: D+32.9 2020: D+44.2 2016: D+48.0 2012: D+40.0 2008: D+40.4
Not yet ingested
- Civics
- —
Market trends
- HPI YoY
- ▼ -528.07%
- Current HPI
- 502.9923
- Rent YoY
- —
- Metro
- Los Angeles-Long Beach-Anaheim, CA
- State GDP YoY
- ▲ 3.21%
- F500 in state
- 116
Industry mix (Fortune 500 HQ in CA)
| Industry | F500 HQs | Revenue |
|---|---|---|
| Technology | 27 | $1,492B |
|
||
| Financial Services | 3 | $174B |
|
||
| Retail | 3 | $44B |
|
||
| Insurance | 3 | $26B |
|
||
| Media / Entertainment | 2 | $115B |
|
||
| Pharmaceuticals / Biotech | 2 | $62B |
|
||
Price history
-6.4% since first listed4 events — show timeline
- 2026-01-20 Price Changed $795,000 CRMLS
- 2025-10-21 Listed $849,000 CRMLS
- 2024-05-07 Listing Removed — CRMLS
- 2023-09-13 Listed $849,000 CRMLS
Cash-flow waterfall
monthlySold comps — $/sqft
last 12 mo · ≤1 miLoading sold comps…