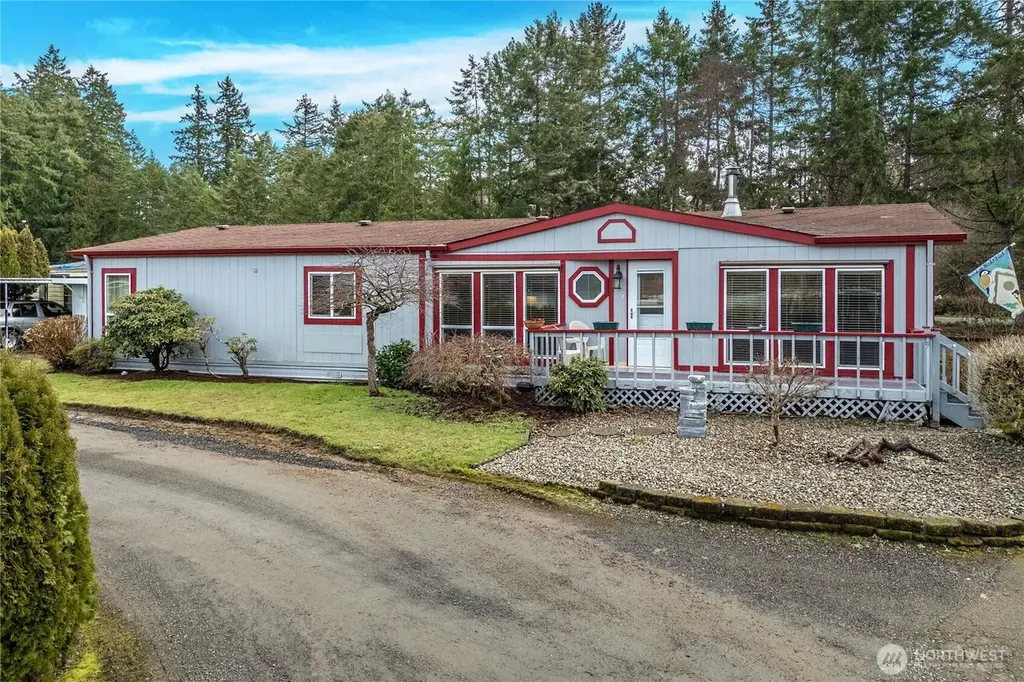
4806 Cushman Rd NE #116 · Olympia, WA
Flood risk 1/10 · Minimal
- FEMA flood zone
- X (unshaded)
- Chance of flooding over 30 yrs
- 0.0%
- Est. flood insurance / yr
- $507 – $1,088
Fire risk 2/10 · Minimal
- Est. fire insurance / yr
- $604 – $1,122
Heat risk 3/10 · Minor
- Hot days now (above 89°F)
- 7 days/yr
- Hot days in 30 yrs
- 14 days/yr
Wind risk 1/10 · Minimal
- Chance of severe wind over 30 yrs
- —
Air-quality risk 6/10 · Moderate
- Unhealthy air days now
- 6 days/yr
- Unhealthy air days in 30 yrs
- 7 days/yr
Risk factors via First Street. Map © Google.
Why this score? — see what drove the B+ grade
The composite is a weighted blend of 9 inputs, each scored 0–100. Each bar is that input's sub-score; the figure is the points it added to the 100-point composite (weight × sub-score).
- Cash flow +30.0/30.0
- ARV discount +12.4/15.0
- 1% rule +10.0/10.0
- DSCR +10.0/10.0
- Schools +6.2/10.0
- Livability +4.2/5.0
- Rent growth +3.4/5.0
- Condition / age +2.5/5.0
- Appreciation +0.0/10.0
$147,000
🖨 Deal sheet (PDF) 📄 Offer letter ✓ Due diligence
Listing remarks
Welcome to spacious and comfortable 55+ living in Seashore Villa, a sought-after community near Boston Harbor. This beautifully maintained 3-bedroom, 1.75-bath home with 1,680 SF sits on a desirable corner lot and offers an ideal blend of space, functionality, and lifestyle amenities. The expansive living room provides ample room to relax or entertain, while the light-filled eat-in kitchen features a skylight, generous counter and cabinet space, a large pantry, built-in desk, and all stainless steel appliances included. The kitchen flows seamlessly into a cozy den with a wood-burning fireplace—perfect for reading, hobbies, or gatherings. The spacious primary suite includes a large clo
Key facts
- Private bath
- Soaking tub
- Walk-in shower
Tags
Neighborhood map
What this means for you Summary
Snapshot
- This is a 3-bed/2.0-bath manufactured listed at $147k.
Deal economics
- At list price, monthly cash flow is $1k ($12k/yr) — positive.
- The deal already cash-flows at list — no discount required.
- Meets the 1% rule at list price ($3k rent vs $147k).
- Recommended offer: $129k (12.0% below list) — sets the bar for market timing.
- Cap rate 14.6% vs local median 2.4% in Olympia — top-decile yield for the area; either an underpriced asset or a hidden risk that comps aren't pricing in. Stress-test before assuming the spread holds.
Location & tenants
- Location reads 83/100 on livability (#58 in WA, #1,036 nationally) — a professional / high-income tenant draw. Strengths: amenities A+, commute A+, health & safety A+; Watch: crime F, cost of living D-.
- Olympia School District (urban): math 66% / reading 75% proficiency, ranked #17 of 291 in WA (top 6%) — strong family-tenant draw, lease renewals of 3-5y typical.
- Zoned schools: Boston Harbor Elementary (177 students, 19% FRL); Reeves Middle School (392 students, 39% FRL); Olympia High School (1,838 students, 21% FRL) — zoned schools at 26% FRL track the district average.
- Market conditions: Rents rising (+3.7%/yr); 149 active listings in the ZIP; 1 comparable units currently listed for rent nearby; solid renter incomes; 1,222 units permitted in Thurston County in 2024 (508 in 5+ unit buildings).
- This rent runs 34% of the median local income ($92k/yr) — at the standard rent-burdened threshold; future hikes will face affordability resistance.
Forward outlook
- Local home prices are declining (-3.0%/yr); year-one equity from $1k of loan paydown is wiped out by about $4k of value loss. Plan a longer hold.
- Thurston County population projected at +27% by 2050 — long-run rental-demand tailwind backs the buy-and-hold thesis.
- At projected returns (-3.0% appreciation + 3.7% rent growth), your $41k cash investment doubles in ~4 years — after that, you're playing with house money.
Negotiation context
- It's been on market 124 days — a 12% lower offer ($129k) is reasonable based on typical stale-listing flexibility.
- 3 sale attempts since 18y ago; this cycle's ask has dropped $22k (13%) from the opening price — seller is motivated, your offer sets the floor, not the list.
- Current owner paid $65k; list at $147k implies a 126% gain — meaningful room to come down on a strong offer.
Questions for the listing agent
- It's been on market 124 days. Have you received any prior offers? Is the seller open to a 12% concession, seller financing, or rate buy-down credit?
- Why hasn't it sold? Are there any deal-killer items the seller is aware of (foundation, flood, title, zoning, code violations)?
- Is there a deadline driving the sale (1031 exchange, divorce, estate, relocation)? That informs how much negotiation room exists.
- Schools are A-rated — typically a magnet for longer-tenancy family renters. What's the average tenant stay here, and is there a school-zone premium baked into asking?
- Crime grade is F in this area — have there been break-ins, vandalism, or insurance claims at this property in the last 3 years? What carrier currently insures it and at what premium?
- What's the average days-on-market for RENTAL listings here right now (not sales)? A rising rental-DOM trend means longer vacancies and softer asking-rent achievability than the comps imply.
- What's the recent tenant-quality profile in this submarket — average credit score on applications, eviction rate, late-payment / NSF rate, and stable-employment percentage? A property-management company in the area should have these aggregated.
- How much new for-sale + rental construction is in the pipeline within 1–3 miles? Heavy new supply typically softens prices + rents 12–24 months out; constrained supply supports both.
Investment metrics
- 1% rule
- 1.75% ✓
- Cap rate
- 14.57%
- Cash-on-cash
- 29.57%
- DSCR
- 2.32
- GRM
- 4.8
CMA / ARV
- ARV (median comp)
- $164,957
- List price
- $147,000
- Delta
- -10.89%
- Verdict
- UNDERPRICED
- Comps
- 9 within 1.0 mi
Show comp detail 10 sales within ~0.75 mi
| Address | Dist | Beds/Ba | Sqft | Sold | Price | $/sf | Match |
|---|---|---|---|---|---|---|---|
| 4806 NE Cushman Rd #101 | 0.10mi | 3/2.0 | 1,792 (+7%) | 1mo | $41,500 | $23 | 83 |
| 4806 Cushman Rd NE #162 | 0.10mi | 4/2.0 (+1) | 1,792 (+7%) | 2mo | $215,000 | $120 | 78 |
| 4806 Cushman Rd NE #157 | 0.10mi | 3/2.0 | 1,848 (+10%) | 3mo | $39,360 | $21 | 76 |
| 4805 Cushman Rd NE #32 | 0.04mi | 3/2.0 | 1,512 (-10%) | 13mo | $305,000 | $202 | 70 |
| 4806 Cushman Rd NE #103 | 0.14mi | 3/2.0 | 1,536 (-9%) | 12mo | $82,000 | $53 | 69 |
| 4805 Cushman Rd NE #30 | 0.02mi | 2/2.0 (-1) | 1,872 (+11%) | 10mo | $165,000 | $88 | 67 |
| 4743 Bellwood Dr NE | 0.52mi | 3/2.0 | 1,512 (-10%) | 0mo | $274,500 | $182 | 59 |
| 4806 Cushman Rd NE #118 | 0.10mi | 2/2.0 (-1) | 1,440 (-14%) | 16mo | $145,000 | $101 | 53 |
| 4724 Bellwood Dr NE | 0.55mi | 3/2.0 | 1,440 (-14%) | 7mo | $387,200 | $269 | 45 |
| 4826 Bellwood Dr NE | 0.56mi | 3/2.0 | 1,440 (-14%) | 23mo | $300,000 | $208 | 31 |
Match score weights: distance 35% · size 25% · config 20% · recency 20%. Top-matched comps best support the ARV.
Projected returns pro-forma
-3.0% appreciation · 3.66% rent growth · sell at horizon
- IRR
- 24.8%
- Equity multiple
- 2.03×
- Total profit
- $42,541
- Equity at exit
- $21,918
- IRR
- 33.0%
- Equity multiple
- 4.10×
- Total profit
- $127,534
- Equity at exit
- $12,710
Cash invested: $41,160 (down + closing). Projections, not guarantees.
Landlord ↔ Tenant lean methodology
- Overall (STATE)
- 28 Tenant-Leaning
- State Washington
- 28 Tenant-Leaning · D+8
- County
- — inherits STATE
- City
- — inherits STATE
ZIP-level market 98506
- Rents YoY
- 3.7%
- Active inventory
- 149
- Price-to-rent
- 4.8×
Monthly cashflow live
- Estimated rent
- $2,570 medium interval (Pro) →
- Mortgage (P&I)
- −$771
- Tax est. 1.5%
- −$184 /mo · $2,205/yr
- Insurance
- −$61
- HOA
- −$0
- Vacancy / Maint / Mgmt
- −$540
- Net cashflow
- $1,014
Break-even live
Sensitivity live
| Price | -10% $1,116 | -5% $1,065 | +0% $1,014 | +5% $964 | +10% $913 |
|---|---|---|---|---|---|
| Rent | -10% $811 | -5% $913 | +0% $1,014 | +5% $1,116 | +10% $1,217 |
| Rate | -1.0pp $1,088 | -0.5pp $1,052 | base $1,014 | +0.5pp $976 | +1.0pp $938 |
UW: 25.0% down · 7.5% · 30yr · 1.5% tax · 5.0% vac · 8.0% maint · 8.0% mgmt
Financing live
Cash to close
- Down payment
- $36,750
- Closing costs
- $4,410
- Reserves months
- —
- Total cash needed
- —
Loan-product check · same deal, 3 products live
Conventional
25% down · 7.5% · 30yr
- Down + closing
- —
- Monthly P&I
- —
- Monthly cashflow
- —
- DSCR
- —
- Eligible?
- —
Personal DTI + credit; lowest rate.
DSCR
20% down · 8.5% · 30yr
- Down + closing
- —
- Monthly P&I
- —
- Monthly cashflow
- —
- DSCR
- —
- Eligible?
- —
No personal income docs; deal must DSCR.
Hard money
10% down · 12.0% · 12mo
- Down + closing
- —
- Monthly P&I
- —
- Monthly cashflow
- —
- DSCR
- —
- Eligible?
- —
Short-term bridge; refi at stabilization.
Rent comps 1 comps
| Address | Beds | Baths | Sqft | Rent | $/sqft | DOM | Units | Dist |
|---|---|---|---|---|---|---|---|---|
| 5110 Boston Harbor Rd NE Olympia, WA | 3.0 | 2.0 | 1828 | $3,395 | $1.86 | 15d | 1 | 0.50mi |
Listing history 23 events
-
2026-06-18days on market $147,000 Active 124 DOM
-
2026-06-17days on market $147,000 Active 123 DOM
-
2026-06-16days on market $147,000 Active 122 DOM
-
2026-06-15days on market $147,000 Active 121 DOM
-
2026-06-14days on market $147,000 Active 119 DOM
-
2026-06-13days on market $147,000 Active 118 DOM
-
2026-06-10days on market $147,000 Active 116 DOM
-
2026-06-09days on market $147,000 Active 115 DOM
-
2026-06-08days on market $147,000 Active 114 DOM
-
2026-06-07days on market $147,000 Active 113 DOM
-
2026-06-05days on market $147,000 Active 110 DOM
-
2026-06-02days on market $147,000 Active 108 DOM
-
2026-06-01days on market $147,000 Active 107 DOM
-
2026-05-31days on market $147,000 Active 106 DOM
-
2026-05-30days on market $147,000 Active 105 DOM
-
2026-05-08status Active
-
2026-05-03status Pending
-
2026-04-29price $147,000
-
2026-03-14price $159,000
-
2026-02-10$169,000 Active
-
2008-05-16soldstatus $65,000
-
2008-05-12historical
-
2008-01-12$69,500
ⓘ Source: listings_history table (triggers on properties + properties_extension) + one-shot
backfill from property_details.listing_events for pre-trigger history.
Climate risk First Street
- Flood 1/10 Low FEMA zone X (unshaded) · 0% chance over 30 yrs
- Wildfire 2/10 Low
- Heat 3/10 Moderate 7 d/yr ≥89°F today · 14 d/yr by 30 yrs out
- Wind 1/10 Low
- Air quality 6/10 Major 6 unhealthy d/yr today · 7 by 30 yrs out
Nearby sold comps map
Loading sold comps map…
Walkable amenities ~0.75 mi
Loading nearby amenities…
Taxation est. · year 1
- Rental income
- $30,839
- − Mortgage interest
- −$8,234
- − Property taxes
- −$2,205
- − Insurance
- −$735
- − Repairs & maintenance
- −$2,467
- − Management
- −$2,467
- − Depreciation
- −$4,276
- Taxable income
- $10,454
- Est. tax owed @ 24.0%
- −$2,509
- After-tax cash flow
- $9,663/yr
For passive investors: Depreciation is non-cash, so a rental often shows a tax loss while cash-flowing — sheltering income. Rental losses are passive: they offset passive income freely, and up to $25,000/yr can offset ordinary (W-2) income if you actively participate and your MAGI is under $100k (phasing out to $0 by $150k); unused losses carry forward. On sale, claimed depreciation is recaptured at up to 25%, and gains may owe capital-gains tax (a 1031 exchange can defer both). Figures are a year-1 estimate at your 24.0% rate — not tax advice; consult a CPA.
Schools (NCES district)
- District
- Olympia School District
- NCES district ID
- 5306180
- Math proficiency
- 66% ▼ -2.00%
- Reading proficiency
- 75% ▼ -2.00%
- Median HH income
- $63,852
- Composite
- 62.27/100
- National rank
- #1438
- State rank
- #17 of 291 in WA
Livability — Olympia
- Score
- 83/100
- State rank
- #58
- US rank
- #1036
Category grades
Schools grade is shown separately in the Schools card above.
Census & demographics
- County
- Thurston County · 269,345 people
- City population
- 98,428
- Metro
- Olympia-Lacey-Tumwater, WA
- Population (ZIP)
- 18,497
- Household income
- $91,596
- Rent vs Own
- Severe rent burden
- 924.0
Population outlook (Thurston County) Hauer SSP2
- Today (2025)
- 308,239 people
- By 2030
- 326,483 · +5.9%
- By 2040
- 359,890 · +16.8%
- By 2050
- 391,800 · +27.1%
- By 2075
- 468,024 · +51.8%
- By 2100
- 519,890 · +68.7%
Race, ethnicity, and origin ACS 2023
- Neighborhood character
- Predominantly White (81%)
- Race & ethnicity
- White 81% Two or more races 9% Hispanic / Latino 5% Asian 5% Black 1%
- Hispanic origin (detail)
- Mexican 3%
- Common ancestry
- Portuguese 5% Italian 4% Romanian 4%
- Foreign-born
- 8% · Canada, Vietnam, China
- Languages at home
- 89% English-only · Spanish 2% German/W. Germanic 1% Vietnamese 1%
Political lean MEDSL · Thurston
- 2024 margin
- Strong D (+20.4) · D 58.5% · R 38.1% · Other 3.5%
- 2008→2024 swing
- -1.3pp toward R · 2008: 21.7pp · 2024: 20.4pp
- All cycles
- 2024: D+20.4 2020: D+18.6 2016: D+15.4 2012: D+19.0 2008: D+21.7
Not yet ingested
- Civics
- —
Market trends
- HPI YoY
- ▼ -437.08%
- Current HPI
- 363.2295
- Rent YoY
- ▲ 3.66%
- Metro
- Olympia-Lacey-Tumwater, WA
- State GDP YoY
- ▲ 4.65%
- F500 in state
- 22
Industry mix (Fortune 500 HQ in WA)
| Industry | F500 HQs | Revenue |
|---|---|---|
| Retail | 2 | $269B |
|
||
| Technology / Retail | 1 | $638B |
|
||
| Technology | 1 | $245B |
|
||
| Telecommunications | 1 | $38B |
|
||
| Food / Beverage | 1 | $36B |
|
||
| Automotive / Trucks | 1 | $34B |
|
||
Price history
+111.5% since first listed8 events — show timeline
- 2026-05-08 Relisted — NWMLS as Distributed by MLS Grid
- 2026-05-03 Pending — NWMLS as Distributed by MLS Grid
- 2026-04-29 Price Changed $147,000 NWMLS as Distributed by MLS Grid
- 2026-03-14 Price Changed $159,000 NWMLS as Distributed by MLS Grid
- 2026-02-10 Listed $169,000 NWMLS as Distributed by MLS Grid
- 2008-05-16 Sold (MLS) $65,000 NWMLS as Distributed by MLS Grid
- 2008-05-12 Delisted — NWMLS as Distributed by MLS Grid
- 2008-01-12 Listed $69,500 NWMLS as Distributed by MLS Grid
Cash-flow waterfall
monthlySold comps — $/sqft
last 12 mo · ≤1 miLoading sold comps…