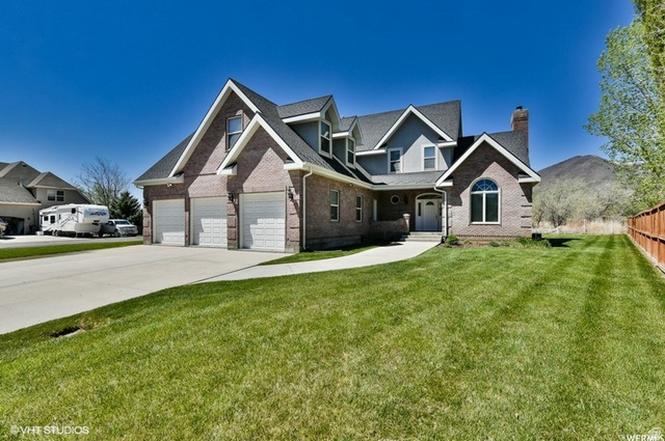
913 N Swiss Farm Ct W · Midway, UT
Flood risk 4/10 · Minor
- FEMA flood zone
- X (unshaded)
- Chance of flooding over 30 yrs
- 0.23%
- Est. flood insurance / yr
- $507 – $1,088
Fire risk 5/10 · Moderate
- Est. fire insurance / yr
- $453 – $841
Heat risk 3/10 · Minor
- Hot days now (above 90°F)
- 8 days/yr
- Hot days in 30 yrs
- 22 days/yr
Wind risk 1/10 · Minimal
- Chance of severe wind over 30 yrs
- —
Air-quality risk 3/10 · Minor
- Unhealthy air days now
- 2 days/yr
- Unhealthy air days in 30 yrs
- 3 days/yr
Risk factors via First Street. Map © Google.
Why this score? — see what drove the D+ grade
The composite is a weighted blend of 9 inputs, each scored 0–100. Each bar is that input's sub-score; the figure is the points it added to the 100-point composite (weight × sub-score).
- Cash flow +15.0/30.0
- ARV discount +7.5/15.0
- 1% rule +5.0/10.0
- DSCR +5.0/10.0
- Schools +4.3/10.0
- Livability +3.4/5.0
- Rent growth +2.5/5.0
- Condition / age +2.5/5.0
- Appreciation +0.0/10.0
$150,000
🖨 Deal sheet (PDF) 📄 Offer letter ✓ Due diligence
Listing remarks
Home owned by 4 families for a great getaway to enjoy the great outdoors of Utah. Quiet and peaceful but you can stay as busy as you want. Family friendly activities to relaxing hikes and more. Close to water skiing, snow skiing, biking, hiking, shopping, restaurants. .. Just steps from Homestead Resort and a hop, skip and a jump to Park City. This owner has use of the home 7-8 weeks a year. (owns 1 of the 8 shares). 3 bedrooms but with bonus rooms the home can easily sleep 35. Great home to share with your family, friends, church groups, etc. Large kitchen/family area, huge bonus room upstairs with ping pong, air hockey, foosball and more. Additional bonus room in attic area. Hot tub on p
Key facts
- Close to restaurants
- Close to hiking
- Close to snow skiing
Tags
Property features AI
Finance
- Other: Zoning: Single-Family; Topography: flat; View: mountain
- HOA & community: Subdivision: SWISS FARM
Exterior
- Parking: Attached garage; Total 12 parking spaces; 4 garage spaces; 4 covered parking spaces; 8 open parking spaces
- Security: Security system; Alarm system
- Utilities: Natural gas connected; Electricity connected; Sewer connected; Water connected (culinary and irrigation)
- Home design: Two-story home; Built/standing construction; Faces north; Recreational current use; Fractional ownership
- Construction: Brick and stucco construction; Asphalt roof; Slab foundation; Built/standing
- Exterior features: Double-pane windows; Sliding glass doors; Open patio; Corner lot; Curb and gutter; Automatic full sprinklers; Mountain view; Landscaping: full
Interior
- Kitchen: Double oven; Gas range; Microwave; Refrigerator; Granite countertops
- Bedrooms: Primary bedroom on the 1st floor; One main-level bedroom
- Flooring: Carpet; Tile
- Bathrooms: 2 full bathrooms; 2 half/partial bathrooms
- Heating & cooling: Forced air heating; Central air conditioning
- Interior features: Security alarm system; Primary bathroom with separate tub and shower; Central vacuum; Walk-in closets; Garbage disposal; Gas log fireplace; Great room; Jetted tub; Double oven; Gas range; Vaulted ceilings; Granite countertops; Blinds
- Laundry & utility: Washer; Dryer; Central vacuum
Neighborhood map
What this means for you Summary
Snapshot
- This is a 3-bed/3.0-bath single-family listed at $150k.
Deal economics
- At list price, monthly cash flow is $4k ($48k/yr) — positive.
- The deal already cash-flows at list — no discount required.
- Meets the 1% rule at list price ($6k rent vs $150k).
- Cap rate 38.2% vs local median 2.5% in Midway — top-decile yield for the area; either an underpriced asset or a hidden risk that comps aren't pricing in. Stress-test before assuming the spread holds.
Location & tenants
- Location reads 67/100 on livability (#124 in UT) — a middle-class / working-renter tenant base. Strengths: crime A+, employment A+, housing A; Watch: amenities F, commute F, cost of living F.
- Wasatch District (town): math 45% / reading 51% proficiency, ranked #23 of 80 in UT (top 29%) — families likely to look elsewhere, expect single-tenant / working-renter base with shorter leases.
- Zoned schools: Midway School (math 63% / reading 66%, grade B, #23 of 585 statewide, top 4%, 675 students, 18% FRL); Wasatch High (math 34% / reading 50%, grade F, #55 of 171 statewide, top 32%, 2,531 students, 16% FRL).
- Market conditions: 225 active listings in the ZIP; 2 comparable units currently listed for rent nearby; high-income renter base; 835 units permitted in Wasatch County in 2024 (22 in 5+ unit buildings).
- At $6,368/mo this rent would consume 50% of the median local household income ($151k/yr) — very limited rent-growth headroom before tenants either downsize or default.
Forward outlook
- Local home prices are declining (-3.0%/yr); year-one equity from $1k of loan paydown is wiped out by about $4k of value loss. Plan a longer hold.
- Wasatch County population projected at +87% by 2050 — long-run rental-demand tailwind backs the buy-and-hold thesis.
- At projected returns (-3.0% appreciation + 3.0% rent growth), your $42k cash investment doubles in ~1 year — after that, you're playing with house money.
Negotiation context
- Only 7 days on market — expect competitive offers; lowballing is unlikely to land.
- 7 sale attempts since 28y ago with the ask held roughly flat each time — persistent listings suggest the price (not the market) is what's stuck; bring a comps-based counter.
Risks & watch-outs
- Climate carrying-cost: moderate wildfire risk — expect insurance premiums to compound above CPI over the hold.
Questions for the listing agent
- Is there a deadline driving the sale (1031 exchange, divorce, estate, relocation)? That informs how much negotiation room exists.
- Schools are A-rated — typically a magnet for longer-tenancy family renters. What's the average tenant stay here, and is there a school-zone premium baked into asking?
- The area grade is low — what's the realistic commute time and amenity access for the typical tenant pool here? Any planned neighborhood developments (good or bad) we should know about?
- What's the average days-on-market for RENTAL listings here right now (not sales)? A rising rental-DOM trend means longer vacancies and softer asking-rent achievability than the comps imply.
- What's the recent tenant-quality profile in this submarket — average credit score on applications, eviction rate, late-payment / NSF rate, and stable-employment percentage? A property-management company in the area should have these aggregated.
- How much new for-sale + rental construction is in the pipeline within 1–3 miles? Heavy new supply typically softens prices + rents 12–24 months out; constrained supply supports both.
Investment metrics
- 1% rule
- 4.25% ✓
- Cap rate
- 38.25%
- Cash-on-cash
- 114.11%
- DSCR
- 6.08
- GRM
- 2.0
CMA / ARV
- ARV (on-the-fly)
- $1,409,485
- Comps found
- 2
Show comp detail 2 sales within ~0.75 mi
| Address | Dist | Beds/Ba | Sqft | Sold | Price | $/sf | Match |
|---|---|---|---|---|---|---|---|
| 1507 N Jerry Gertsch Ln | 0.70mi | 4/4.0 (+1) | 3,505 (-4%) | 19mo | $1,350,000 | $385 | 35 |
| 1497 N Jerry Gertsch Ln | 0.69mi | 4/4.0 (+1) | 3,148 (-14%) | 18mo | $1,150,000 | $365 | 20 |
Match score weights: distance 35% · size 25% · config 20% · recency 20%. Top-matched comps best support the ARV.
Projected returns pro-forma
-3.0% appreciation · 3.0% rent growth · sell at horizon
- IRR
- —
- Equity multiple
- 6.48×
- Total profit
- $230,171
- Equity at exit
- $22,365
- IRR
- —
- Equity multiple
- 13.58×
- Total profit
- $528,375
- Equity at exit
- $12,969
Cash invested: $42,000 (down + closing). Projections, not guarantees.
Landlord ↔ Tenant lean methodology
- Overall (STATE)
- 86 Strongly Landlord-Friendly
- State Utah
- 86 Strongly Landlord-Friendly · R+15
- County
- — inherits STATE
- City
- — inherits STATE
ZIP-level market 84049
- Home prices YoY
- -32.9%
- Active inventory
- 225
- Price-to-rent
- 2.0×
Monthly cashflow live
- Estimated rent
- $6,368 medium interval (Pro) →
- Mortgage (P&I)
- −$787
- Tax est. 1.5%
- −$188 /mo · $2,250/yr
- Insurance
- −$62
- HOA
- −$0
- Vacancy / Maint / Mgmt
- −$1,337
- Net cashflow
- $3,994
Break-even live
Sensitivity live
| Price | -10% $4,098 | -5% $4,046 | +0% $3,994 | +5% $3,942 | +10% $3,890 |
|---|---|---|---|---|---|
| Rent | -10% $3,491 | -5% $3,742 | +0% $3,994 | +5% $4,246 | +10% $4,497 |
| Rate | -1.0pp $4,070 | -0.5pp $4,032 | base $3,994 | +0.5pp $3,955 | +1.0pp $3,916 |
UW: 25.0% down · 7.5% · 30yr · 1.5% tax · 5.0% vac · 8.0% maint · 8.0% mgmt
Financing live
Cash to close
- Down payment
- $37,500
- Closing costs
- $4,500
- Reserves months
- —
- Total cash needed
- —
Loan-product check · same deal, 3 products live
Conventional
25% down · 7.5% · 30yr
- Down + closing
- —
- Monthly P&I
- —
- Monthly cashflow
- —
- DSCR
- —
- Eligible?
- —
Personal DTI + credit; lowest rate.
DSCR
20% down · 8.5% · 30yr
- Down + closing
- —
- Monthly P&I
- —
- Monthly cashflow
- —
- DSCR
- —
- Eligible?
- —
No personal income docs; deal must DSCR.
Hard money
10% down · 12.0% · 12mo
- Down + closing
- —
- Monthly P&I
- —
- Monthly cashflow
- —
- DSCR
- —
- Eligible?
- —
Short-term bridge; refi at stabilization.
Rent comps 2 comps
| Address | Beds | Baths | Sqft | Rent | $/sqft | DOM | Units | Dist |
|---|---|---|---|---|---|---|---|---|
| 347 Luzern Rd Midway, UT | 3.0 | 3.5 | 3400 | $5,800 | $1.71 | 25d | 1 | 0.81mi |
| 1239 Links Dr Midway, UT | 4.0 | 3.5 | 3539 | $7,500 | $2.12 | 25d | 1 | 1.12mi |
Listing history 6 events
-
2026-06-18days on market $150,000 Active 7 DOM
-
2026-06-17days on market $150,000 Active 6 DOM
-
2026-06-16days on market $150,000 Active 5 DOM
-
2026-06-15days on market $150,000 Active 4 DOM
-
2026-06-14remarks 699-char remark
-
2026-06-14$150,000 Active 2 DOM
ⓘ Source: listings_history table (triggers on properties + properties_extension) + one-shot
backfill from property_details.listing_events for pre-trigger history.
Climate risk First Street
- Flood 4/10 Moderate FEMA zone X (unshaded) · 23% chance over 30 yrs
- Wildfire 5/10 Major
- Heat 3/10 Moderate 8 d/yr ≥90°F today · 22 d/yr by 30 yrs out
- Wind 1/10 Low
- Air quality 3/10 Moderate 2 unhealthy d/yr today · 3 by 30 yrs out
Nearby sold comps map
Loading sold comps map…
Walkable amenities ~0.75 mi
Loading nearby amenities…
Taxation est. · year 1
- Rental income
- $76,415
- − Mortgage interest
- −$8,402
- − Property taxes
- −$2,250
- − Insurance
- −$750
- − Repairs & maintenance
- −$6,113
- − Management
- −$6,113
- − Depreciation
- −$4,364
- Taxable income
- $48,422
- Est. tax owed @ 24.0%
- −$11,621
- After-tax cash flow
- $36,307/yr
For passive investors: Depreciation is non-cash, so a rental often shows a tax loss while cash-flowing — sheltering income. Rental losses are passive: they offset passive income freely, and up to $25,000/yr can offset ordinary (W-2) income if you actively participate and your MAGI is under $100k (phasing out to $0 by $150k); unused losses carry forward. On sale, claimed depreciation is recaptured at up to 25%, and gains may owe capital-gains tax (a 1031 exchange can defer both). Figures are a year-1 estimate at your 24.0% rate — not tax advice; consult a CPA.
Schools (NCES district)
- District
- Wasatch District
- NCES district ID
- 4901110
- Math proficiency
- 45% ▼ -2.00%
- Reading proficiency
- 51% ▼ -1.00%
- Median HH income
- $67,315
- Composite
- 42.77/100
- National rank
- #3154
- State rank
- #23 of 80 in UT
Livability — Midway
- Score
- 67/100
- State rank
- #124
- US rank
- #10123
Category grades
Schools grade is shown separately in the Schools card above.
Census & demographics
- Census place
- Midway, UT
- County
- Wasatch County · 42,185 people
- City population
- 6,833
- Metro
- Heber, UT
- Population (ZIP)
- 6,833
- Household income
- $151,343
- Rent vs Own
- Severe rent burden
- 11.0
Population outlook (Wasatch County) Hauer SSP2
- Today (2025)
- 42,214 people
- By 2030
- 49,113 · +16.3%
- By 2040
- 63,675 · +50.8%
- By 2050
- 78,879 · +86.9%
- By 2075
- 116,912 · +177.0%
- By 2100
- 147,290 · +248.9%
Race, ethnicity, and origin ACS 2023
- Neighborhood character
- Predominantly White (97%)
- Race & ethnicity
- White 97% Two or more races 2% Hispanic / Latino 1%
- Common ancestry
- Italian 7% Slovak 4% Iranian 3%
- Foreign-born
- 3% · Canada
- Languages at home
- 92% English-only · Spanish 5% German/W. Germanic 1% Other Indo-European 1%
Political lean MEDSL · Wasatch
- 2024 margin
- Strong R (+27.4) · D 35.2% · R 62.6% · Other 2.2%
- 2008→2024 swing
- +2.3pp toward D · 2008: -29.8pp · 2024: -27.4pp
- All cycles
- 2024: R+27.4 2020: R+26.2 2016: R+25.2 2012: R+52.2 2008: R+29.8
Not yet ingested
- Civics
- —
Market trends
- HPI YoY
- ▼ -154.44%
- Current HPI
- 314.7511
- Rent YoY
- —
- Metro
- Heber, UT
- State GDP YoY
- ▲ 3.54%
- F500 in state
- 2
Industry mix (Fortune 500 HQ in UT)
| Industry | F500 HQs | Revenue |
|---|---|---|
| Financial Services | 1 | $3B |
|
||
Price history
+117.4% since first listed17 events — show timeline
- 2026-06-11 Listed $150,000 WFRMLS
- 2025-05-02 Sold (Public Records) — Public Records
- 2022-03-01 Sold (Public Records) — Public Records
- 2019-11-02 Listing Removed — WFRMLS
- 2019-05-03 Listed $255,000 WFRMLS
- 2019-01-25 Listing Removed — WFRMLS
- 2018-05-04 Listed $255,000 WFRMLS
- 2009-09-21 Sold (Public Records) — Public Records
- 2006-09-29 Sold (MLS) — PCMLS
- 2006-09-29 Sold (MLS) — WFRMLS
- 2006-08-28 Delisted — PCMLS
- 2006-07-03 Listed $82,000 WFRMLS
- 2006-06-30 Listed $82,000 PCMLS
- 2001-02-27 Listing Removed — WFRMLS
- 2000-01-11 Listed $77,000 WFRMLS
- 1999-01-29 Sold (MLS) — WFRMLS
- 1998-09-04 Listed $69,000 WFRMLS
Property tax history
+5.3%/yrLatest (2025): $9,109 · +1.1% YoY. Source: county tax records.
Cash-flow waterfall
monthlySold comps — $/sqft
last 12 mo · ≤1 miLoading sold comps…