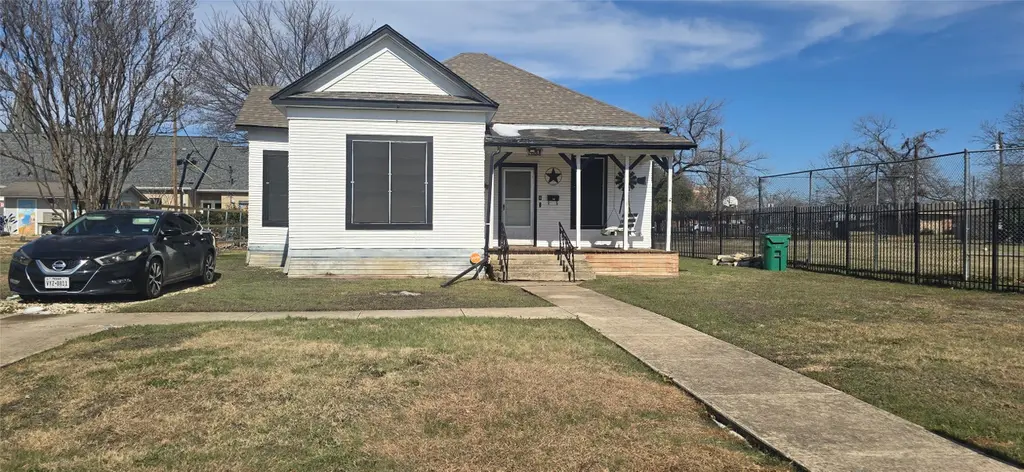
420 W 6th St · Taylor, TX
Flood risk 1/10 · Minimal
- FEMA flood zone
- X (unshaded)
- Chance of flooding over 30 yrs
- 0.0%
- Est. flood insurance / yr
- $507 – $1,088
Fire risk 2/10 · Minimal
- Est. fire insurance / yr
- $1,222 – $2,270
Heat risk 8/10 · Major
- Hot days now (above 108°F)
- 7 days/yr
- Hot days in 30 yrs
- 23 days/yr
Wind risk 8/10 · Major
- Chance of severe wind over 30 yrs
- 80.0%
Air-quality risk 2/10 · Minimal
- Unhealthy air days now
- 0 days/yr
- Unhealthy air days in 30 yrs
- 1 days/yr
Risk factors via First Street. Map © Google.
Why this score? — see what drove the C+ grade
The composite is a weighted blend of 9 inputs, each scored 0–100. Each bar is that input's sub-score; the figure is the points it added to the 100-point composite (weight × sub-score).
- Cash flow +23.3/30.0
- ARV discount +15.0/15.0
- DSCR +7.5/10.0
- 1% rule +6.2/10.0
- Livability +3.6/5.0
- Rent growth +2.6/5.0
- Condition / age +2.5/5.0
- Schools +2.0/10.0
- Appreciation +0.0/10.0
$185,000
🖨 Deal sheet 📄 Offer letter ✓ Due diligence
Listing remarks MLS
Just added - 5,000 sellers concessions. Looking for an affordable home. Here it is. This 3 bedroom 1 bath home features classic character with everyday comfort. From the moment you arrive, you’ll notice the welcoming front porch perfect for morning coffee or evening relaxation. Inside, original hardwood floors in living area, carpet in bedrooms, high ceilings and abundant natural light throughout. The spacious living room offers a warm and inviting atmosphere, ideal for gatherings or quiet evenings at home. A large dining room and small kitchen with a bonus room in the back of the house leading to the back door with an accessible ramp. Partial fence on east and west side of house. open carport in the rear with alley access. A closed garage sits next to carport for storage. This home is being sold as is. Ready for you to add your touch of TLC or leave as is for the more classic look. Owner is also asking for a 30 day lease back after closing. Please allow a 2 hour notice for showing time due to owner occupied and dog on premises. Monday through Friday and weekends 10am-5pm. Contact agent with any questions or concerns.
Key facts
- Large dining room
- Bonus room
- High ceilings
Tags
Neighborhood map
What this means for you Summary
Snapshot
- This is a 3-bed/1.0-bath single-family listed at $185k.
Deal economics
- At list price, monthly cash flow is $338 ($4k/yr) — positive.
- The deal already cash-flows at list — no discount required.
- Meets the 1% rule at list price ($2k rent vs $185k).
- Recommended offer: $168k (9.0% below list) — sets the bar for market timing.
- Cap rate 8.5% vs local median 4.3% in Taylor — top-decile yield for the area; either an underpriced asset or a hidden risk that comps aren't pricing in. Stress-test before assuming the spread holds.
Location & tenants
- Location reads 71/100 on livability (#312 in TX) — a middle-class / working-renter tenant base. Strengths: cost of living A+, housing A+; Watch: employment C-, schools D-, amenities F.
- Taylor ISD (town): math 20% / reading 27% proficiency, ranked #726 of 826 in TX (top 88%) — low school quality limits family demand, transient renter base, plan for 1-2y turnover; 61% free/reduced lunch — lower-income household profile, screen leases tightly.
- Market conditions: Rents flat; 314 active listings in the ZIP; 10 comparable units currently listed for rent nearby; rentals at typical pace (median 24d on market — plan ~3-4 weeks tenant-placement turnaround); solid renter incomes; 7,543 units permitted in Williamson County in 2024 (1,425 in 5+ unit buildings).
- This rent runs 32% of the median local income ($79k/yr) — at the standard rent-burdened threshold; future hikes will face affordability resistance.
Forward outlook
- Local home prices are declining (-3.0%/yr); year-one equity from $1k of loan paydown is wiped out by about $6k of value loss. Plan a longer hold.
- Williamson County population projected at +69% by 2050 — long-run rental-demand tailwind backs the buy-and-hold thesis.
Negotiation context
- It's been on market 118 days — a 9% lower offer ($168k) is reasonable based on typical stale-listing flexibility.
- 2 sale attempts since 22y ago with the ask held roughly flat each time — persistent listings suggest the price (not the market) is what's stuck; bring a comps-based counter.
Risks & watch-outs
- Watch-outs: built in 1925 — expect roof / HVAC / electrical / plumbing capex.
- Climate carrying-cost: severe wind risk, 80% chance of damaging wind over 30y; extreme-heat days projected 7→23/yr by 2055 (HVAC capex compounding) — expect insurance premiums to compound above CPI over the hold.
Questions for the listing agent
- It's been on market 118 days. Have you received any prior offers? Is the seller open to a 9% concession, seller financing, or rate buy-down credit?
- Built in 1925 — when were the roof, HVAC, electrical panel, plumbing, and water heater last replaced?
- Why hasn't it sold? Are there any deal-killer items the seller is aware of (foundation, flood, title, zoning, code violations)?
- Is there a deadline driving the sale (1031 exchange, divorce, estate, relocation)? That informs how much negotiation room exists.
- Schools are D-rated, which usually means shorter tenancies and higher turnover. Who's the typical renter profile here, and what's been the actual vacancy rate?
- What's the average days-on-market for RENTAL listings here right now (not sales)? A rising rental-DOM trend means longer vacancies and softer asking-rent achievability than the comps imply.
- What's the recent tenant-quality profile in this submarket — average credit score on applications, eviction rate, late-payment / NSF rate, and stable-employment percentage? A property-management company in the area should have these aggregated.
- How much new for-sale + rental construction is in the pipeline within 1–3 miles? Heavy new supply typically softens prices + rents 12–24 months out; constrained supply supports both.
Investment metrics
- 1% rule
- 1.12% ✓
- Cap rate
- 8.48%
- Cash-on-cash
- 7.82%
- DSCR
- 1.35
- GRM
- 7.4
CMA / ARV
- ARV (median comp)
- $314,392
- List price
- $185,000
- Delta
- -41.16%
- Verdict
- UNDERPRICED
- Comps
- 20 within 1.0 mi
Show comp detail 12 sales within ~0.75 mi
| Address | Dist | Beds/Ba | Sqft | Sold | Price | $/sf | Match |
|---|---|---|---|---|---|---|---|
| 510 Davis St | 0.05mi | 3/1.5 | 1,500 (-4%) | 21mo | $299,000 | $199 | 72 |
| 1006 Porter St | 0.43mi | 2/1.0 (-1) | 1,478 (-5%) | 6mo | $175,000 | $118 | 60 |
| 913 Fowzer St | 0.22mi | 3/2.0 | 1,416 (-9%) | 12mo | $269,900 | $191 | 60 |
| 809 Howard St | 0.44mi | 3/2.0 | 1,420 (-9%) | 2mo | $196,000 | $138 | 58 |
| 914 Victoria St | 0.52mi | 4/2.0 (+1) | 1,620 (+4%) | 3mo | $255,000 | $157 | 58 |
| 148 Harston Dr | 0.34mi | 3/2.5 | 1,780 (+14%) | 6mo | $246,990 | $139 | 50 |
| 1518 Lexington St | 0.60mi | 3/2.0 | 1,772 (+13%) | 0mo | $374,950 | $212 | 46 |
| 1310 Thompson St | 0.60mi | 3/2.0 | 1,719 (+10%) | 11mo | $249,900 | $145 | 42 |
| 207 Old Thorndale Rd | 0.54mi | 3/2.0 | 1,362 (-13%) | 9mo | $339,900 | $250 | 42 |
| 907 Fisher St | 0.75mi | 3/2.0 | 1,416 (-9%) | 6mo | $145,000 | $102 | 41 |
| 1106 W 6th St | 0.48mi | 3/2.0 | 1,390 (-11%) | 18mo | $254,000 | $183 | 41 |
| 1205 W 7th St | 0.56mi | 3/2.0 | 1,736 (+11%) | 21mo | $424,900 | $245 | 34 |
Match score weights: distance 35% · size 25% · config 20% · recency 20%. Top-matched comps best support the ARV.
Projected returns pro-forma
-3.0% appreciation · 0.43% rent growth · sell at horizon
- IRR
- -7.3%
- Equity multiple
- 0.74×
- Total profit
- $-13,671
- Equity at exit
- $27,584
- IRR
- -1.4%
- Equity multiple
- 0.91×
- Total profit
- $-4,449
- Equity at exit
- $15,995
Cash invested: $51,800 (down + closing). Projections, not guarantees.
Landlord ↔ Tenant lean methodology
- Overall (STATE)
- 87 Strongly Landlord-Friendly
- State Texas
- 87 Strongly Landlord-Friendly · R+5
- County
- — inherits STATE
- City
- — inherits STATE
ZIP-level market 76574
- Home prices YoY
- -32.3%
- Rents YoY
- 0.4%
- Active inventory
- 314
- Price-to-rent
- 7.4×
Monthly cashflow live
- Estimated rent
- $2,078 high interval (Pro) →
- Mortgage (P&I)
- −$970
- Tax from tax record
- −$257 /mo · $3,082/yr
- Insurance
- −$77
- HOA
- −$0
- Vacancy / Maint / Mgmt
- −$436
- Net cashflow
- $338
Break-even live
UW: 25.0% down · 7.5% · 30yr · 1.5% tax · 5.0% vac · 8.0% maint · 8.0% mgmt
Financing live
Cash to close
- Down payment
- $46,250
- Closing costs
- $5,550
- Reserves months
- —
- Total cash needed
- —
Loan-product check · same deal, 3 products live
Conventional
25% down · 7.5% · 30yr
- Down + closing
- —
- Monthly P&I
- —
- Monthly cashflow
- —
- DSCR
- —
- Eligible?
- —
Personal DTI + credit; lowest rate.
DSCR
20% down · 8.5% · 30yr
- Down + closing
- —
- Monthly P&I
- —
- Monthly cashflow
- —
- DSCR
- —
- Eligible?
- —
No personal income docs; deal must DSCR.
Hard money
10% down · 12.0% · 12mo
- Down + closing
- —
- Monthly P&I
- —
- Monthly cashflow
- —
- DSCR
- —
- Eligible?
- —
Short-term bridge; refi at stabilization.
Rent comps 10 comps
| Address | Beds | Baths | Sqft | Rent | $/sqft | DOM | Units | Dist |
|---|---|---|---|---|---|---|---|---|
| 600 Kimbro St Taylor, TX | 3.0 | 2.5 | 1480 | $2,250 | $1.52 | 23d | 1 | 0.22mi |
| 401 Shaw St Taylor, TX | 2.0 | 1.0 | 1168 | $1,650 | $1.41 | 17d | 1 | 0.30mi |
| 109 N Main St Unit A Taylor, TX | 2.0 | 1.0 | 1495 | $1,750 | $1.17 | 1d | 1 | 0.36mi |
| 1215 Davis St Taylor, TX | 4.0 | 2.5 | 2220 | $3,200 | $1.44 | 23d | 1 | 0.49mi |
| 1117 W 4th St Taylor, TX | 3.0 | 2.0 | 1334 | $1,400 | $1.05 | 17d | 1 | 0.53mi |
| 206 Oscar St Taylor, TX | 4.0 | 1.5 | 1960 | $2,100 | $1.07 | 1d | 1 | 0.61mi |
| 210 W Lake Dr Taylor, TX | 2.0 | 1.5 | 1057 | $1,450 | $1.37 | 43d | 1 | 0.75mi |
| 1707 Lexington St Taylor, TX | 3.0 | 2.0 | 2140 | $2,500 | $1.17 | 23d | 1 | 0.75mi |
| 2005 Whistling Way Taylor, TX | 4.0 | 2.5 | 2209 | $2,050 | $0.93 | 4d | 1 | 1.43mi |
| 1006 Cottonbowl Dr Taylor, TX | 4.0 | 2.0 | 1615 | $2,300 | $1.42 | 43d | 1 | 1.45mi |
Listing history 18 events
-
2026-06-18days on market $185,000 Active 118 DOM
-
2026-06-17days on market $185,000 Active 117 DOM
-
2026-06-16days on market $185,000 Active 116 DOM
-
2026-06-15days on market $185,000 Active 115 DOM
-
2026-06-13days on market $185,000 Active 113 DOM
-
2026-06-09days on market $185,000 Active 109 DOM
-
2026-06-08days on market $185,000 Active 108 DOM
-
2026-06-07days on market $185,000 Active 107 DOM
-
2026-06-05days on market $185,000 Active 104 DOM
-
2026-06-03days on market $185,000 Active 103 DOM
-
2026-06-02days on market $185,000 Active 102 DOM
-
2026-06-01days on market $185,000 Active 101 DOM
-
2026-05-31days on market $185,000 Active 100 DOM
-
2026-04-27price $185,000 1141-char remark
Show marketing remark (1141 chars)
Just added - 5,000 sellers concessions. Looking for an affordable home. Here it is. This 3 bedroom 1 bath home features classic character with everyday comfort. From the moment you arrive, you’ll notice the welcoming front porch perfect for morning coffee or evening relaxation. Inside, original hardwood floors in living area, carpet in bedrooms, high ceilings and abundant natural light throughout. The spacious living room offers a warm and inviting atmosphere, ideal for gatherings or quiet evenings at home. A large dining room and small kitchen with a bonus room in the back of the house leading to the back door with an accessible ramp. Partial fence on east and west side of house. open carport in the rear with alley access. A closed garage sits next to carport for storage. This home is being sold as is. Ready for you to add your touch of TLC or leave as is for the more classic look. Owner is also asking for a 30 day lease back after closing. Please allow a 2 hour notice for showing time due to owner occupied and dog on premises. Monday through Friday and weekends 10am-5pm. Contact agent with any questions or concerns.
-
2026-02-20$190,000 Active 1141-char remark
Show marketing remark (1141 chars)
Just added - 5,000 sellers concessions. Looking for an affordable home. Here it is. This 3 bedroom 1 bath home features classic character with everyday comfort. From the moment you arrive, you’ll notice the welcoming front porch perfect for morning coffee or evening relaxation. Inside, original hardwood floors in living area, carpet in bedrooms, high ceilings and abundant natural light throughout. The spacious living room offers a warm and inviting atmosphere, ideal for gatherings or quiet evenings at home. A large dining room and small kitchen with a bonus room in the back of the house leading to the back door with an accessible ramp. Partial fence on east and west side of house. open carport in the rear with alley access. A closed garage sits next to carport for storage. This home is being sold as is. Ready for you to add your touch of TLC or leave as is for the more classic look. Owner is also asking for a 30 day lease back after closing. Please allow a 2 hour notice for showing time due to owner occupied and dog on premises. Monday through Friday and weekends 10am-5pm. Contact agent with any questions or concerns.
-
2004-12-01historical
-
2004-05-26
-
1993-07-27soldstatus
ⓘ Source: listings_history table (triggers on properties + properties_extension) + one-shot
backfill from property_details.listing_events for pre-trigger history.
Tax reassessment forecast TX · Resets to sale price
- Current annual tax
- $3,082 · $257/mo
- Projected year-2 tax
- $3,386 · $282/mo
- Expected delta
- +$304/yr (+$25/mo · 9.9%)
ⓘ Screening estimate from a state-policy table — verify with the county assessor before closing.
Climate risk First Street
- Flood 1/10 Low FEMA zone X (unshaded) · 0% chance over 30 yrs
- Wildfire 2/10 Low
- Heat 8/10 Severe 7 d/yr ≥108°F today · 23 d/yr by 30 yrs out
- Wind 8/10 Severe 80% chance of damaging wind over 30 yrs
- Air quality 2/10 Low 0 unhealthy d/yr today · 1 by 30 yrs out
Nearby sold comps map
Loading sold comps map…
Walkable amenities ~0.75 mi
Loading nearby amenities…
Taxation est. · year 1
- Rental income
- $24,936
- − Mortgage interest
- −$10,363
- − Property taxes
- −$3,082
- − Insurance
- −$925
- − Repairs & maintenance
- −$1,995
- − Management
- −$1,995
- − Depreciation
- −$5,382
- Taxable income
- $1,195
- Est. tax owed @ 24.0%
- −$287
- After-tax cash flow
- $3,764/yr
For passive investors: Depreciation is non-cash, so a rental often shows a tax loss while cash-flowing — sheltering income. Rental losses are passive: they offset passive income freely, and up to $25,000/yr can offset ordinary (W-2) income if you actively participate and your MAGI is under $100k (phasing out to $0 by $150k); unused losses carry forward. On sale, claimed depreciation is recaptured at up to 25%, and gains may owe capital-gains tax (a 1031 exchange can defer both). Figures are a year-1 estimate at your 24.0% rate — not tax advice; consult a CPA.
Schools (NCES district)
- District
- Taylor ISD
- NCES district ID
- 4842280
- Math proficiency
- 20% ▼ -15.00%
- Reading proficiency
- 27% ▼ -11.00%
- Median HH income
- $45,330
- Composite
- 20.35/100
- National rank
- #8606
- State rank
- #726 of 826 in TX
Livability — Taylor
- Score
- 71/100
- State rank
- #312
- US rank
- #7013
Category grades
Schools grade is shown separately in the Schools card above.
Census & demographics
- Census place
- Taylor, TX
- County
- Williamson County · 680,029 people
- City population
- 20,242
- Metro
- Austin-Round Rock-Georgetown, TX
- Population (ZIP)
- 20,242
- Household income
- $78,568
- Rent vs Own
- Severe rent burden
- 371.0
Population outlook (Williamson County) Hauer SSP2
- Today (2025)
- 699,027 people
- By 2030
- 795,537 · +13.8%
- By 2040
- 990,683 · +41.7%
- By 2050
- 1,184,292 · +69.4%
- By 2075
- 1,623,825 · +132.3%
- By 2100
- 1,924,153 · +175.3%
Race, ethnicity, and origin ACS 2023
- Neighborhood character
- Diverse neighborhood (Simpson 0.57)
- Race & ethnicity
- White 50% Hispanic / Latino 42% Two or more races 22% Black 5%
- Hispanic origin (detail)
- Mexican 37%
- Common ancestry
- Romanian 2% Italian 1% Lithuanian 1%
- Foreign-born
- 8% · Canada
- Languages at home
- 74% English-only · Spanish 23% Russian/Polish/Slavic 1%
Political lean MEDSL · Williamson
- 2024 margin
- Toss-up / Even · D 48.0% · R 50.4% · Other 1.6%
- 2008→2024 swing
- +10.6pp toward D · 2008: -13.0pp · 2024: -2.5pp
- All cycles
- 2024: R+2.5 2020: D+1.4 2016: R+9.9 2012: R+21.5 2008: R+13.0
Not yet ingested
- Civics
- —
Market trends
- HPI YoY
- ▼ -108.71%
- Current HPI
- 227.58
- Rent YoY
- ▲ 0.43%
- Metro
- Austin-Round Rock-Georgetown, TX
- State GDP YoY
- ▲ 3.95%
- F500 in state
- 110
Industry mix (Fortune 500 HQ in TX)
| Industry | F500 HQs | Revenue |
|---|---|---|
| Energy | 16 | $1,198B |
|
||
| Technology | 5 | $198B |
|
||
| Engineering / Construction | 4 | $72B |
|
||
| Energy Services | 3 | $60B |
|
||
| Utilities | 3 | $41B |
|
||
| Healthcare | 2 | $330B |
|
||
Price history
-2.6% since first listed5 events — show timeline
- 2026-04-27 Price Changed $185,000 Unlock MLS
- 2026-02-20 Listed $190,000 Unlock MLS
- 2004-12-01 Delisted — Unlock MLS
- 2004-05-26 Listed — Unlock MLS
- 1993-07-27 Sold (Public Records) — Public Records
Property tax history
+2.4%/yrLatest (2026): $3,082 · +10.0% YoY. Source: county tax records.
Cash-flow waterfall
monthlySold comps — $/sqft
last 12 mo · ≤1 miLoading sold comps…