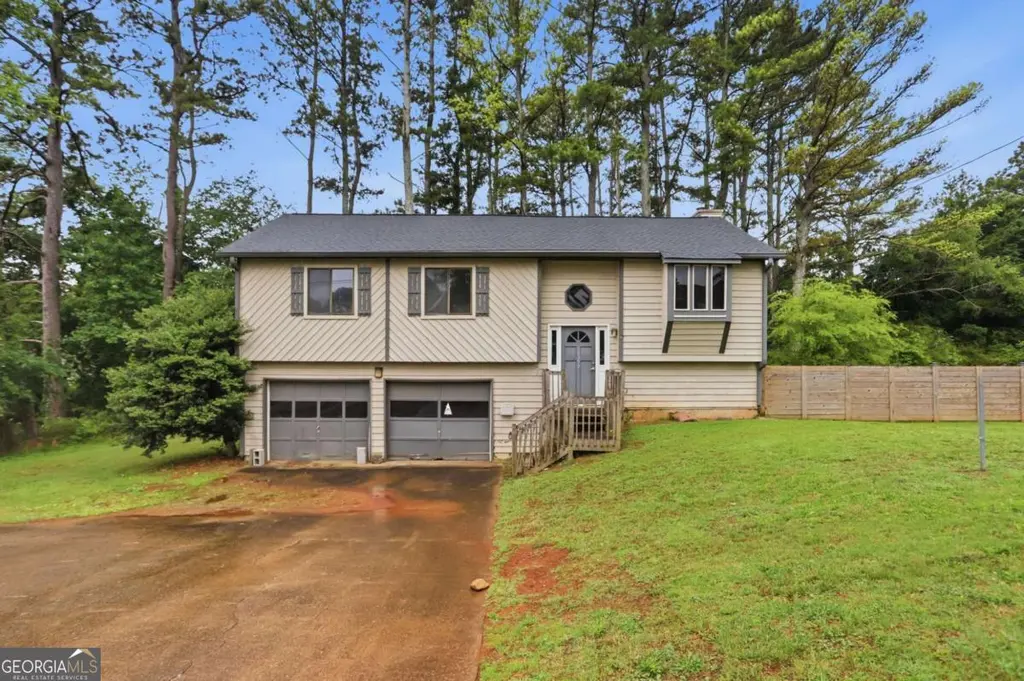
1290 Shallowford Rd · Woodstock, GA
Flood risk 1/10 · Minimal
- FEMA flood zone
- X (unshaded)
- Chance of flooding over 30 yrs
- 0.0%
- Est. flood insurance / yr
- $473 – $860
Fire risk 1/10 · Minimal
- Est. fire insurance / yr
- $963 – $1,789
Heat risk 5/10 · Moderate
- Hot days now (above 102°F)
- 7 days/yr
- Hot days in 30 yrs
- 18 days/yr
Wind risk 4/10 · Minor
- Chance of severe wind over 30 yrs
- 19.0%
Air-quality risk 4/10 · Minor
- Unhealthy air days now
- 5 days/yr
- Unhealthy air days in 30 yrs
- 7 days/yr
Risk factors via First Street. Map © Google.
Why this score? — see what drove the D+ grade
The composite is a weighted blend of 9 inputs, each scored 0–100. Each bar is that input's sub-score; the figure is the points it added to the 100-point composite (weight × sub-score).
- ARV discount +15.0/15.0
- Cash flow +14.4/30.0
- DSCR +4.4/10.0
- 1% rule +3.8/10.0
- Schools +3.8/10.0
- Livability +3.7/5.0
- Condition / age +2.5/5.0
- Rent growth +2.4/5.0
- Appreciation +0.0/10.0
$269,900
🖨 Deal sheet (PDF) 📄 Offer letter ✓ Due diligence
Listing remarks MLS
Located in desirable East Cobb with convenient access to shopping, dining, parks, and commuter routes, this traditional-style home offers strong upside potential for investors, renovators, or buyers seeking a project opportunity. The property features a functional multi-level layout, spacious living areas, and a large lot within an established Marietta community. However, the home is in need of significant repairs and updating throughout, including deferred maintenance, damaged interior finishes and flooring, exterior deck/stair deterioration, and HVAC concerns. Basement area offers additional potential for future improvements. Property is being sold in its current condition and may be best suited for cash or renovation-style financing.
Key facts
- Large lot
- Basement area
- Multi-level layout
Tags
Property features AI
Exterior
- Parking: Attached garage with 2 spaces; Driveway parking; Open parking available
- Utilities: Water: Other; Electric: Other; Sewer: Other; Other utilities
- Home design: Multi/split-level home; Resale property
- Construction: Wood siding and other exterior materials; Composition roof; Slab foundation; Built with other construction details
- Exterior features: Deck
Interior
- Kitchen: Eat-in kitchen with stained cabinets and view to family room; Dishwasher, Gas Range, Refrigerator
- Bedrooms: Three upper-level bedrooms; Oversized master bedroom
- Flooring: Carpet; Vinyl
- Bathrooms: Two full bathrooms (both upper level); Master bathroom with tub/shower combo
- Heating & cooling: Central heating; Central air conditioning
- Interior features: One fireplace located in the family room; Full basement; Open concept dining area; Other interior features
- Laundry & utility: Laundry room (other features)
Neighborhood map
What this means for you Summary
Snapshot
- This is a 3-bed/2.0-bath single-family listed at $270k.
Deal economics
- At list price, monthly cash flow is $53 ($639/yr) — positive.
- The deal already cash-flows at list — no discount required.
- To meet the 1% rule (rent ≥ 1% of price), the offer needs to be $237k (12.3% below list).
- Recommended offer: $237k (12.3% below list) — sets the bar for 1% rule.
- Cap rate 6.5% vs local median 3.3% in Woodstock — top-decile yield for the area; either an underpriced asset or a hidden risk that comps aren't pricing in. Stress-test before assuming the spread holds.
Location & tenants
- Location reads 73/100 on livability (#46 in GA) — a middle-class / working-renter tenant base. Strengths: crime A+, employment A+, housing A+; Watch: amenities F, commute F, health & safety F.
- Cobb County (suburban): math 39% / reading 45% proficiency, ranked #25 of 174 in GA (top 14%) — families likely to look elsewhere, expect single-tenant / working-renter base with shorter leases.
- Zoned schools: Nicholson Elementary School (math 42% / reading 42%, grade F, #380 of 1,228 statewide, top 33%, 407 students, 36% FRL); Mccleskey Middle School (math 37% / reading 44%, grade F, #140 of 470 statewide, top 30%, 570 students, 34% FRL); Kell High School (math 28% / reading 21%, grade F, #184 of 424 statewide, top 48%, 1,506 students, 32% FRL).
- Market conditions: Rents soft (-0.4%/yr); 446 active listings in the ZIP; 17 comparable units currently listed for rent nearby; rentals at typical pace (median 21d on market — plan ~3-4 weeks tenant-placement turnaround); high-income renter base; 1,625 units permitted in Cobb County in 2024 (389 in 5+ unit buildings).
Forward outlook
- Local home prices are declining (-3.0%/yr); year-one equity from $2k of loan paydown is wiped out by about $8k of value loss. Plan a longer hold.
- Cobb County population projected at +33% by 2050 — long-run rental-demand tailwind backs the buy-and-hold thesis.
Negotiation context
- Only 7 days on market — expect competitive offers; lowballing is unlikely to land.
- 2 sale attempts with the ask held roughly flat each time — persistent listings suggest the price (not the market) is what's stuck; bring a comps-based counter.
Risks & watch-outs
- Climate carrying-cost: extreme-heat days projected 7→18/yr by 2055 (HVAC capex compounding) — expect insurance premiums to compound above CPI over the hold.
Questions for the listing agent
- Is there a deadline driving the sale (1031 exchange, divorce, estate, relocation)? That informs how much negotiation room exists.
- Schools are B-rated — typically a magnet for longer-tenancy family renters. What's the average tenant stay here, and is there a school-zone premium baked into asking?
- The area grade is low — what's the realistic commute time and amenity access for the typical tenant pool here? Any planned neighborhood developments (good or bad) we should know about?
- What's the average days-on-market for RENTAL listings here right now (not sales)? A rising rental-DOM trend means longer vacancies and softer asking-rent achievability than the comps imply.
- What's the recent tenant-quality profile in this submarket — average credit score on applications, eviction rate, late-payment / NSF rate, and stable-employment percentage? A property-management company in the area should have these aggregated.
- How much new for-sale + rental construction is in the pipeline within 1–3 miles? Heavy new supply typically softens prices + rents 12–24 months out; constrained supply supports both.
Investment metrics
- 1% rule
- 0.88% ✗
- Cap rate
- 6.53%
- Cash-on-cash
- 0.85%
- DSCR
- 1.04
- GRM
- 9.5
CMA / ARV
- ARV (on-the-fly)
- $369,672
- Comps found
- 12
Show comp detail 12 sales within ~0.75 mi
| Address | Dist | Beds/Ba | Sqft | Sold | Price | $/sf | Match |
|---|---|---|---|---|---|---|---|
| 4422 Inlet Rd | 0.42mi | 3/2.0 | 1,657 (-2%) | 6mo | $373,000 | $225 | 73 |
| 4262 Inlet Rd | 0.26mi | 3/2.0 | 1,852 (+10%) | 5mo | $360,000 | $194 | 68 |
| 1471 Ebb Ct NE | 0.48mi | 3/2.0 | 1,601 (-5%) | 4mo | $375,000 | $234 | 66 |
| 990 Cauthen Ct NE | 0.68mi | 3/2.5 | 1,696 (+0%) | 0mo | $315,000 | $186 | 65 |
| 1355 Barrier Rd | 0.46mi | 3/2.0 | 1,752 (+4%) | 9mo | $270,000 | $154 | 64 |
| 4486 Bay Ct | 0.64mi | 4/2.0 (+1) | 1,676 (-1%) | 8mo | $365,000 | $218 | 57 |
| 4365 Reef Rd | 0.37mi | 3/2.0 | 1,890 (+12%) | 7mo | $370,000 | $196 | 57 |
| 4274 Reef Rd | 0.35mi | 4/2.5 (+1) | 1,886 (+12%) | 2mo | $411,450 | $218 | 56 |
| 3911 Catalina Dr | 0.66mi | 4/2.5 (+1) | 1,762 (+4%) | 2mo | $420,000 | $238 | 54 |
| 1515 Barrier Rd | 0.66mi | 3/2.0 | 1,601 (-5%) | 10mo | $350,000 | $219 | 52 |
| 4103 Christacy Way | 0.50mi | 3/2.0 | 1,827 (+8%) | 14mo | $456,000 | $250 | 52 |
| 4331 Volnay Ct NE | 0.66mi | 4/2.5 (+1) | 1,864 (+10%) | 12mo | $510,000 | $274 | 34 |
Match score weights: distance 35% · size 25% · config 20% · recency 20%. Top-matched comps best support the ARV.
Projected returns pro-forma
-3.0% appreciation · 0.0% rent growth · sell at horizon
- IRR
- -18.3%
- Equity multiple
- 0.37×
- Total profit
- $-47,275
- Equity at exit
- $40,243
- IRR
- -17.8%
- Equity multiple
- 0.16×
- Total profit
- $-63,581
- Equity at exit
- $23,336
Cash invested: $75,572 (down + closing). Projections, not guarantees.
Landlord ↔ Tenant lean methodology
- Overall (STATE)
- 90 Strongly Landlord-Friendly
- State Georgia
- 90 Strongly Landlord-Friendly · R+3
- County
- — inherits STATE
- City
- — inherits STATE
ZIP-level market 30066
- Rents YoY
- -0.4%
- Active inventory
- 446
- Price-to-rent
- 9.5×
Monthly cashflow live
- Estimated rent
- $2,367 high interval (Pro) →
- Mortgage (P&I)
- −$1,415
- Tax from tax record
- −$289 /mo · $3,463/yr
- Insurance
- −$112
- HOA
- −$0
- Vacancy / Maint / Mgmt
- −$497
- Net cashflow
- $53
Break-even live
Sensitivity live
| Price | -10% $206 | -5% $130 | +0% $53 | +5% $-23 | +10% $-100 |
|---|---|---|---|---|---|
| Rent | -10% $-134 | -5% $-40 | +0% $53 | +5% $147 | +10% $240 |
| Rate | -1.0pp $189 | -0.5pp $122 | base $53 | +0.5pp $-17 | +1.0pp $-88 |
UW: 25.0% down · 7.5% · 30yr · 1.5% tax · 5.0% vac · 8.0% maint · 8.0% mgmt
Financing live
Cash to close
- Down payment
- $67,475
- Closing costs
- $8,097
- Reserves months
- —
- Total cash needed
- —
Loan-product check · same deal, 3 products live
Conventional
25% down · 7.5% · 30yr
- Down + closing
- —
- Monthly P&I
- —
- Monthly cashflow
- —
- DSCR
- —
- Eligible?
- —
Personal DTI + credit; lowest rate.
DSCR
20% down · 8.5% · 30yr
- Down + closing
- —
- Monthly P&I
- —
- Monthly cashflow
- —
- DSCR
- —
- Eligible?
- —
No personal income docs; deal must DSCR.
Hard money
10% down · 12.0% · 12mo
- Down + closing
- —
- Monthly P&I
- —
- Monthly cashflow
- —
- DSCR
- —
- Eligible?
- —
Short-term bridge; refi at stabilization.
Rent comps 17 comps
| Address | Beds | Baths | Sqft | Rent | $/sqft | DOM | Units | Dist |
|---|---|---|---|---|---|---|---|---|
| 1370 High Country Ct Marietta, GA | 3.0 | 2.0 | 1260 | $2,059 | $1.63 | 45d | 1 | 0.67mi |
| 1515 Captain Thomas Ct Marietta, GA | 3.0 | 2.0 | 1651 | $2,458 | $1.49 | 4d | 1 | 0.73mi |
| 4750 Jamerson Forest Cir Marietta, GA | 4.0 | 3.0 | 2211 | $2,545 | $1.15 | 23d | 1 | 0.77mi |
| 4067 Keheley Glen Dr NE Marietta, GA | 3.0 | 2.5 | 1858 | $2,280 | $1.23 | 0d | 1 | 0.81mi |
| 4061 Keheley Glen Dr NE Marietta, GA | 3.0 | 2.0 | 1420 | $2,150 | $1.51 | 6d | 1 | 0.83mi |
| 3886 Hadley Farm Dr Marietta, GA | 3.0 | 2.5 | 2080 | $2,500 | $1.20 | 20d | 1 | 0.85mi |
| 891 Old Farm Walk Marietta, GA | 4.0 | 3.0 | 1550 | $2,579 | $1.66 | 18d | 1 | 0.89mi |
| 1765 Blackwillow Dr Marietta, GA | 3.0 | 2.5 | 2060 | $2,600 | $1.26 | 0d | 1 | 1.01mi |
| 933 Old Noonday Sch House Rd Marietta, GA | 3.0 | 2.0 | 1500 | $1,800 | $1.20 | 22d | 1 | 1.04mi |
| 3681 Autumn Leaves Ln Marietta, GA | 4.0 | 2.5 | 1534 | $2,800 | $1.83 | 20d | 1 | 1.10mi |
| 4809 Nevilly Way Marietta, GA | 3.0 | 2.5 | 2008 | $2,385 | $1.19 | 7d | 1 | 1.11mi |
| 2219 N Landing Run Marietta, GA | 3.0 | 2.0 | 1572 | $2,245 | $1.43 | 45d | 1 | 1.19mi |
| 4858 Chapelle Ct Marietta, GA | 3.0 | 2.0 | 1590 | $2,200 | $1.38 | 6d | 1 | 1.19mi |
| 710 Smokey Quartz Way Kennesaw, GA | 3.0 | 2.5 | 2046 | $2,900 | $1.42 | 26d | 1 | 1.20mi |
| 2228 N Woods Ct Marietta, GA | 3.0 | 2.0 | 1705 | $2,085 | $1.22 | 26d | 1 | 1.22mi |
| 2020 Kemp Rd Marietta, GA | 3.0 | 2.0 | 1432 | $2,300 | $1.61 | 0d | 1 | 1.23mi |
| 4723 Canary Diamond Ln Kennesaw, GA | 4.0 | 3.5 | 2200 | $3,250 | $1.48 | 20d | 1 | 1.29mi |
Listing history 8 events
-
2026-06-03status $269,900 Pending 7 DOM
-
2026-06-02days on market $269,900 Active 7 DOM
-
2026-06-01days on market $269,900 Active 6 DOM
-
2026-05-31days on market $269,900 Active 5 DOM
-
2026-05-26$269,900 Active
Show marketing remark (746 chars)
Located in desirable East Cobb with convenient access to shopping, dining, parks, and commuter routes, this traditional-style home offers strong upside potential for investors, renovators, or buyers seeking a project opportunity. The property features a functional multi-level layout, spacious living areas, and a large lot within an established Marietta community. However, the home is in need of significant repairs and updating throughout, including deferred maintenance, damaged interior finishes and flooring, exterior deck/stair deterioration, and HVAC concerns. Basement area offers additional potential for future improvements. Property is being sold in its current condition and may be best suited for cash or renovation-style financing.
-
2026-05-26$269,900 New 746-char remark
Show marketing remark (746 chars)
Located in desirable East Cobb with convenient access to shopping, dining, parks, and commuter routes, this traditional-style home offers strong upside potential for investors, renovators, or buyers seeking a project opportunity. The property features a functional multi-level layout, spacious living areas, and a large lot within an established Marietta community. However, the home is in need of significant repairs and updating throughout, including deferred maintenance, damaged interior finishes and flooring, exterior deck/stair deterioration, and HVAC concerns. Basement area offers additional potential for future improvements. Property is being sold in its current condition and may be best suited for cash or renovation-style financing.
-
2021-10-26soldstatus $2,278,480
-
2020-10-23soldstatus $1,560,000
ⓘ Source: listings_history table (triggers on properties + properties_extension) + one-shot
backfill from property_details.listing_events for pre-trigger history.
Tax reassessment forecast GA · Resets to sale price
- Current annual tax
- $3,463 · $289/mo
- Projected year-2 tax
- $3,463 · $289/mo
- Expected delta
- $0/yr ($0/mo · 0.0%)
ⓘ Screening estimate from a state-policy table — verify with the county assessor before closing.
Climate risk First Street
- Flood 1/10 Low FEMA zone X (unshaded) · 0% chance over 30 yrs
- Wildfire 1/10 Low
- Heat 5/10 Major 7 d/yr ≥102°F today · 18 d/yr by 30 yrs out
- Wind 4/10 Moderate 19% chance of damaging wind over 30 yrs
- Air quality 4/10 Moderate 5 unhealthy d/yr today · 7 by 30 yrs out
Nearby sold comps map
Loading sold comps map…
Walkable amenities ~0.75 mi
Loading nearby amenities…
Taxation est. · year 1
- Rental income
- $28,400
- − Mortgage interest
- −$15,119
- − Property taxes
- −$3,463
- − Insurance
- −$1,350
- − Repairs & maintenance
- −$2,272
- − Management
- −$2,272
- − Depreciation
- −$7,852
- Taxable loss
- −$3,927
- Est. tax savings @ 24.0%
- +$942
- After-tax cash flow
- $1,581/yr
For passive investors: Depreciation is non-cash, so a rental often shows a tax loss while cash-flowing — sheltering income. Rental losses are passive: they offset passive income freely, and up to $25,000/yr can offset ordinary (W-2) income if you actively participate and your MAGI is under $100k (phasing out to $0 by $150k); unused losses carry forward. On sale, claimed depreciation is recaptured at up to 25%, and gains may owe capital-gains tax (a 1031 exchange can defer both). Figures are a year-1 estimate at your 24.0% rate — not tax advice; consult a CPA.
Schools (NCES district)
- District
- Cobb County
- NCES district ID
- 1301290
- Math proficiency
- 39% ▼ -15.00%
- Reading proficiency
- 45% ▼ -10.00%
- Median HH income
- $68,845
- Composite
- 37.93/100
- National rank
- #4308
- State rank
- #25 of 174 in GA
Livability — Woodstock
- Score
- 73/100
- State rank
- #46
- US rank
- #5116
Category grades
Schools grade is shown separately in the Schools card above.
Census & demographics
- County
- Cobb County · 777,758 people
- City population
- 109,446
- Metro
- Atlanta-Sandy Springs-Alpharetta, GA
- Population (ZIP)
- 61,761
- Household income
- $116,074
- Rent vs Own
- Severe rent burden
- 1101.0
Population outlook (Cobb County) Hauer SSP2
- Today (2025)
- 868,385 people
- By 2030
- 929,614 · +7.1%
- By 2040
- 1,047,533 · +20.6%
- By 2050
- 1,155,537 · +33.1%
- By 2075
- 1,405,030 · +61.8%
- By 2100
- 1,555,058 · +79.1%
Race, ethnicity, and origin ACS 2023
- Neighborhood character
- Diverse neighborhood (Simpson 0.57)
- Race & ethnicity
- White 62% Black 16% Hispanic / Latino 10% Two or more races 10% Asian 6%
- Hispanic origin (detail)
- Mexican 4% Puerto Rican 1% Cuban 1%
- Common ancestry
- Italian 2% Slovak 2% Lithuanian 2%
- Foreign-born
- 15% · Canada, Vietnam, China
- Languages at home
- 82% English-only · Spanish 7% Other Indo-European 4% Other Asian/Pacific 1%
Political lean MEDSL · Cobb
- 2024 margin
- D (+14.9) · D 56.9% · R 42.0% · Other 1.1%
- 2008→2024 swing
- +24.3pp toward D · 2008: -9.4pp · 2024: 14.9pp
- All cycles
- 2024: D+14.9 2020: D+14.3 2016: D+2.1 2012: R+12.6 2008: R+9.4
Not yet ingested
- Civics
- —
Market trends
- HPI YoY
- ▼ -269.40%
- Current HPI
- 250.037
- Rent YoY
- ▼ -0.38%
- Metro
- Atlanta-Sandy Springs-Alpharetta, GA
- State GDP YoY
- ▲ 2.66%
- F500 in state
- 28
Industry mix (Fortune 500 HQ in GA)
| Industry | F500 HQs | Revenue |
|---|---|---|
| Paper / Packaging | 2 | $29B |
|
||
| Retail | 1 | $160B |
|
||
| Transportation / Logistics | 1 | $91B |
|
||
| Airlines | 1 | $62B |
|
||
| Consumer Goods | 1 | $47B |
|
||
| Utilities | 1 | $25B |
|
||
Price history
-82.7% since first listed4 events — show timeline
- 2026-05-26 Listed $269,900 GAMLS
- 2026-05-26 Listed $269,900 FMLS
- 2021-10-26 Sold (Public Records) $2,278,480 Public Records
- 2020-10-23 Sold (Public Records) $1,560,000 Public Records
Property tax history
+4.4%/yrLatest (2025): $3,463 · -0.1% YoY. Source: county tax records.
Cash-flow waterfall
monthlySold comps — $/sqft
last 12 mo · ≤1 miLoading sold comps…