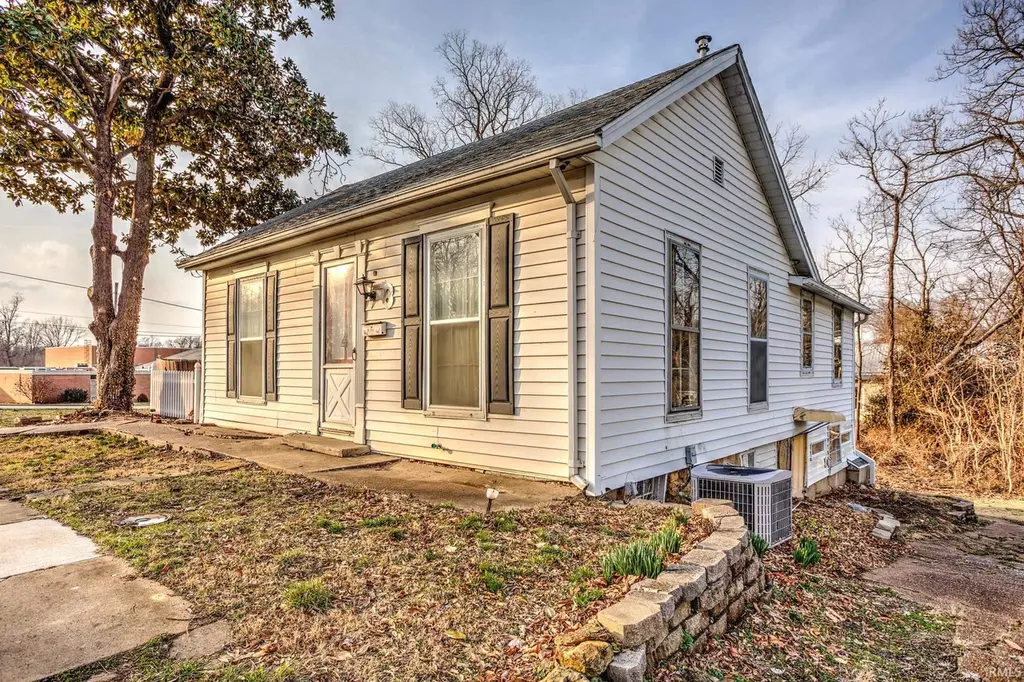
8 E Gray St · Newburgh, IN
Flood risk 8/10 · Major
- FEMA flood zone
- X (unshaded)
- Chance of flooding over 30 yrs
- 0.99%
- Est. flood insurance / yr
- $473 – $860
Fire risk 1/10 · Minimal
- Est. fire insurance / yr
- $717 – $1,331
Heat risk 5/10 · Moderate
- Hot days now (above 107°F)
- 7 days/yr
- Hot days in 30 yrs
- 19 days/yr
Wind risk 2/10 · Minimal
- Chance of severe wind over 30 yrs
- 3.0%
Air-quality risk 3/10 · Minor
- Unhealthy air days now
- 3 days/yr
- Unhealthy air days in 30 yrs
- 4 days/yr
Risk factors via First Street. Map © Google.
Why this score? — see what drove the B+ grade
The composite is a weighted blend of 9 inputs, each scored 0–100. Each bar is that input's sub-score; the figure is the points it added to the 100-point composite (weight × sub-score).
- Cash flow +28.4/30.0
- ARV discount +15.0/15.0
- DSCR +10.0/10.0
- 1% rule +6.9/10.0
- Schools +4.9/10.0
- Rent growth +4.7/5.0
- Livability +4.0/5.0
- Condition / age +2.5/5.0
- Appreciation +0.0/10.0
$99,900
🖨 Deal sheet 📄 Offer letter ✓ Due diligence
Listing remarks MLS
Capitalize on this investment opportunity just steps from the Historic Downtown Newburgh, the Rivertown Walking Trail, and the Ohio River. Currently a 2-bed 1.5-bath with a walk-out basement, this home will make a wonderful rental, AirBNB, or flip opportunity either for investment or primary residence! Home is being sold as-is.
Key facts
- Walk-out basement
- 3,920 sq ft lot
- Built 1900
Tags
Neighborhood map
What this means for you Summary
Snapshot
- This is a 3-bed/1.0-bath single-family listed at $100k.
Deal economics
- At list price, monthly cash flow is $266 ($3k/yr) — positive.
- The deal already cash-flows at list — no discount required.
- Meets the 1% rule at list price ($1k rent vs $100k).
- Recommended offer: $91k (9.0% below list) — sets the bar for market timing.
- Cap rate 10.2% vs local median 3.9% in Newburgh — top-decile yield for the area; either an underpriced asset or a hidden risk that comps aren't pricing in. Stress-test before assuming the spread holds.
Location & tenants
- Location reads 80/100 on livability (#21 in IN, #1,922 nationally) — a professional / high-income tenant draw. Strengths: crime A+, cost of living A+, housing A+; Watch: amenities F, commute F.
- Warrick County School Corporation (suburban): math 54% / reading 59% proficiency, ranked #24 of 301 in IN (top 8%) — acceptable for families but not a draw, mixed tenant base, ~2y average lease.
- Market conditions: Rents rising fast (+8.7%/yr); 383 active listings in the ZIP; 3 comparable units currently listed for rent nearby; rentals leasing fast (median 14d on market — plan ~1-2 weeks tenant-placement turnaround); solid renter incomes; 249 units permitted in Warrick County in 2024 (0 in 5+ unit buildings).
- This rent is only 15% of the median local income ($94k/yr) — well below the 30% rent-burden line; pricing power to push rent on renewal without tenant pushback.
Forward outlook
- Local home prices are declining (-3.0%/yr); year-one equity from $691 of loan paydown is wiped out by about $3k of value loss. Plan a longer hold.
- Warrick County population projected at +9% by 2050 — modest demand growth; plan on rents tracking national, not racing it.
- At projected returns (-3.0% appreciation + 8.0% rent growth), your $28k cash investment doubles in ~7 years — after that, you're playing with house money.
Negotiation context
- It's been on market 106 days — a 9% lower offer ($91k) is reasonable based on typical stale-listing flexibility.
- 2 sale attempts with the ask held roughly flat each time — persistent listings suggest the price (not the market) is what's stuck; bring a comps-based counter.
- Current owner paid $72k; 38% above their basis — modest negotiation headroom, anchor on the comps not their cost.
Risks & watch-outs
- Watch-outs: flood insurance adds $56/mo; built in 1900 — expect roof / HVAC / electrical / plumbing capex.
- Climate carrying-cost: severe flood risk; extreme-heat days projected 7→19/yr by 2055 (HVAC capex compounding) — expect insurance premiums to compound above CPI over the hold.
Questions for the listing agent
- It's been on market 106 days. Have you received any prior offers? Is the seller open to a 9% concession, seller financing, or rate buy-down credit?
- Built in 1900 — when were the roof, HVAC, electrical panel, plumbing, and water heater last replaced?
- What's the actual annual flood-insurance premium (NFIP or private), and is the property in a SFHA with mandatory coverage?
- Why hasn't it sold? Are there any deal-killer items the seller is aware of (foundation, flood, title, zoning, code violations)?
- Is there a deadline driving the sale (1031 exchange, divorce, estate, relocation)? That informs how much negotiation room exists.
- Schools are A-rated — typically a magnet for longer-tenancy family renters. What's the average tenant stay here, and is there a school-zone premium baked into asking?
- What's the average days-on-market for RENTAL listings here right now (not sales)? A rising rental-DOM trend means longer vacancies and softer asking-rent achievability than the comps imply.
- What's the recent tenant-quality profile in this submarket — average credit score on applications, eviction rate, late-payment / NSF rate, and stable-employment percentage? A property-management company in the area should have these aggregated.
- How much new for-sale + rental construction is in the pipeline within 1–3 miles? Heavy new supply typically softens prices + rents 12–24 months out; constrained supply supports both.
Investment metrics
- 1% rule
- 1.19% ✓
- Cap rate
- 10.16%
- Cash-on-cash
- 13.80%
- DSCR
- 1.61
- GRM
- 7.0
CMA / ARV
- ARV (median comp)
- $179,619
- List price
- $99,900
- Delta
- -44.38%
- Verdict
- UNDERPRICED
- Comps
- 20 within 1.0 mi
Show comp detail 9 sales within ~0.75 mi
| Address | Dist | Beds/Ba | Sqft | Sold | Price | $/sf | Match |
|---|---|---|---|---|---|---|---|
| 217 Monroe St | 0.07mi | 3/2.0 | 1,002 (+3%) | 2mo | $199,000 | $199 | 86 |
| 405 Filmore St | 0.14mi | 3/2.0 | 1,008 (+4%) | 1mo | $194,900 | $193 | 83 |
| 405 Middle St | 0.10mi | 3/1.0 | 1,065 (+9%) | 4mo | $177,500 | $167 | 76 |
| 329 Middle St | 0.08mi | 2/1.0 (-1) | 1,024 (+5%) | 20mo | $165,000 | $161 | 66 |
| 113 N Fourth St | 0.28mi | 2/2.0 (-1) | 1,012 (+4%) | 8mo | $172,500 | $170 | 65 |
| 414 Locust St | 0.18mi | 2/2.0 (-1) | 1,014 (+4%) | 23mo | $172,500 | $170 | 57 |
| 8 Yorkshire Dr | 0.65mi | 3/1.0 | 1,000 (+3%) | 18mo | $214,400 | $214 | 50 |
| 419 Section St | 0.26mi | 2/1.0 (-1) | 1,080 (+11%) | 20mo | $140,000 | $130 | 48 |
| 725 Outer Gray St | 0.50mi | 2/1.0 (-1) | 1,070 (+10%) | 18mo | $110,000 | $103 | 40 |
Match score weights: distance 35% · size 25% · config 20% · recency 20%. Top-matched comps best support the ARV.
Projected returns pro-forma
-3.0% appreciation · 8.0% rent growth · sell at horizon
- IRR
- 6.1%
- Equity multiple
- 1.25×
- Total profit
- $7,061
- Equity at exit
- $14,895
- IRR
- 19.5%
- Equity multiple
- 3.02×
- Total profit
- $56,632
- Equity at exit
- $8,638
Cash invested: $27,972 (down + closing). Projections, not guarantees.
Landlord ↔ Tenant lean methodology
- Overall (STATE)
- 90 Strongly Landlord-Friendly
- State Indiana
- 90 Strongly Landlord-Friendly · R+11
- County
- — inherits STATE
- City
- — inherits STATE
ZIP-level market 47630
- Rents YoY
- 8.7%
- Active inventory
- 383
- Price-to-rent
- 7.0×
Monthly cashflow live
- Estimated rent
- $1,190 medium interval (Pro) →
- Mortgage (P&I)
- −$524
- Tax from tax record
- −$53 /mo · $634/yr
- Insurance
- −$42
- Flood insurance flood zone
- −$56 /mo · $666/yr
- HOA
- −$0
- Vacancy / Maint / Mgmt
- −$250
- Net cashflow
- $266
Break-even live
UW: 25.0% down · 7.5% · 30yr · 1.5% tax · 5.0% vac · 8.0% maint · 8.0% mgmt
Financing live
Cash to close
- Down payment
- $24,975
- Closing costs
- $2,997
- Reserves months
- —
- Total cash needed
- —
Loan-product check · same deal, 3 products live
Conventional
25% down · 7.5% · 30yr
- Down + closing
- —
- Monthly P&I
- —
- Monthly cashflow
- —
- DSCR
- —
- Eligible?
- —
Personal DTI + credit; lowest rate.
DSCR
20% down · 8.5% · 30yr
- Down + closing
- —
- Monthly P&I
- —
- Monthly cashflow
- —
- DSCR
- —
- Eligible?
- —
No personal income docs; deal must DSCR.
Hard money
10% down · 12.0% · 12mo
- Down + closing
- —
- Monthly P&I
- —
- Monthly cashflow
- —
- DSCR
- —
- Eligible?
- —
Short-term bridge; refi at stabilization.
Rent comps 3 comps
| Address | Beds | Baths | Sqft | Rent | $/sqft | DOM | Units | Dist |
|---|---|---|---|---|---|---|---|---|
| 624 Village Ln Newburgh, IN | 2.0 | 1.0 | 828 | $900 | $1.09 | 43d | 1 | 0.62mi |
| 5700 Kenwood Cir Newburgh, IN | 1.0–2.0 | 1.0 | 858 | $910 | $1.06 | 13d | 2 | 0.70mi |
| 7300 Brentwood Dr Newburgh, IN | 2.0 | 1.0 | 890 | $865 | $0.97 | 13d | 1 | 1.38mi |
Listing history 18 events
-
2026-06-18days on market $99,900 Active 106 DOM
-
2026-06-17days on market $99,900 Active 105 DOM
-
2026-06-16days on market $99,900 Active 104 DOM
-
2026-06-15days on market $99,900 Active 103 DOM
-
2026-06-14days on market $99,900 Active 101 DOM
-
2026-06-13days on market $99,900 Active 100 DOM
-
2026-06-10days on market $99,900 Active 98 DOM
-
2026-06-09days on market $99,900 Active 97 DOM
-
2026-06-08days on market $99,900 Active 96 DOM
-
2026-06-07days on market $99,900 Active 95 DOM
-
2026-06-02days on market $99,900 Active 90 DOM
-
2026-06-01days on market $99,900 Active 89 DOM
-
2026-05-31days on market $99,900 Active 88 DOM
-
2026-05-30days on market $99,900 Active 87 DOM
-
2026-03-04$99,900 Active 329-char remark
Show marketing remark (329 chars)
Capitalize on this investment opportunity just steps from the Historic Downtown Newburgh, the Rivertown Walking Trail, and the Ohio River. Currently a 2-bed 1.5-bath with a walk-out basement, this home will make a wonderful rental, AirBNB, or flip opportunity either for investment or primary residence! Home is being sold as-is.
-
2025-10-07soldstatus $72,500 Closed 116-char remark
Show marketing remark (116 chars)
Opportunity awaits with this 2 beds 1.5 bathroom home just seconds from downtown Newburgh. Home needs extensive work
-
2025-09-19status Pending 116-char remark
Show marketing remark (116 chars)
Opportunity awaits with this 2 beds 1.5 bathroom home just seconds from downtown Newburgh. Home needs extensive work
-
2025-09-19$72,500 Active 116-char remark
Show marketing remark (116 chars)
Opportunity awaits with this 2 beds 1.5 bathroom home just seconds from downtown Newburgh. Home needs extensive work
ⓘ Source: listings_history table (triggers on properties + properties_extension) + one-shot
backfill from property_details.listing_events for pre-trigger history.
Tax reassessment forecast IN · Partial reset (capped growth)
- Current annual tax
- $634 · $53/mo
- Projected year-2 tax
- $742 · $62/mo
- Expected delta
- +$107/yr (+$9/mo · 16.9%)
ⓘ Screening estimate from a state-policy table — verify with the county assessor before closing.
Climate risk First Street
- Flood 8/10 Severe FEMA zone X (unshaded) · 99% chance over 30 yrs
- Wildfire 1/10 Low
- Heat 5/10 Major 7 d/yr ≥107°F today · 19 d/yr by 30 yrs out
- Wind 2/10 Low 3% chance of damaging wind over 30 yrs
- Air quality 3/10 Moderate 3 unhealthy d/yr today · 4 by 30 yrs out
Nearby sold comps map
Loading sold comps map…
Walkable amenities ~0.75 mi
Loading nearby amenities…
Taxation est. · year 1
- Rental income
- $14,280
- − Mortgage interest
- −$5,596
- − Property taxes
- −$634
- − Insurance
- −$1,166
- − Repairs & maintenance
- −$1,142
- − Management
- −$1,142
- − Depreciation
- −$2,906
- Taxable income
- $1,692
- Est. tax owed @ 24.0%
- −$406
- After-tax cash flow
- $2,788/yr
For passive investors: Depreciation is non-cash, so a rental often shows a tax loss while cash-flowing — sheltering income. Rental losses are passive: they offset passive income freely, and up to $25,000/yr can offset ordinary (W-2) income if you actively participate and your MAGI is under $100k (phasing out to $0 by $150k); unused losses carry forward. On sale, claimed depreciation is recaptured at up to 25%, and gains may owe capital-gains tax (a 1031 exchange can defer both). Figures are a year-1 estimate at your 24.0% rate — not tax advice; consult a CPA.
Schools (NCES district)
- District
- Warrick County School Corporation
- NCES district ID
- 1812390
- Math proficiency
- 54% ▼ -8.00%
- Reading proficiency
- 59% ▼ -6.00%
- Median HH income
- $62,801
- Composite
- 49.38/100
- National rank
- #2014
- State rank
- #24 of 301 in IN
Livability — Newburgh
- Score
- 80/100
- State rank
- #21
- US rank
- #1922
Category grades
Schools grade is shown separately in the Schools card above.
Census & demographics
- Census place
- Newburgh, IN
- County
- Warrick County · 39,818 people
- City population
- 39,818
- Metro
- Evansville, IN-KY
- Population (ZIP)
- 39,818
- Household income
- $94,162
- Rent vs Own
- Severe rent burden
- 770.0
Population outlook (Warrick County) Hauer SSP2
- Today (2025)
- 66,569 people
- By 2030
- 68,404 · +2.8%
- By 2040
- 71,131 · +6.9%
- By 2050
- 72,743 · +9.3%
- By 2075
- 76,088 · +14.3%
- By 2100
- 72,261 · +8.6%
Race, ethnicity, and origin ACS 2023
- Neighborhood character
- Predominantly White (88%)
- Race & ethnicity
- White 88% Two or more races 5% Black 3% Hispanic / Latino 3% Asian 3%
- Common ancestry
- Italian 3% Lithuanian 2% Romanian 2%
- Foreign-born
- 5% · Canada, China
- Languages at home
- 96% English-only · Spanish 2% Other Indo-European 1%
Political lean MEDSL · Warrick
- 2024 margin
- Solid R (+30.2) · D 34.1% · R 64.3% · Other 1.5%
- 2008→2024 swing
- -17.4pp toward R · 2008: -12.8pp · 2024: -30.2pp
- All cycles
- 2024: R+30.2 2020: R+27.8 2016: R+33.9 2012: R+26.6 2008: R+12.8
Not yet ingested
- Civics
- —
Market trends
- HPI YoY
- ▼ -187.44%
- Current HPI
- 185.7643
- Rent YoY
- ▲ 8.69%
- Metro
- Evansville, IN-KY
- State GDP YoY
- ▲ 2.90%
- F500 in state
- 18
Industry mix (Fortune 500 HQ in IN)
| Industry | F500 HQs | Revenue |
|---|---|---|
| Industrial Machinery | 2 | $37B |
|
||
| Healthcare | 1 | $177B |
|
||
| Pharmaceuticals | 1 | $45B |
|
||
| Metals / Steel | 1 | $18B |
|
||
| Agriculture | 1 | $17B |
|
||
| Packaging | 1 | $12B |
|
||
Price history
+37.8% since first listed4 events — show timeline
- 2026-03-04 Listed $99,900 IRMLS
- 2025-10-07 Sold (MLS) $72,500 IRMLS
- 2025-09-19 Pending — IRMLS
- 2025-09-19 Listed $72,500 IRMLS
Property tax history
-5.2%/yrLatest (2024): $634 · +1.4% YoY. Source: county tax records.
Cash-flow waterfall
monthlySold comps — $/sqft
last 12 mo · ≤1 miLoading sold comps…