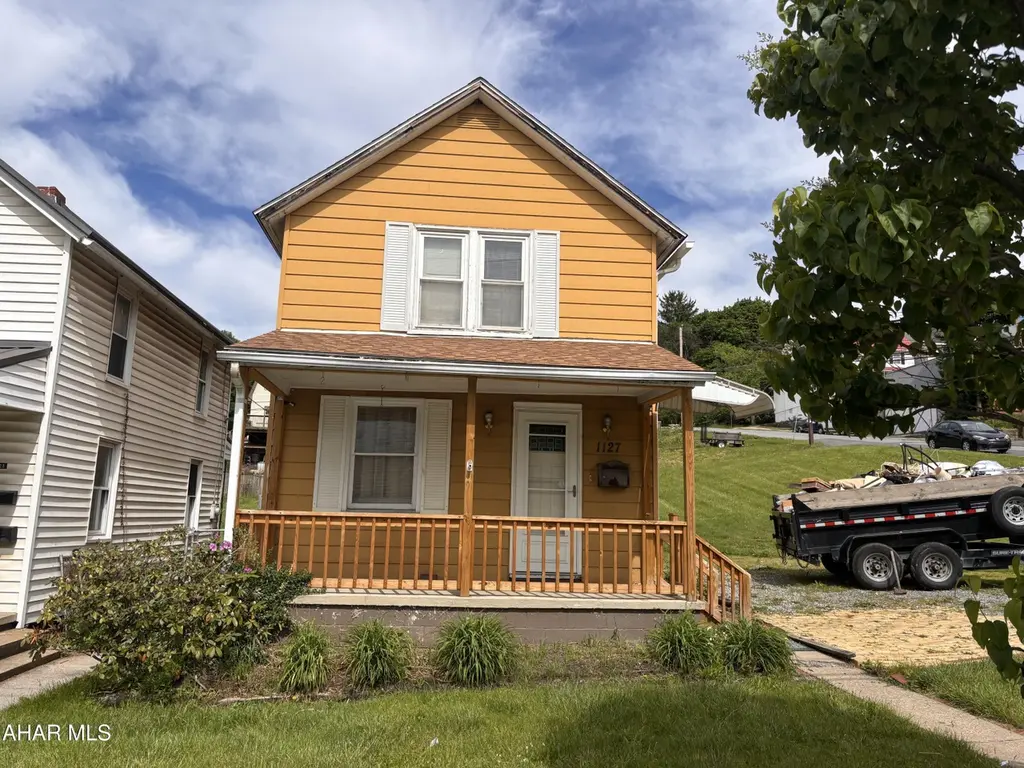
1127 N 4th Ave · Altoona, PA
Flood risk 5/10 · Moderate
- FEMA flood zone
- X (unshaded)
- Chance of flooding over 30 yrs
- 0.24%
- Est. flood insurance / yr
- $507 – $1,088
Fire risk 1/10 · Minimal
- Est. fire insurance / yr
- $511 – $949
Heat risk 4/10 · Minor
- Hot days now (above 91°F)
- 7 days/yr
- Hot days in 30 yrs
- 18 days/yr
Wind risk 2/10 · Minimal
- Chance of severe wind over 30 yrs
- —
Air-quality risk 2/10 · Minimal
- Unhealthy air days now
- 1 days/yr
- Unhealthy air days in 30 yrs
- 3 days/yr
Risk factors via First Street. Map © Google.
Why this score? — see what drove the B+ grade
The composite is a weighted blend of 9 inputs, each scored 0–100. Each bar is that input's sub-score; the figure is the points it added to the 100-point composite (weight × sub-score).
- Cash flow +30.0/30.0
- ARV discount +15.0/15.0
- DSCR +10.0/10.0
- 1% rule +8.6/10.0
- Livability +4.0/5.0
- Schools +3.1/10.0
- Rent growth +2.5/5.0
- Condition / age +2.5/5.0
- Appreciation +0.0/10.0
$89,900
🖨 Deal sheet (PDF) 📄 Offer letter ✓ Due diligence
Listing remarks
Come check out this 3-bedroom, 1-bath home (two bedrooms are captive). The main level features new flooring and new drywall ceilings between the kitchen and living room, giving the space a fresh feel. The kitchen includes a newer refrigerator and dishwasher, and the washer and dryer are included (all appliances are as-is. ) Upstairs, you'll find a bathroom with a new sink and toilet. Mechanicals are taken care of too, with a newer furnace and newer hot water tank already in place. Enjoy outdoor living on the welcoming front porch or relax on the private screened-in back porch. This property also includes a second 50 ft lot in the side, offering extra space for future possibilities. A drivew
Key facts
- Newer dishwasher
- New flooring
- New sink
Tags
Property features AI
Exterior
- Utilities: Public water
- Home design: Single-family residence; Updated/remodeled condition; Two levels
- Construction: Shingle roof
- Exterior features: Porch; Level lot
Interior
- Kitchen: Dishwasher; Oven; Refrigerator
- Bedrooms: 7 total rooms (includes bedrooms and living spaces)
- Flooring: Vinyl; Carpet
- Bathrooms: 1 full bathroom
- Heating & cooling: Forced air heating; Ceiling fan(s) for cooling
- Interior features: Eat-in kitchen; Basement
- Laundry & utility: Washer; Dryer
Neighborhood map
What this means for you Summary
Snapshot
- This is a 3-bed/1.0-bath single-family listed at $90k.
Deal economics
- At list price, monthly cash flow is $394 ($5k/yr) — positive.
- The deal already cash-flows at list — no discount required.
- Meets the 1% rule at list price ($1k rent vs $90k).
- Recommended offer: $87k (3.0% below list) — sets the bar for market timing.
- Cap rate 11.5% vs local median 5.8% in Altoona — top-decile yield for the area; either an underpriced asset or a hidden risk that comps aren't pricing in. Stress-test before assuming the spread holds.
Location & tenants
- Location reads 79/100 on livability (#237 in PA, #2,060 nationally) — a middle-class / working-renter tenant base. Strengths: commute A+, cost of living A+, housing A+; Watch: crime C-, employment D, amenities F.
- Altoona Area SD (urban): math 30% / reading 44% proficiency, ranked #406 of 539 in PA (top 75%) — families likely to look elsewhere, expect single-tenant / working-renter base with shorter leases.
- Market conditions: 186 active listings in the ZIP; 3 comparable units currently listed for rent nearby; rentals lingering (median 45d on market — plan ~5-8 weeks vacancy on turnover, expect pricing pressure); 100% of comp listings sitting > 30 days — soft ceiling on asking rent; 99 units permitted in Blair County in 2024 (0 in 5+ unit buildings).
Forward outlook
- Local home prices are declining (-3.0%/yr); year-one equity from $622 of loan paydown is wiped out by about $3k of value loss. Plan a longer hold.
- Blair County population projected at -18% by 2050 — secular population decline; favor cash flow + early exit over multi-decade hold.
- At projected returns (-3.0% appreciation + 3.0% rent growth), your $25k cash investment doubles in ~7 years — after that, you're playing with house money.
Negotiation context
- It's been on market 39 days — a 3% lower offer ($87k) is reasonable based on typical stale-listing flexibility.
Risks & watch-outs
- Watch-outs: built in 1905 — expect roof / HVAC / electrical / plumbing capex.
- Climate carrying-cost: moderate flood risk — expect insurance premiums to compound above CPI over the hold.
Questions for the listing agent
- It's been on market 39 days. Have you received any prior offers? Is the seller open to a 3% concession, seller financing, or rate buy-down credit?
- Built in 1905 — when were the roof, HVAC, electrical panel, plumbing, and water heater last replaced?
- Is there a deadline driving the sale (1031 exchange, divorce, estate, relocation)? That informs how much negotiation room exists.
- Schools are B-rated — typically a magnet for longer-tenancy family renters. What's the average tenant stay here, and is there a school-zone premium baked into asking?
- What's the average days-on-market for RENTAL listings here right now (not sales)? A rising rental-DOM trend means longer vacancies and softer asking-rent achievability than the comps imply.
- What's the recent tenant-quality profile in this submarket — average credit score on applications, eviction rate, late-payment / NSF rate, and stable-employment percentage? A property-management company in the area should have these aggregated.
- How much new for-sale + rental construction is in the pipeline within 1–3 miles? Heavy new supply typically softens prices + rents 12–24 months out; constrained supply supports both.
Investment metrics
- 1% rule
- 1.36% ✓
- Cap rate
- 11.55%
- Cash-on-cash
- 18.77%
- DSCR
- 1.84
- GRM
- 6.1
CMA / ARV
- ARV (median comp)
- $113,305
- List price
- $89,900
- Delta
- -20.66%
- Verdict
- UNDERPRICED
- Comps
- 20 within 1.0 mi
Show comp detail 7 sales within ~0.75 mi
| Address | Dist | Beds/Ba | Sqft | Sold | Price | $/sf | Match |
|---|---|---|---|---|---|---|---|
| 1115 N 4th Ave | 0.03mi | 3/1.0 | 1,223 (+9%) | 11mo | $55,000 | $45 | 74 |
| 1104 N 5th Ave | 0.06mi | 2/1.0 (-1) | 1,269 (+14%) | 4mo | $23,900 | $19 | 66 |
| 621 N 10th Ave | 0.55mi | 3/1.0 | 1,043 (-7%) | 5mo | $23,500 | $23 | 59 |
| 1419 N 7th Ave | 0.34mi | 3/2.0 | 1,244 (+11%) | 5mo | $219,000 | $176 | 57 |
| 1815 N 4th Ave | 0.65mi | 3/2.0 | 1,144 (+2%) | 7mo | $145,600 | $127 | 56 |
| 212 Penny Ln | 0.72mi | 3/1.0 | 1,152 (+3%) | 22mo | $123,500 | $107 | 43 |
| 301 N 6th Ave | 0.73mi | 3/1.5 | 1,170 (+5%) | 22mo | $42,500 | $36 | 38 |
Match score weights: distance 35% · size 25% · config 20% · recency 20%. Top-matched comps best support the ARV.
Projected returns pro-forma
-3.0% appreciation · 3.0% rent growth · sell at horizon
- IRR
- 10.6%
- Equity multiple
- 1.42×
- Total profit
- $10,495
- Equity at exit
- $13,404
- IRR
- 19.6%
- Equity multiple
- 2.64×
- Total profit
- $41,381
- Equity at exit
- $7,773
Cash invested: $25,172 (down + closing). Projections, not guarantees.
Landlord ↔ Tenant lean methodology
- Overall (STATE)
- 62 Landlord-Friendly
- State Pennsylvania
- 62 Landlord-Friendly · EVEN
- County
- — inherits STATE
- City
- — inherits STATE
ZIP-level market 16601
- Home prices YoY
- -24.9%
- Active inventory
- 186
- Price-to-rent
- 6.1×
Monthly cashflow live
- Estimated rent
- $1,224 medium interval (Pro) →
- Mortgage (P&I)
- −$471
- Tax from tax record
- −$65 /mo · $775/yr
- Insurance
- −$37
- HOA
- −$0
- Vacancy / Maint / Mgmt
- −$257
- Net cashflow
- $394
Break-even live
Sensitivity live
| Price | -10% $445 | -5% $419 | +0% $394 | +5% $368 | +10% $343 |
|---|---|---|---|---|---|
| Rent | -10% $297 | -5% $345 | +0% $394 | +5% $442 | +10% $490 |
| Rate | -1.0pp $439 | -0.5pp $417 | base $394 | +0.5pp $370 | +1.0pp $347 |
UW: 25.0% down · 7.5% · 30yr · 1.5% tax · 5.0% vac · 8.0% maint · 8.0% mgmt
Financing live
Cash to close
- Down payment
- $22,475
- Closing costs
- $2,697
- Reserves months
- —
- Total cash needed
- —
Loan-product check · same deal, 3 products live
Conventional
25% down · 7.5% · 30yr
- Down + closing
- —
- Monthly P&I
- —
- Monthly cashflow
- —
- DSCR
- —
- Eligible?
- —
Personal DTI + credit; lowest rate.
DSCR
20% down · 8.5% · 30yr
- Down + closing
- —
- Monthly P&I
- —
- Monthly cashflow
- —
- DSCR
- —
- Eligible?
- —
No personal income docs; deal must DSCR.
Hard money
10% down · 12.0% · 12mo
- Down + closing
- —
- Monthly P&I
- —
- Monthly cashflow
- —
- DSCR
- —
- Eligible?
- —
Short-term bridge; refi at stabilization.
Rent comps 3 comps
| Address | Beds | Baths | Sqft | Rent | $/sqft | DOM | Units | Dist |
|---|---|---|---|---|---|---|---|---|
| 124 Clairmont Dr Altoona, PA | 3.0 | 2.0 | 1216 | $1,200 | $0.99 | 44d | 1 | 0.66mi |
| 1101 E Walton Ave Altoona, PA | 2.0–3.0 | 1.0–1.5 | 975 | $1,605 | $1.65 | 44d | 9 | 1.12mi |
| 2708 Wehnwood Rd Altoona, PA | 1.0–4.0 | 1.0–1.5 | 960 | $967 | $1.01 | 44d | 5 | 1.27mi |
Listing history 18 events
-
2026-06-19days on market $89,900 Active 39 DOM
-
2026-06-18days on market $89,900 Active 38 DOM
-
2026-06-17days on market $89,900 Active 37 DOM
-
2026-06-16days on market $89,900 Active 36 DOM
-
2026-06-15days on market $89,900 Active 35 DOM
-
2026-06-14days on market $89,900 Active 33 DOM
-
2026-06-13pricedays on market $89,900 Active 32 DOM
-
2026-06-10days on market $100,000 Active 30 DOM
-
2026-06-09days on market $100,000 Active 29 DOM
-
2026-06-08days on market $100,000 Active 28 DOM
-
2026-06-07days on market $100,000 Active 27 DOM
-
2026-06-05days on market $100,000 Active 24 DOM
-
2026-06-03days on market $100,000 Active 23 DOM
-
2026-06-02days on market $100,000 Active 22 DOM
-
2026-06-01days on market $100,000 Active 21 DOM
-
2026-05-31days on market $100,000 Active 20 DOM
-
2026-05-30days on market $100,000 Active 19 DOM
-
2026-05-11$100,000 Active 933-char remark
ⓘ Source: listings_history table (triggers on properties + properties_extension) + one-shot
backfill from property_details.listing_events for pre-trigger history.
Tax reassessment forecast PA · Partial reset (capped growth)
- Current annual tax
- $775 · $65/mo
- Projected year-2 tax
- $1,098 · $91/mo
- Expected delta
- +$322/yr (+$27/mo · 41.6%)
ⓘ Screening estimate from a state-policy table — verify with the county assessor before closing.
Climate risk First Street
- Flood 5/10 Major FEMA zone X (unshaded) · 24% chance over 30 yrs
- Wildfire 1/10 Low
- Heat 4/10 Moderate 7 d/yr ≥91°F today · 18 d/yr by 30 yrs out
- Wind 2/10 Low
- Air quality 2/10 Low 1 unhealthy d/yr today · 3 by 30 yrs out
Nearby sold comps map
Loading sold comps map…
Walkable amenities ~0.75 mi
Loading nearby amenities…
Taxation est. · year 1
- Rental income
- $14,692
- − Mortgage interest
- −$5,036
- − Property taxes
- −$775
- − Insurance
- −$450
- − Repairs & maintenance
- −$1,175
- − Management
- −$1,175
- − Depreciation
- −$2,615
- Taxable income
- $3,465
- Est. tax owed @ 24.0%
- −$832
- After-tax cash flow
- $3,893/yr
For passive investors: Depreciation is non-cash, so a rental often shows a tax loss while cash-flowing — sheltering income. Rental losses are passive: they offset passive income freely, and up to $25,000/yr can offset ordinary (W-2) income if you actively participate and your MAGI is under $100k (phasing out to $0 by $150k); unused losses carry forward. On sale, claimed depreciation is recaptured at up to 25%, and gains may owe capital-gains tax (a 1031 exchange can defer both). Figures are a year-1 estimate at your 24.0% rate — not tax advice; consult a CPA.
Schools (NCES district)
- District
- Altoona Area SD
- NCES district ID
- 4202340
- Math proficiency
- 30% ▼ -15.00%
- Reading proficiency
- 44% ▼ -15.00%
- Median HH income
- $38,465
- Composite
- 30.85/100
- National rank
- #6130
- State rank
- #406 of 539 in PA
Livability — Altoona
- Score
- 79/100
- State rank
- #237
- US rank
- #2060
Category grades
Schools grade is shown separately in the Schools card above.
Census & demographics
- Census place
- Altoona, PA
- County
- Blair County · 59,867 people
- City population
- 59,867
- Metro
- Altoona, PA
- Population (ZIP)
- 33,515
- Household income
- $58,070
- Rent vs Own
- Severe rent burden
- 715.0
Population outlook (Blair County) Hauer SSP2
- Today (2025)
- 121,571 people
- By 2030
- 117,966 · -3.0%
- By 2040
- 109,174 · -10.2%
- By 2050
- 99,542 · -18.1%
- By 2075
- 76,775 · -36.8%
- By 2100
- 54,326 · -55.3%
Race, ethnicity, and origin ACS 2023
- Neighborhood character
- Predominantly White (90%)
- Race & ethnicity
- White 90% Two or more races 5% Black 3% Hispanic / Latino 1%
- Common ancestry
- Romanian 5% Slovak 2% Lithuanian 2%
- Foreign-born
- 1% · Vietnam
- Languages at home
- 97% English-only · German/W. Germanic 1% Spanish 1%
Political lean MEDSL · Blair
- 2024 margin
- Solid R (+43.5) · D 27.9% · R 71.4%
- 2008→2024 swing
- -19.2pp toward R · 2008: -24.3pp · 2024: -43.5pp
- All cycles
- 2024: R+43.5 2020: R+43.5 2016: R+46.4 2012: R+33.5 2008: R+24.3
Not yet ingested
- Civics
- —
Market trends
- HPI YoY
- ▼ -60.97%
- Current HPI
- 183.9907
- Rent YoY
- —
- Metro
- Altoona, PA
- State GDP YoY
- ▲ 1.68%
- F500 in state
- 34
Industry mix (Fortune 500 HQ in PA)
| Industry | F500 HQs | Revenue |
|---|---|---|
| Healthcare | 2 | $309B |
|
||
| Insurance | 2 | $27B |
|
||
| Telecommunications / Media | 1 | $124B |
|
||
| Industrial Distribution | 1 | $22B |
|
||
| Financial Services | 1 | $20B |
|
||
| Chemicals / Materials | 1 | $18B |
|
||
Price history
-10.1% since first listed2 events — show timeline
- 2026-06-10 Price Changed $89,900 AHARMLS
- 2026-05-11 Listed $100,000 AHARMLS
Property tax history
-3.4%/yrLatest (2025): $775 · +13.0% YoY. Source: county tax records.
Cash-flow waterfall
monthlySold comps — $/sqft
last 12 mo · ≤1 miLoading sold comps…