 🏷️ Likely Rental
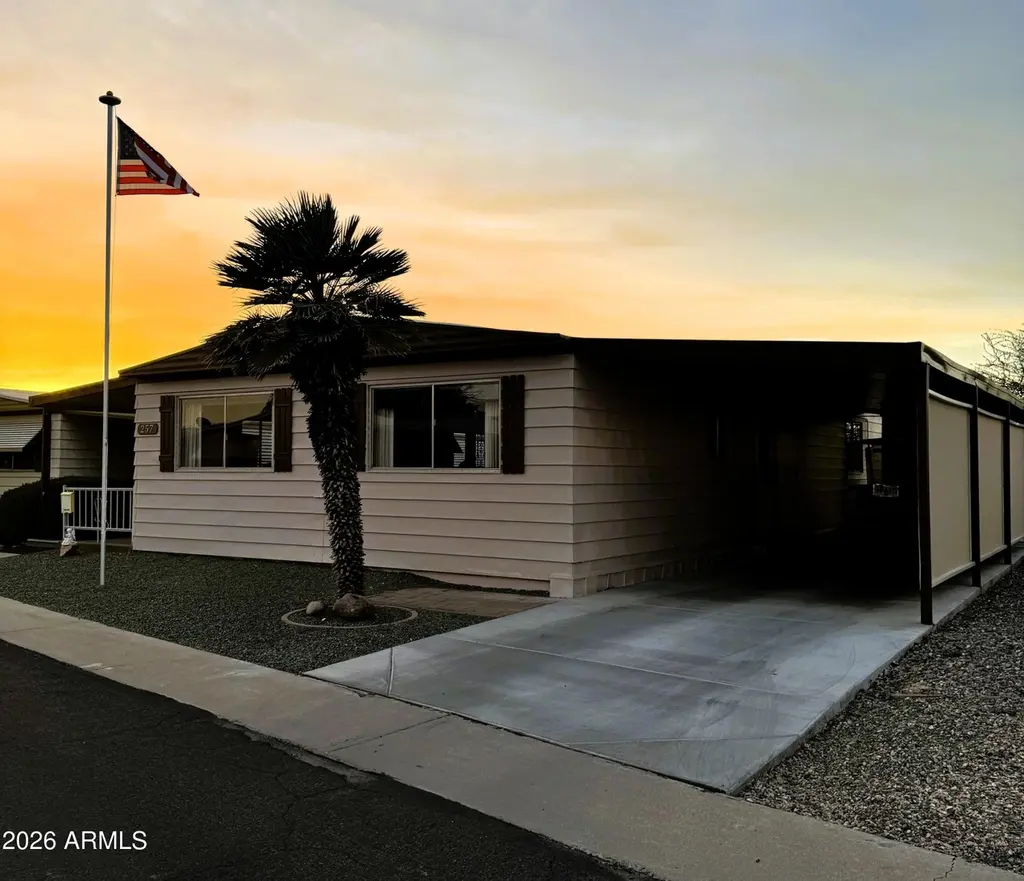
10701 N 99th Ave, Ave #257 · Peoria, AZ
Flood risk 1/10 · Minimal
- FEMA flood zone
- X (shaded)
- Chance of flooding over 30 yrs
- 0.0%
- Est. flood insurance / yr
- $507 – $1,088
Fire risk 1/10 · Minimal
- Est. fire insurance / yr
- $610 – $1,132
Heat risk 9/10 · Severe
- Hot days now (above 113°F)
- 7 days/yr
- Hot days in 30 yrs
- 17 days/yr
Wind risk 1/10 · Minimal
- Chance of severe wind over 30 yrs
- —
Air-quality risk 2/10 · Minimal
- Unhealthy air days now
- 1 days/yr
- Unhealthy air days in 30 yrs
- 1 days/yr
Risk factors via First Street. Map © Google.
Why this score? — see what drove the B grade
The composite is a weighted blend of 9 inputs, each scored 0–100. Each bar is that input's sub-score; the figure is the points it added to the 100-point composite (weight × sub-score).
- Cash flow +30.0/30.0
- 1% rule +10.0/10.0
- DSCR +10.0/10.0
- ARV discount +7.5/15.0
- Livability +3.8/5.0
- Condition / age +3.8/5.0
- Schools +3.5/10.0
- Rent growth +2.7/5.0
- Appreciation +0.0/10.0
$49,500
🖨 Deal sheet (PDF) 📄 Offer letter ✓ Due diligence
Listing remarks
NEW PRICE! Very nice 2 bedroom, 2 bath ground set home. Open concept featuring spacious living/family room, formal dining area with built-in hutch. Cozy kitchen incl. gas cook top & built-in oven, dishwasher, refrigerator. Extended covered patio is great for quiet relaxation or entertaining friends/family. Two car [concrete] carport & extra storage space. Freshly painted exterior. Apollo Village is a pet friendly 55 + age restricted community. Park amenities include heated community pool/spa, clubhouse-lounge, fitness room. weekly social events & Bingo! On-site park management. Park approval is required, lot rent is $891/mo. Great location, borders Sun City, near hospital/
Key facts
- Extra storage space
- Cozy kitchen
- Open concept
Tags
Property features AI
Finance
- Other: Lot information source not available
- HOA & community: Land lease $891 monthly; Community pool; Community spa (heated); Community laundry; Fitness center; No association fees included
Exterior
- Parking: 2 covered parking spaces; 2 carport spaces
- Utilities: City water; Public sewer
- Home design: Manufactured/mobile home; Leasehold ownership; Asphalt road access
- Construction: Aluminum siding; Wood frame construction; Painted exterior; Metal roof with reflective coating
- Exterior features: Shed(s); Storage; Desert front and back; Partial block fencing
Interior
- Kitchen: Refrigerator; Dishwasher; Laminate countertops
- Bedrooms: 2 possible bedrooms
- Flooring: Carpet; Laminate
- Bathrooms: 2 full bathrooms
- Heating & cooling: Natural gas heating; Central air; Ceiling fans
- Interior features: Full bath in master bedroom; Laminate counters; Storage
- Laundry & utility: Washer/dryer hookup only; Other laundry area
Neighborhood map
What this means for you Summary
Snapshot
- This is a 2-bed/2.0-bath manufactured listed at $50k. Condition is rated good.
Deal economics
- At list price, monthly cash flow is $1k ($14k/yr) — positive.
- The deal already cash-flows at list — no discount required.
- Meets the 1% rule at list price ($2k rent vs $50k).
- Recommended offer: $48k (3.0% below list) — sets the bar for market timing.
- Cap rate 35.4% vs local median 3.3% in Peoria — top-decile yield for the area; either an underpriced asset or a hidden risk that comps aren't pricing in. Stress-test before assuming the spread holds.
Location & tenants
- Location reads 76/100 on livability (#14 in AZ, #3,603 nationally) — a middle-class / working-renter tenant base. Strengths: housing A+, commute A, employment A; Watch: cost of living C-, amenities D, health & safety F.
- Peoria Unified School District (4237) (suburban): math 36% / reading 42% proficiency, ranked #64 of 249 in AZ (top 26%) — families likely to look elsewhere, expect single-tenant / working-renter base with shorter leases.
- Market conditions: Rents flat; 333 active listings in the ZIP; 32 comparable units currently listed for rent nearby; rentals at typical pace (median 26d on market — plan ~3-4 weeks tenant-placement turnaround); 36,011 units permitted in Maricopa County in 2024 (12,801 in 5+ unit buildings).
- This rent runs 35% of the median local income ($67k/yr) — at the standard rent-burdened threshold; future hikes will face affordability resistance.
Forward outlook
- Local home prices are declining (-3.0%/yr); year-one equity from $342 of loan paydown is wiped out by about $1k of value loss. Plan a longer hold.
- Maricopa County population projected at +38% by 2050 — long-run rental-demand tailwind backs the buy-and-hold thesis.
- At projected returns (-3.0% appreciation + 0.6% rent growth), your $14k cash investment doubles in ~2 years — after that, you're playing with house money.
Negotiation context
- It's been on market 58 days — a 3% lower offer ($48k) is reasonable based on typical stale-listing flexibility.
- 2 sale attempts; this cycle's ask has dropped $20k (29%) from the opening price — seller is motivated, your offer sets the floor, not the list.
Risks & watch-outs
- Climate carrying-cost: extreme-heat days projected 7→17/yr by 2055 (HVAC capex compounding) — expect insurance premiums to compound above CPI over the hold.
Questions for the listing agent
- It's been on market 58 days. Have you received any prior offers? Is the seller open to a 3% concession, seller financing, or rate buy-down credit?
- Built in 1976 — when were the roof, HVAC, electrical panel, plumbing, and water heater last replaced?
- Is there a deadline driving the sale (1031 exchange, divorce, estate, relocation)? That informs how much negotiation room exists.
- Schools are B-rated — typically a magnet for longer-tenancy family renters. What's the average tenant stay here, and is there a school-zone premium baked into asking?
- What's the average days-on-market for RENTAL listings here right now (not sales)? A rising rental-DOM trend means longer vacancies and softer asking-rent achievability than the comps imply.
- What's the recent tenant-quality profile in this submarket — average credit score on applications, eviction rate, late-payment / NSF rate, and stable-employment percentage? A property-management company in the area should have these aggregated.
- How much new for-sale + rental construction is in the pipeline within 1–3 miles? Heavy new supply typically softens prices + rents 12–24 months out; constrained supply supports both.
Investment metrics
- 1% rule
- 3.95% ✓
- Cap rate
- 35.40%
- Cash-on-cash
- 103.96%
- DSCR
- 5.63
- GRM
- 2.1
CMA / ARV
- ARV (median comp)
- $100,281
- List price
- $49,500
- Delta
- -50.64%
- Verdict
- UNDERPRICED
- Comps
- 20 within 1.0 mi
Show comp detail 12 sales within ~0.75 mi
| Address | Dist | Beds/Ba | Sqft | Sold | Price | $/sf | Match |
|---|---|---|---|---|---|---|---|
| 10701 N 99 Ave #209 | 0.00mi | 3/2.0 (+1) | 1,440 (+9%) | 1mo | $83,000 | $58 | 79 |
| 11275 N 99th Ave #118 | 0.22mi | 3/2.0 (+1) | 1,273 (-4%) | 2mo | $265,000 | $208 | 76 |
| 10701 N 99th Ave #115 | 0.03mi | 3/2.0 (+1) | 1,248 (-6%) | 11mo | $82,900 | $66 | 75 |
| 10701 N 99th Ave #254 | 0.03mi | 2/2.0 | 1,200 (-9%) | 12mo | $43,000 | $36 | 73 |
| 11275 N 99th Ave #119 | 0.22mi | 3/2.0 (+1) | 1,392 (+6%) | 4mo | $265,000 | $190 | 72 |
| 11275 N 99th Ave #61 | 0.23mi | 3/2.0 (+1) | 1,402 (+6%) | 3mo | $268,500 | $192 | 72 |
| 10701 N 99th Ave #231 | 0.03mi | 2/2.0 | 1,196 (-9%) | 14mo | $45,000 | $38 | 71 |
| 11275 N 99th Ave #31 | 0.19mi | 3/2.0 (+1) | 1,345 (+2%) | 15mo | $281,000 | $209 | 70 |
| 10701 N 99th Ave #44 | 0.03mi | 2/2.0 | 1,200 (-9%) | 18mo | $100,000 | $83 | 68 |
| 10201 N 99th Ave #166 | 0.45mi | 3/2.0 (+1) | 1,248 (-6%) | 8mo | $55,000 | $44 | 58 |
| 11000 N 91st Ave #101 | 0.71mi | 2/2.0 | 1,350 (+2%) | 10mo | $120,000 | $89 | 54 |
| 11275 N 99th Ave #1 | 0.31mi | 3/2.0 (+1) | 1,152 (-13%) | 8mo | $210,000 | $182 | 53 |
Match score weights: distance 35% · size 25% · config 20% · recency 20%. Top-matched comps best support the ARV.
Projected returns pro-forma
-3.0% appreciation · 0.62% rent growth · sell at horizon
- IRR
- —
- Equity multiple
- 5.61×
- Total profit
- $63,914
- Equity at exit
- $7,381
- IRR
- —
- Equity multiple
- 10.84×
- Total profit
- $136,376
- Equity at exit
- $4,280
Cash invested: $13,860 (down + closing). Projections, not guarantees.
Landlord ↔ Tenant lean methodology
- Overall (STATE)
- 87 Strongly Landlord-Friendly
- State Arizona
- 87 Strongly Landlord-Friendly · R+3
- County
- — inherits STATE
- City
- — inherits STATE
ZIP-level market 85345
- Home prices YoY
- -19.8%
- Rents YoY
- 0.6%
- Active inventory
- 333
- Price-to-rent
- 2.1×
Monthly cashflow live
- Estimated rent
- $1,953 high interval (Pro) →
- Mortgage (P&I)
- −$260
- Tax est. 1.5%
- −$62 /mo · $742/yr
- Insurance
- −$21
- HOA
- −$0
- Vacancy / Maint / Mgmt
- −$410
- Net cashflow
- $1,201
Break-even live
Sensitivity live
| Price | -10% $1,235 | -5% $1,218 | +0% $1,201 | +5% $1,184 | +10% $1,167 |
|---|---|---|---|---|---|
| Rent | -10% $1,046 | -5% $1,124 | +0% $1,201 | +5% $1,278 | +10% $1,355 |
| Rate | -1.0pp $1,226 | -0.5pp $1,213 | base $1,201 | +0.5pp $1,188 | +1.0pp $1,175 |
UW: 25.0% down · 7.5% · 30yr · 1.5% tax · 5.0% vac · 8.0% maint · 8.0% mgmt
Financing live
Cash to close
- Down payment
- $12,375
- Closing costs
- $1,485
- Reserves months
- —
- Total cash needed
- —
Loan-product check · same deal, 3 products live
Conventional
25% down · 7.5% · 30yr
- Down + closing
- —
- Monthly P&I
- —
- Monthly cashflow
- —
- DSCR
- —
- Eligible?
- —
Personal DTI + credit; lowest rate.
DSCR
20% down · 8.5% · 30yr
- Down + closing
- —
- Monthly P&I
- —
- Monthly cashflow
- —
- DSCR
- —
- Eligible?
- —
No personal income docs; deal must DSCR.
Hard money
10% down · 12.0% · 12mo
- Down + closing
- —
- Monthly P&I
- —
- Monthly cashflow
- —
- DSCR
- —
- Eligible?
- —
Short-term bridge; refi at stabilization.
Rent comps 32 comps
| Address | Beds | Baths | Sqft | Rent | $/sqft | DOM | Units | Dist |
|---|---|---|---|---|---|---|---|---|
| 10822 N Balboa Dr Sun City, AZ | 2.0 | 1.0 | 942 | $3,000 | $3.18 | 25d | 1 | 0.33mi |
| 10022 W Lakeview Cir N Sun City, AZ | 2.0 | 2.0 | 1575 | $2,800 | $1.78 | 25d | 1 | 0.48mi |
| 10316 N 94th Ln Peoria, AZ | 3.0 | 2.0 | 1352 | $2,000 | $1.48 | 25d | 1 | 0.51mi |
| 10110 N 97th Dr Unit A Peoria, AZ | 2.0 | 1.5 | 1025 | $1,500 | $1.46 | 25d | 1 | 0.57mi |
| 9426 W Monroe St Peoria, AZ | 3.0 | 3.5 | 1405 | $1,800 | $1.28 | 17d | 1 | 0.61mi |
| 10104 N 96th Dr Unit A Peoria, AZ | 2.0 | 2.0 | 1072 | $1,750 | $1.63 | 25d | 1 | 0.63mi |
| 9626 W Mountain View Rd Unit A Peoria, AZ | 2.0 | 2.0 | 1156 | $1,500 | $1.30 | 44d | 1 | 0.76mi |
| 9323 W Ironwood Dr Peoria, AZ | 3.0 | 2.0 | 1306 | $1,985 | $1.52 | 25d | 1 | 0.85mi |
| 9323 W Ironwood Dr Peoria, AZ | 3.0 | 2.0 | 1306 | $2,085 | $1.60 | 44d | 1 | 0.85mi |
| 11411 N 91st Ave Unit 134 Peoria, AZ | 3.0 | 2.0 | 1310 | $1,599 | $1.22 | 44d | 1 | 0.90mi |
| 10350 W Camden Ave Sun City, AZ | 2.0 | 2.0 | 1413 | $2,850 | $2.02 | 25d | 1 | 0.99mi |
| 10101 N 91st Ave #109 Peoria, AZ | 2.0 | 2.5 | 1161 | $1,395 | $1.20 | 3d | 1 | 1.05mi |
| 8930 W Monroe St Peoria, AZ | 3.0 | 2.0 | 1300 | $1,899 | $1.46 | 44d | 2 | 1.06mi |
| 8930 W Monroe St Peoria, AZ | 3.0 | 2.0 | 1300 | $2,099 | $1.61 | 25d | 1 | 1.06mi |
| 9002 W Malapai Dr Peoria, AZ | 3.0 | 2.0 | 1270 | $2,040 | $1.61 | 21d | 1 | 1.10mi |
| 12751 N Plaza Del Rio Blvd Peoria, AZ | 1.0–2.0 | 1.0–2.0 | 1007 | $1,890 | $1.88 | 2d | 10 | 1.12mi |
| 9680 W Olive Ave Peoria, AZ | 1.0–3.0 | 1.0–2.0 | 850 | $1,540 | $1.81 | 0d | 10 | 1.14mi |
| 8821 W Sahuaro Dr Peoria, AZ | 3.0 | 2.0 | 1074 | $1,695 | $1.58 | 0d | 1 | 1.15mi |
| 8821 W Sahuaro Dr Peoria, AZ | 3.0 | 2.0 | 1074 | $1,595 | $1.49 | 4d | 1 | 1.15mi |
| 8821 W Sahuaro Dr Peoria, AZ | 3.0 | 2.0 | 1074 | $1,595 | $1.49 | 25d | 1 | 1.15mi |
| 10319 W Oakmont Dr Sun City, AZ | 2.0 | 2.0 | 1274 | $2,900 | $2.28 | 25d | 1 | 1.21mi |
| 10221 N 87th Ln Peoria, AZ | 3.0 | 2.0 | 1232 | $2,059 | $1.67 | 44d | 1 | 1.28mi |
| 9625 W Olive Ave Peoria, AZ | 1.0–3.0 | 1.0–3.0 | 1485 | $2,224 | $1.50 | 0d | 9 | 1.33mi |
| 8834 W Purdue Ave Peoria, AZ | 3.0 | 2.0 | 1319 | $1,800 | $1.36 | 4d | 1 | 1.33mi |
| 10729 W Sun City Blvd Sun City, AZ | 3.0 | 2.0 | 1697 | $3,500 | $2.06 | 25d | 1 | 1.33mi |
| 8650 W Peoria Ave Peoria, AZ | 1.0–2.0 | 1.0–2.0 | 836 | $1,492 | $1.78 | 0d | 18 | 1.38mi |
| 8763 W Paradise Dr Peoria, AZ | 3.0 | 2.0 | 1575 | $1,800 | $1.14 | 44d | 1 | 1.39mi |
| 8782 W Shaw Butte Dr Peoria, AZ | 3.0 | 2.0 | 1575 | $2,200 | $1.40 | 25d | 1 | 1.41mi |
| 8560 W Peoria Ave Peoria, AZ | 2.0 | 1.0 | 888 | $1,399 | $1.58 | 0d | 8 | 1.46mi |
| 10846 N 109th Ave Sun City, AZ | 3.0 | 2.0 | 1623 | $3,500 | $2.16 | 14d | 1 | 1.49mi |
| 8940 W Olive Ave Peoria, AZ | 2.0 | 2.0 | 897 | $1,400 | $1.56 | 17d | 1 | 1.49mi |
| 8940 W Olive Ave Peoria, AZ | 2.0 | 2.0 | 1446 | $1,600 | $1.11 | 44d | 1 | 1.49mi |
Listing history 17 events
-
2026-06-21days on market $49,500 Active 58 DOM
-
2026-06-18days on market $49,500 Active 55 DOM
-
2026-06-17days on market $49,500 Active 54 DOM
-
2026-06-16days on market $49,500 Active 53 DOM
-
2026-06-15days on market $49,500 Active 52 DOM
-
2026-06-13days on market $49,500 Active 50 DOM
-
2026-06-13statusdays on market $49,500 Active 49 DOM
-
2026-06-09days on market $49,500 Under Contract Accepting Backups 46 DOM
-
2026-06-08days on market $49,500 Under Contract Accepting Backups 45 DOM
-
2026-06-07statusdays on market $49,500 Under Contract Accepting Backups 44 DOM
-
2026-06-04days on market $49,500 Active 41 DOM
-
2026-06-03days on market $49,500 Active 40 DOM
-
2026-06-02days on market $49,500 Active 39 DOM
-
2026-06-01days on market $49,500 Active 38 DOM
-
2026-05-31days on market $49,500 Active 37 DOM
-
2026-05-07price $55,000 815-char remark
-
2026-04-24$70,000 Active 815-char remark
ⓘ Source: listings_history table (triggers on properties + properties_extension) + one-shot
backfill from property_details.listing_events for pre-trigger history.
Climate risk First Street
- Flood 1/10 Low FEMA zone X (shaded) · 0% chance over 30 yrs
- Wildfire 1/10 Low
- Heat 9/10 Extreme 7 d/yr ≥113°F today · 17 d/yr by 30 yrs out
- Wind 1/10 Low
- Air quality 2/10 Low 1 unhealthy d/yr today · 1 by 30 yrs out
Nearby sold comps map
Loading sold comps map…
Walkable amenities ~0.75 mi
Loading nearby amenities…
Taxation est. · year 1
- Rental income
- $23,435
- − Mortgage interest
- −$2,773
- − Property taxes
- −$742
- − Insurance
- −$248
- − Repairs & maintenance
- −$1,875
- − Management
- −$1,875
- − Depreciation
- −$1,440
- Taxable income
- $14,483
- Est. tax owed @ 24.0%
- −$3,476
- After-tax cash flow
- $10,933/yr
For passive investors: Depreciation is non-cash, so a rental often shows a tax loss while cash-flowing — sheltering income. Rental losses are passive: they offset passive income freely, and up to $25,000/yr can offset ordinary (W-2) income if you actively participate and your MAGI is under $100k (phasing out to $0 by $150k); unused losses carry forward. On sale, claimed depreciation is recaptured at up to 25%, and gains may owe capital-gains tax (a 1031 exchange can defer both). Figures are a year-1 estimate at your 24.0% rate — not tax advice; consult a CPA.
Condition & rehab AI · 1 photo
This 2-bedroom, 2-bath manufactured home in a pet-friendly 55+ community is in good condition with fresh paint and a spacious layout. Minor updates to the exterior and appliances would significantly enhance its value.
Value-add opportunities
- Both Paint exterior — Fresh paint enhances curb appeal and value
- Resale Upgrade appliances — Modern appliances improve kitchen functionality and appeal
- Both Install smart home devices — Enhances home's modern appeal and convenience
Renovation cost estimate screening
Value-add ROI direction
- Both Paint exterior — Fresh paint enhances curb appeal and value ↑
- Resale Upgrade appliances — Modern appliances improve kitchen functionality and appeal ↑
- Both Install smart home devices — Enhances home's modern appeal and convenience ↑
ⓘ Cost ranges are severity-bucket heuristics (US national rule-of-thumb). Get contractor quotes + a written scope before underwriting a rehab budget.
Schools (NCES district)
- District
- Peoria Unified School District (4237)
- NCES district ID
- 0406250
- Math proficiency
- 36% ▼ -14.00%
- Reading proficiency
- 42% ▼ -8.00%
- Median HH income
- $60,171
- Composite
- 34.62/100
- National rank
- #5152
- State rank
- #64 of 249 in AZ
Livability — Peoria
- Score
- 76/100
- State rank
- #14
- US rank
- #3603
Category grades
Schools grade is shown separately in the Schools card above.
Census & demographics
- Census place
- Peoria, AZ
- County
- Maricopa County · 4,537,380 people
- City population
- 206,687
- Metro
- Phoenix-Mesa-Chandler, AZ
- Population (ZIP)
- 60,918
- Household income
- $67,380
- Rent vs Own
- Severe rent burden
- 1879.0
Population outlook (Maricopa County) Hauer SSP2
- Today (2025)
- 4,979,203 people
- By 2030
- 5,378,229 · +8.0%
- By 2040
- 6,156,598 · +23.6%
- By 2050
- 6,872,376 · +38.0%
- By 2075
- 8,401,270 · +68.7%
- By 2100
- 9,247,439 · +85.7%
Race, ethnicity, and origin ACS 2023
- Neighborhood character
- Diverse neighborhood (Simpson 0.62)
- Race & ethnicity
- White 51% Hispanic / Latino 34% Two or more races 14% Black 5% Asian 4% Native American 2%
- Hispanic origin (detail)
- Mexican 29%
- Common ancestry
- Romanian 2% Italian 2% Slovak 1%
- Foreign-born
- 13% · Canada, Vietnam
- Languages at home
- 76% English-only · Spanish 18% Other Indo-European 1% Vietnamese 1%
Political lean MEDSL · Maricopa
- 2024 margin
- Toss-up / Even · D 47.7% · R 51.2% · Other 1.1%
- 2008→2024 swing
- +7.1pp toward D · 2008: -10.6pp · 2024: -3.5pp
- All cycles
- 2024: R+3.5 2020: D+2.2 2016: R+3.5 2012: R+12.0 2008: R+10.6
Not yet ingested
- Civics
- —
Market trends
- HPI YoY
- ▼ -80.77%
- Current HPI
- 328.1069
- Rent YoY
- ▲ 0.62%
- Metro
- Phoenix-Mesa-Chandler, AZ
- State GDP YoY
- ▲ 4.54%
- F500 in state
- 20
Industry mix (Fortune 500 HQ in AZ)
| Industry | F500 HQs | Revenue |
|---|---|---|
| Technology | 2 | $13B |
|
||
| Mining / Metals | 1 | $23B |
|
||
| Environmental Services | 1 | $16B |
|
||
| Metals / Steel | 1 | $14B |
|
||
| Technology Distribution | 1 | $9B |
|
||
| Homebuilding | 1 | $8B |
|
||
Price history
-29.3% since first listed5 events — show timeline
- 2026-06-12 Relisted — ARMLS
- 2026-06-04 Contingent — ARMLS
- 2026-05-22 Price Changed $49,500 ARMLS
- 2026-05-07 Price Changed $55,000 ARMLS
- 2026-04-24 Listed $70,000 ARMLS
Cash-flow waterfall
monthlySold comps — $/sqft
last 12 mo · ≤1 miLoading sold comps…