6222 Sewan Ave · Carmichael, CA
Flood risk 7/10 · Major
- FEMA flood zone
- X (unshaded)
- Chance of flooding over 30 yrs
- 0.96%
- Est. flood insurance / yr
- $507 – $1,088
Fire risk 1/10 · Minimal
- Est. fire insurance / yr
- $659 – $1,223
Heat risk 7/10 · Major
- Hot days now (above 102°F)
- 6 days/yr
- Hot days in 30 yrs
- 13 days/yr
Wind risk 1/10 · Minimal
- Chance of severe wind over 30 yrs
- —
Air-quality risk 10/10 · Severe
- Unhealthy air days now
- 34 days/yr
- Unhealthy air days in 30 yrs
- 36 days/yr
Risk factors via First Street. Map © Google.
Why this score? — see what drove the B+ grade
The composite is a weighted blend of 9 inputs, each scored 0–100. Each bar is that input's sub-score; the figure is the points it added to the 100-point composite (weight × sub-score).
- Cash flow +30.0/30.0
- ARV discount +15.0/15.0
- 1% rule +10.0/10.0
- DSCR +10.0/10.0
- Livability +3.2/5.0
- Schools +3.1/10.0
- Condition / age +2.5/5.0
- Rent growth +2.2/5.0
- Appreciation +0.0/10.0
$93,000
🖨 Deal sheet 📄 Offer letter ✓ Due diligence
Key facts
- Parking
- Built 1974
- Listed 83 days
Neighborhood map
What this means for you Summary
Snapshot
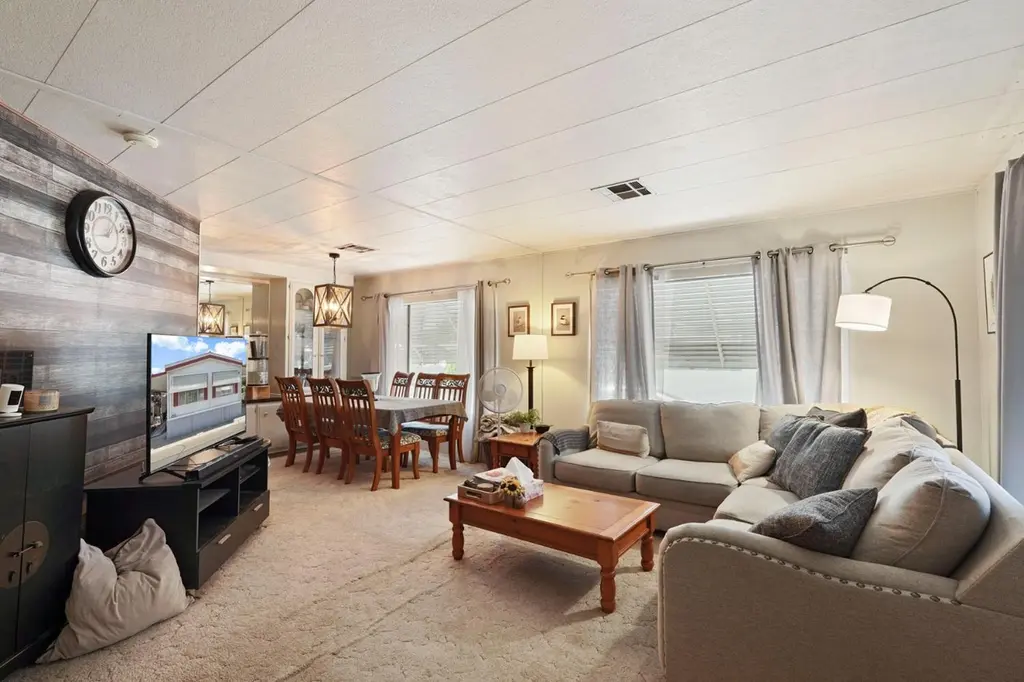
- This is a 2-bed/2.0-bath manufactured listed at $93k.
Deal economics
- At list price, monthly cash flow is $937 ($11k/yr) — positive.
- The deal already cash-flows at list — no discount required.
- Meets the 1% rule at list price ($2k rent vs $93k).
- Recommended offer: $87k (6.0% below list) — sets the bar for market timing.
- Cap rate 19.2% vs local median 2.6% in Carmichael — top-decile yield for the area; either an underpriced asset or a hidden risk that comps aren't pricing in. Stress-test before assuming the spread holds.
Location & tenants
- Location reads 63/100 on livability (#471 in CA) — a middle-class / working-renter tenant base. Strengths: amenities A-, housing B+, employment B; Watch: schools C-, crime F, commute F.
- Twin Rivers Unified (suburban): math 29% / reading 37% proficiency, ranked #970 of 1,400 in CA (top 69%) — families likely to look elsewhere, expect single-tenant / working-renter base with shorter leases; 76% free/reduced lunch — lower-income household profile, screen leases tightly.
- Market conditions: Rents soft (-1.1%/yr); 83 active listings in the ZIP; 31 comparable units currently listed for rent nearby; rentals at typical pace (median 18d on market — plan ~3-4 weeks tenant-placement turnaround); 6,825 units permitted in Sacramento County in 2024 (1,752 in 5+ unit buildings).
- This rent runs 41% of the median local income ($61k/yr) — at the standard rent-burdened threshold; future hikes will face affordability resistance.
Forward outlook
- Local home prices are declining (-3.0%/yr); year-one equity from $643 of loan paydown is wiped out by about $3k of value loss. Plan a longer hold.
- Sacramento County population projected at +17% by 2050 — long-run rental-demand tailwind backs the buy-and-hold thesis.
- At projected returns (-3.0% appreciation + 0.0% rent growth), your $26k cash investment doubles in ~3 years — after that, you're playing with house money.
Negotiation context
- It's been on market 83 days — a 6% lower offer ($87k) is reasonable based on typical stale-listing flexibility.
Risks & watch-outs
- Watch-outs: flood insurance adds $66/mo.
- Climate carrying-cost: major flood risk; extreme-heat days projected 6→13/yr by 2055 (HVAC capex compounding) — expect insurance premiums to compound above CPI over the hold.
Questions for the listing agent
- It's been on market 83 days. Have you received any prior offers? Is the seller open to a 6% concession, seller financing, or rate buy-down credit?
- Built in 1974 — when were the roof, HVAC, electrical panel, plumbing, and water heater last replaced?
- What's the actual annual flood-insurance premium (NFIP or private), and is the property in a SFHA with mandatory coverage?
- Why hasn't it sold? Are there any deal-killer items the seller is aware of (foundation, flood, title, zoning, code violations)?
- Is there a deadline driving the sale (1031 exchange, divorce, estate, relocation)? That informs how much negotiation room exists.
- Crime grade is F in this area — have there been break-ins, vandalism, or insurance claims at this property in the last 3 years? What carrier currently insures it and at what premium?
- What's the average days-on-market for RENTAL listings here right now (not sales)? A rising rental-DOM trend means longer vacancies and softer asking-rent achievability than the comps imply.
- What's the recent tenant-quality profile in this submarket — average credit score on applications, eviction rate, late-payment / NSF rate, and stable-employment percentage? A property-management company in the area should have these aggregated.
- How much new for-sale + rental construction is in the pipeline within 1–3 miles? Heavy new supply typically softens prices + rents 12–24 months out; constrained supply supports both.
Investment metrics
- 1% rule
- 2.24% ✓
- Cap rate
- 19.24%
- Cash-on-cash
- 46.24%
- DSCR
- 3.06
- GRM
- 3.7
CMA / ARV
- ARV (median comp)
- $157,000
- List price
- $93,000
- Delta
- -40.76%
- Verdict
- UNDERPRICED
- Comps
- 20 within 1.0 mi
Show comp detail 12 sales within ~0.75 mi
| Address | Dist | Beds/Ba | Sqft | Sold | Price | $/sf | Match |
|---|---|---|---|---|---|---|---|
| 6206 Plymouth Rock Ln #110 | 0.17mi | 3/2.0 (+1) | 1,536 (+7%) | 1mo | $159,000 | $104 | 75 |
| 6222 Redcliff Dr #47 | 0.19mi | 2/2.0 | 1,344 (-7%) | 9mo | $54,900 | $41 | 73 |
| 6116 Mame Ct | 0.59mi | 2/2.0 | 1,440 (0%) | 3mo | $179,000 | $124 | 70 |
| 6641 Grosse Point Ct | 0.62mi | 2/2.0 | 1,464 (+2%) | 3mo | $175,000 | $120 | 66 |
| 6116 Mame Ct #905 | 0.59mi | 2/2.0 | 1,440 (0%) | 8mo | $100,000 | $69 | 66 |
| 6223 Lurline Ave | 0.10mi | 2/2.0 | 1,248 (-13%) | 9mo | $75,000 | $60 | 66 |
| 6637 Grosse Point Ct | 0.61mi | 3/2.0 (+1) | 1,536 (+7%) | 1mo | $95,000 | $62 | 55 |
| 6113 Summerset Ln | 0.72mi | 2/2.0 | 1,344 (-7%) | 1mo | $169,000 | $126 | 54 |
| 6621 Grosse Point Ct | 0.58mi | 2/2.0 | 1,248 (-13%) | 1mo | $130,000 | $104 | 50 |
| 6105 Meiggs Ct #1015 | 0.62mi | 2/2.0 | 1,645 (+14%) | 4mo | $160,000 | $97 | 44 |
| 6105 Mame Ct | 0.59mi | 3/2.0 (+1) | 1,248 (-13%) | 3mo | $85,000 | $68 | 43 |
| 6625 Shamus Ct | 0.54mi | 3/2.0 (+1) | 1,248 (-13%) | 8mo | $190,000 | $152 | 40 |
Match score weights: distance 35% · size 25% · config 20% · recency 20%. Top-matched comps best support the ARV.
Projected returns pro-forma
-3.0% appreciation · 0.0% rent growth · sell at horizon
- IRR
- 36.5%
- Equity multiple
- 2.48×
- Total profit
- $38,577
- Equity at exit
- $13,867
- IRR
- 41.5%
- Equity multiple
- 4.35×
- Total profit
- $87,134
- Equity at exit
- $8,041
Cash invested: $26,040 (down + closing). Projections, not guarantees.
Landlord ↔ Tenant lean methodology
- Overall (STATE)
- 18 Strongly Tenant-Friendly
- State California
- 18 Strongly Tenant-Friendly · D+13
- County
- — inherits STATE
- City
- — inherits STATE
ZIP-level market 95841
- Rents YoY
- -1.1%
- Active inventory
- 83
- Price-to-rent
- 3.7×
Monthly cashflow live
- Estimated rent
- $2,084 high interval (Pro) →
- Mortgage (P&I)
- −$488
- Tax est. 1.5%
- −$116 /mo · $1,395/yr
- Insurance
- −$39
- Flood insurance flood zone
- −$66 /mo · $798/yr
- HOA
- −$0
- Vacancy / Maint / Mgmt
- −$438
- Net cashflow
- $937
Break-even live
UW: 25.0% down · 7.5% · 30yr · 1.5% tax · 5.0% vac · 8.0% maint · 8.0% mgmt
Financing live
Cash to close
- Down payment
- $23,250
- Closing costs
- $2,790
- Reserves months
- —
- Total cash needed
- —
Loan-product check · same deal, 3 products live
Conventional
25% down · 7.5% · 30yr
- Down + closing
- —
- Monthly P&I
- —
- Monthly cashflow
- —
- DSCR
- —
- Eligible?
- —
Personal DTI + credit; lowest rate.
DSCR
20% down · 8.5% · 30yr
- Down + closing
- —
- Monthly P&I
- —
- Monthly cashflow
- —
- DSCR
- —
- Eligible?
- —
No personal income docs; deal must DSCR.
Hard money
10% down · 12.0% · 12mo
- Down + closing
- —
- Monthly P&I
- —
- Monthly cashflow
- —
- DSCR
- —
- Eligible?
- —
Short-term bridge; refi at stabilization.
Rent comps 31 comps
| Address | Beds | Baths | Sqft | Rent | $/sqft | DOM | Units | Dist |
|---|---|---|---|---|---|---|---|---|
| 5979 Devecchi Ave Citrus Heights, CA | 1.0–2.0 | 1.0–2.0 | 775 | $1,871 | $2.41 | 1d | 15 | 0.24mi |
| 6011 Shadow Ln Citrus Heights, CA | 1.0–2.0 | 1.0–2.0 | 779 | $2,348 | $3.01 | 1d | 15 | 0.37mi |
| 6104 Rockport Ln Citrus Heights, CA | 3.0 | 2.5 | 1150 | $2,295 | $2.00 | 21d | 1 | 0.42mi |
| 6219 Oak Valley Ln Citrus Heights, CA | 3.0 | 3.0 | 1304 | $2,295 | $1.76 | 17d | 1 | 0.45mi |
| 6219 Oak Valley Ln Citrus Heights, CA | 3.0 | 2.5 | 1304 | $2,295 | $1.76 | 43d | 1 | 0.45mi |
| 5922 Petaluma Ct Sacramento, CA | 2.0 | 2.0 | 1048 | $2,075 | $1.98 | 1d | 1 | 0.54mi |
| 6203 Ackland Ct Citrus Heights, CA | 3.0 | 1.5 | 1322 | $2,500 | $1.89 | 23d | 1 | 0.56mi |
| 5718 Manzanita Ave Carmichael, CA | 2.0 | 1.0 | 980 | $2,000 | $2.04 | 43d | 1 | 0.59mi |
| 5844 Garden Park Ct Unit RV 5853-D Carmichael, CA | 2.0 | 1.0 | 915 | $1,525 | $1.67 | 16d | 1 | 0.60mi |
| 5844 Garden Park Ct Unit RV 5877-B Carmichael, CA | 2.0 | 1.0 | 915 | $1,575 | $1.72 | 16d | 1 | 0.60mi |
| 5417 Olympic Way Sacramento, CA | 2.0 | 1.0 | 920 | $1,795 | $1.95 | 14d | 1 | 0.65mi |
| 5587 Keoncrest Cir Unit 2 Sacramento, CA | 2.0 | 1.5 | 900 | $2,000 | $2.22 | 1d | 1 | 0.69mi |
| 5233 Calistoga Way Sacramento, CA | 3.0 | 2.0 | 1200 | $2,495 | $2.08 | 1d | 1 | 0.81mi |
| 6025 Dewey Dr Citrus Heights, CA | 3.0 | 2.0 | 1847 | $2,500 | $1.35 | 23d | 1 | 0.97mi |
| 6558 Meadowcreek Way Citrus Heights, CA | 3.0 | 2.0 | 1304 | $2,500 | $1.92 | 43d | 1 | 0.99mi |
| 6687 Greenback Ln Citrus Heights, CA | 3.0 | 2.0 | 1323 | $2,495 | $1.89 | 17d | 1 | 1.04mi |
| 6225 Wildomar Way Carmichael, CA | 3.0 | 1.0 | 1040 | $3,000 | $2.88 | 43d | 1 | 1.10mi |
| 6319 Misty Wood Way Citrus Heights, CA | 3.0 | 2.0 | 1454 | $2,500 | $1.72 | 43d | 1 | 1.10mi |
| 6841 Concert Way Sacramento, CA | 2.0 | 2.0 | 1000 | $1,995 | $2.00 | 1d | 1 | 1.12mi |
| 6004 Rutland Dr Unit 128 Carmichael, CA | 2.0 | 1.0 | 900 | $1,495 | $1.66 | 3d | 1 | 1.13mi |
| 6600 Hillsdale Blvd Sacramento, CA | 3.0 | 3.0 | 1686 | $2,600 | $1.54 | 16d | 1 | 1.14mi |
| 5308 Winfield Way #2 Sacramento, CA | 3.0 | 1.5 | 1105 | $2,100 | $1.90 | 43d | 1 | 1.18mi |
| 6200 Osullivan Ln Sacramento, CA | 2.0 | 2.0 | 1316 | $1,775 | $1.35 | 7d | 1 | 1.19mi |
| 5425 Garfield Ave Sacramento, CA | 1.0–2.0 | 1.0–2.0 | 787 | $1,650 | $2.10 | 20d | 5 | 1.19mi |
| 5300 Winfield Way #2 Sacramento, CA | 3.0 | 1.5 | 1105 | $2,100 | $1.90 | 23d | 1 | 1.21mi |
| 5322 Hemlock St Sacramento, CA | 1.0–2.0 | 1.0 | 800 | $1,875 | $2.34 | 1d | 2 | 1.24mi |
| 6940 Trailride Way Citrus Heights, CA | 3.0 | 2.0 | 1527 | $2,695 | $1.76 | 43d | 1 | 1.30mi |
| 5233 Columbine Way Carmichael, CA | 3.0 | 2.0 | 1008 | $2,375 | $2.36 | 3d | 1 | 1.38mi |
| 4758 Greenholme Dr Sacramento, CA | 2.0 | 1.0 | 924 | $1,595 | $1.73 | 43d | 1 | 1.45mi |
| 7024 San Altos Cir Citrus Heights, CA | 2.0 | 2.0 | 1120 | $2,800 | $2.50 | 43d | 1 | 1.47mi |
| 5100 Garfield Ave Sacramento, CA | 1.0–2.0 | 1.0 | 917 | $1,970 | $2.15 | 43d | 1 | 1.48mi |
Listing history 13 events
-
2026-06-18days on market $93,000 Active 83 DOM
-
2026-06-17days on market $93,000 Active 82 DOM
-
2026-06-16days on market $93,000 Active 81 DOM
-
2026-06-15days on market $93,000 Active 80 DOM
-
2026-06-13days on market $93,000 Active 78 DOM
-
2026-06-13days on market $93,000 Active 77 DOM
-
2026-06-09days on market $93,000 Active 74 DOM
-
2026-06-08days on market $93,000 Active 73 DOM
-
2026-06-07days on market $93,000 Active 72 DOM
-
2026-06-03days on market $93,000 Active 68 DOM
-
2026-06-02days on market $93,000 Active 67 DOM
-
2026-06-01days on market $93,000 Active 66 DOM
-
2026-05-31days on market $93,000 Active 65 DOM
ⓘ Source: listings_history table (triggers on properties + properties_extension) + one-shot
backfill from property_details.listing_events for pre-trigger history.
Climate risk First Street
- Flood 7/10 Severe FEMA zone X (unshaded) · 96% chance over 30 yrs
- Wildfire 1/10 Low
- Heat 7/10 Severe 6 d/yr ≥102°F today · 13 d/yr by 30 yrs out
- Wind 1/10 Low
- Air quality 10/10 Extreme 34 unhealthy d/yr today · 36 by 30 yrs out
Nearby sold comps map
Loading sold comps map…
Walkable amenities ~0.75 mi
Loading nearby amenities…
Taxation est. · year 1
- Rental income
- $25,006
- − Mortgage interest
- −$5,209
- − Property taxes
- −$1,395
- − Insurance
- −$1,262
- − Repairs & maintenance
- −$2,000
- − Management
- −$2,000
- − Depreciation
- −$2,705
- Taxable income
- $10,432
- Est. tax owed @ 24.0%
- −$2,504
- After-tax cash flow
- $8,741/yr
For passive investors: Depreciation is non-cash, so a rental often shows a tax loss while cash-flowing — sheltering income. Rental losses are passive: they offset passive income freely, and up to $25,000/yr can offset ordinary (W-2) income if you actively participate and your MAGI is under $100k (phasing out to $0 by $150k); unused losses carry forward. On sale, claimed depreciation is recaptured at up to 25%, and gains may owe capital-gains tax (a 1031 exchange can defer both). Figures are a year-1 estimate at your 24.0% rate — not tax advice; consult a CPA.
Schools (NCES district)
- District
- Twin Rivers Unified
- NCES district ID
- 0601332
- Math proficiency
- 29% ▲ 2.00%
- Reading proficiency
- 37% ▲ 2.00%
- Median HH income
- $42,481
- Composite
- 30.67/100
- National rank
- #11437
- State rank
- #970 of 1400 in CA
Livability — Carmichael
- Score
- 63/100
- State rank
- #471
- US rank
- #15996
Category grades
Schools grade is shown separately in the Schools card above.
Census & demographics
- Census place
- Carmichael, CA
- County
- Sacramento County · 1,539,646 people
- City population
- 61,440
- Metro
- Sacramento-Roseville-Folsom, CA
- Population (ZIP)
- 20,500
- Household income
- $61,054
- Rent vs Own
- Severe rent burden
- 1353.0
Population outlook (Sacramento County) Hauer SSP2
- Today (2025)
- 1,660,763 people
- By 2030
- 1,732,990 · +4.3%
- By 2040
- 1,855,755 · +11.7%
- By 2050
- 1,941,335 · +16.9%
- By 2075
- 2,046,162 · +23.2%
- By 2100
- 1,961,444 · +18.1%
Race, ethnicity, and origin ACS 2023
- Neighborhood character
- Diverse neighborhood (Simpson 0.59)
- Race & ethnicity
- White 61% Hispanic / Latino 17% Two or more races 13% Black 9% Asian 6%
- Hispanic origin (detail)
- Mexican 13%
- Common ancestry
- Subsaharan African 5% Scotch-Irish 4% Lithuanian 2%
- Foreign-born
- 24% · Canada, China, Vietnam
- Languages at home
- 70% English-only · Russian/Polish/Slavic 11% Spanish 7% Other Indo-European 5%
Political lean MEDSL · Sacramento
- 2024 margin
- D (+19.7) · D 58.1% · R 38.4% · Other 3.5%
- 2008→2024 swing
- +0.7pp no change · 2008: 19.0pp · 2024: 19.7pp
- All cycles
- 2024: D+19.7 2020: D+25.3 2016: D+23.7 2012: D+16.3 2008: D+19.0
Not yet ingested
- Civics
- —
Market trends
- HPI YoY
- ▼ -227.82%
- Current HPI
- 369.8991
- Rent YoY
- ▼ -1.08%
- Metro
- Sacramento-Roseville-Folsom, CA
- State GDP YoY
- ▲ 3.21%
- F500 in state
- 116
Industry mix (Fortune 500 HQ in CA)
| Industry | F500 HQs | Revenue |
|---|---|---|
| Technology | 27 | $1,492B |
|
||
| Financial Services | 3 | $174B |
|
||
| Retail | 3 | $44B |
|
||
| Insurance | 3 | $26B |
|
||
| Media / Entertainment | 2 | $115B |
|
||
| Pharmaceuticals / Biotech | 2 | $62B |
|
||
Cash-flow waterfall
monthlySold comps — $/sqft
last 12 mo · ≤1 miLoading sold comps…