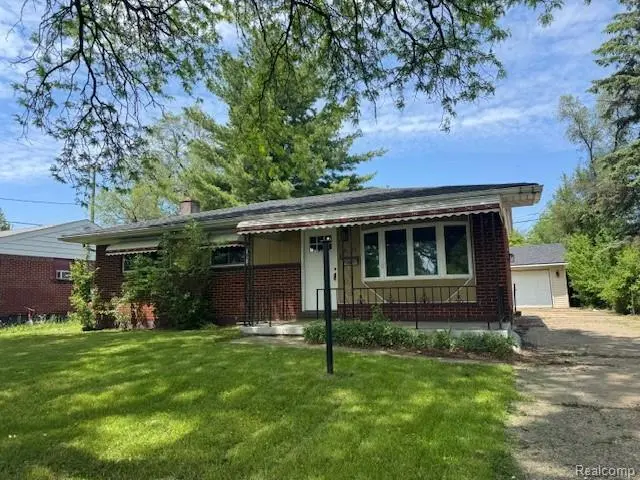
1622 W Home Ave · Flint, MI
Flood risk 1/10 · Minimal
- FEMA flood zone
- X (unshaded)
- Chance of flooding over 30 yrs
- 0.0%
- Est. flood insurance / yr
- $473 – $860
Fire risk 1/10 · Minimal
- Est. fire insurance / yr
- $784 – $1,456
Heat risk 2/10 · Minimal
- Hot days now (above 96°F)
- 7 days/yr
- Hot days in 30 yrs
- 15 days/yr
Wind risk 2/10 · Minimal
- Chance of severe wind over 30 yrs
- —
Air-quality risk 2/10 · Minimal
- Unhealthy air days now
- 1 days/yr
- Unhealthy air days in 30 yrs
- 3 days/yr
Risk factors via First Street. Map © Google.
Why this score? — see what drove the C- grade
The composite is a weighted blend of 9 inputs, each scored 0–100. Each bar is that input's sub-score; the figure is the points it added to the 100-point composite (weight × sub-score).
- Cash flow +27.4/30.0
- DSCR +9.6/10.0
- 1% rule +7.3/10.0
- Livability +3.7/5.0
- Rent growth +2.5/5.0
- Condition / age +2.5/5.0
- Schools +1.1/10.0
- ARV discount +0.0/15.0
- Appreciation +0.0/10.0
$80,000
🖨 Deal sheet 📄 Offer letter ✓ Due diligence
Listing remarks MLS
Step inside this beautifully renovated 3-bedroom 1 bathroom that's been fully redone from top to bottom! Every detail has been thoughtfully updated - from the modern kitchen with brand-new cabinetry, fresh flooring, roof, and fixtures throughout. The open layout creates a bright and inviting flow, perfect for everyday living and entertaining. Outside, enjoy a huge front and partially fenced in backyard offering plenty of space for gatherings, gardening, or relaxing outdoors. A 2-car detached garage adds convenience and extra storage. Move-in ready, stylish, and truly turn-key
Key facts
- Move-in ready
- Renovated
- Huge front yard
Tags
Property features AI
Finance
- Other: Property type: Residential single-family residence; Above-grade finished area approximately 950 square feet; No pool
- Financial info: Financial details not specified
- HOA & community: Subdivision: BEL-AIRE WOODS 2
Exterior
- Parking: Detached 2-car garage
- Security: No security features specified
- Utilities: Public water; Public sewer
- Home design: Single-family home; One level; Ground-level entry with steps; Brick and vinyl siding exterior
- Construction: Block foundation
- Exterior features: Paved road access; Lot dimensions approximately 55 x 110 (0.14 acres)
Interior
- Kitchen: Appliances and fixtures not specified
- Bedrooms: Bedrooms not specified
- Flooring: Flooring details not specified
- Bathrooms: One full bathroom
- Heating & cooling: Forced air heating; Natural gas heating; No central air conditioning
- Interior features: Unfinished basement; Five total rooms
- Laundry & utility: Laundry details not specified
Neighborhood map
What this means for you Summary
Snapshot
- This is a 3-bed/1.0-bath single-family listed at $80k.
Deal economics
- At list price, monthly cash flow is $234 ($3k/yr) — positive.
- The deal already cash-flows at list — no discount required.
- Meets the 1% rule at list price ($984 rent vs $80k).
Location & tenants
- Location reads 74/100 on livability (#196 in MI, #4,946 nationally) — a middle-class / working-renter tenant base. Strengths: commute A+, cost of living A+, housing A+; Watch: schools F, crime F, employment F.
- Flint School District (urban): math 7% / reading 13% proficiency, ranked #714 of 760 in MI (top 94%) — low school quality limits family demand, transient renter base, plan for 1-2y turnover; 83% free/reduced lunch — lower-income household profile, screen leases tightly.
- Market conditions: 131 active listings in the ZIP; 8 comparable units currently listed for rent nearby; rentals leasing fast (median 13d on market — plan ~1-2 weeks tenant-placement turnaround); 419 units permitted in Genesee County in 2024 (68 in 5+ unit buildings).
Forward outlook
- Local home prices are declining (-3.0%/yr); year-one equity from $553 of loan paydown is wiped out by about $2k of value loss. Plan a longer hold.
- Genesee County population projected at -27% by 2050 — secular population decline; favor cash flow + early exit over multi-decade hold.
- At projected returns (-3.0% appreciation + 3.0% rent growth), your $22k cash investment doubles in ~10 years — after that, you're playing with house money.
Negotiation context
- Only 11 days on market — expect competitive offers; lowballing is unlikely to land.
- 16 sale attempts since 29y ago with the ask held roughly flat each time — persistent listings suggest the price (not the market) is what's stuck; bring a comps-based counter.
- Current owner paid $24k; list at $80k implies a 233% gain — meaningful room to come down on a strong offer.
Risks & watch-outs
- Watch-outs: built in 1958 — expect roof / HVAC / electrical / plumbing capex.
Questions for the listing agent
- Built in 1958 — when were the roof, HVAC, electrical panel, plumbing, and water heater last replaced?
- Is there a deadline driving the sale (1031 exchange, divorce, estate, relocation)? That informs how much negotiation room exists.
- Schools are F-rated, which usually means shorter tenancies and higher turnover. Who's the typical renter profile here, and what's been the actual vacancy rate?
- Crime grade is F in this area — have there been break-ins, vandalism, or insurance claims at this property in the last 3 years? What carrier currently insures it and at what premium?
- What's the average days-on-market for RENTAL listings here right now (not sales)? A rising rental-DOM trend means longer vacancies and softer asking-rent achievability than the comps imply.
- What's the recent tenant-quality profile in this submarket — average credit score on applications, eviction rate, late-payment / NSF rate, and stable-employment percentage? A property-management company in the area should have these aggregated.
- How much new for-sale + rental construction is in the pipeline within 1–3 miles? Heavy new supply typically softens prices + rents 12–24 months out; constrained supply supports both.
Investment metrics
- 1% rule
- 1.23% ✓
- Cap rate
- 9.81%
- Cash-on-cash
- 12.56%
- DSCR
- 1.56
- GRM
- 6.8
CMA / ARV
- ARV (on-the-fly)
- $57,000
- Comps found
- 12
Show comp detail 12 sales within ~0.75 mi
| Address | Dist | Beds/Ba | Sqft | Sold | Price | $/sf | Match |
|---|---|---|---|---|---|---|---|
| 1323 Chatham Dr | 0.27mi | 3/1.5 | 1,374 (-4%) | 2mo | $51,000 | $37 | 78 |
| 5705 Winthrop Blvd | 0.41mi | 3/1.0 | 1,375 (-4%) | 4mo | $55,000 | $40 | 72 |
| 5714 Suburban Ct | 0.69mi | 3/1.0 | 1,426 (+0%) | 3mo | $63,500 | $45 | 65 |
| 6610 Cranwood Dr | 0.62mi | 3/2.0 | 1,452 (+2%) | 5mo | $78,000 | $54 | 60 |
| 605 W Foss Ave | 0.73mi | 3/1.0 | 1,387 (-3%) | 2mo | $6,900 | $5 | 60 |
| 5913 Glenn Ave | 0.41mi | 3/1.5 | 1,272 (-11%) | 4mo | $35,000 | $28 | 57 |
| 5302 Susan St | 0.52mi | 2/1.0 (-1) | 1,508 (+6%) | 6mo | $53,000 | $35 | 56 |
| 4911 Birchcrest Dr | 0.68mi | 3/2.0 | 1,310 (-8%) | 0mo | $30,000 | $23 | 51 |
| 618 W Austin Ave | 0.67mi | 4/1.5 (+1) | 1,500 (+5%) | 3mo | $85,900 | $57 | 50 |
| 6714 Cranwood Dr | 0.65mi | 3/1.5 | 1,562 (+10%) | 2mo | $87,000 | $56 | 50 |
| 3145 Gracelawn Ave | 0.69mi | 3/2.0 | 1,300 (-9%) | 0mo | $135,500 | $104 | 49 |
| 5416 Dupont St | 0.68mi | 3/2.0 | 1,597 (+12%) | 2mo | $38,000 | $24 | 43 |
Match score weights: distance 35% · size 25% · config 20% · recency 20%. Top-matched comps best support the ARV.
Projected returns pro-forma
-3.0% appreciation · 3.0% rent growth · sell at horizon
- IRR
- 2.3%
- Equity multiple
- 1.09×
- Total profit
- $1,977
- Equity at exit
- $11,928
- IRR
- 11.9%
- Equity multiple
- 1.94×
- Total profit
- $20,984
- Equity at exit
- $6,917
Cash invested: $22,400 (down + closing). Projections, not guarantees.
Landlord ↔ Tenant lean methodology
- Overall (STATE)
- 62 Landlord-Friendly
- State Michigan
- 62 Landlord-Friendly · EVEN
- County
- — inherits STATE
- City
- — inherits STATE
ZIP-level market 48504
- Active inventory
- 131
- Price-to-rent
- 6.8×
Monthly cashflow live
- Estimated rent
- $984 high interval (Pro) →
- Mortgage (P&I)
- −$420
- Tax from tax record
- −$90 /mo · $1,078/yr
- Insurance
- −$33
- HOA
- −$0
- Vacancy / Maint / Mgmt
- −$207
- Net cashflow
- $234
Break-even live
UW: 25.0% down · 7.5% · 30yr · 1.5% tax · 5.0% vac · 8.0% maint · 8.0% mgmt
Financing live
Cash to close
- Down payment
- $20,000
- Closing costs
- $2,400
- Reserves months
- —
- Total cash needed
- —
Loan-product check · same deal, 3 products live
Conventional
25% down · 7.5% · 30yr
- Down + closing
- —
- Monthly P&I
- —
- Monthly cashflow
- —
- DSCR
- —
- Eligible?
- —
Personal DTI + credit; lowest rate.
DSCR
20% down · 8.5% · 30yr
- Down + closing
- —
- Monthly P&I
- —
- Monthly cashflow
- —
- DSCR
- —
- Eligible?
- —
No personal income docs; deal must DSCR.
Hard money
10% down · 12.0% · 12mo
- Down + closing
- —
- Monthly P&I
- —
- Monthly cashflow
- —
- DSCR
- —
- Eligible?
- —
Short-term bridge; refi at stabilization.
Rent comps 8 comps
| Address | Beds | Baths | Sqft | Rent | $/sqft | DOM | Units | Dist |
|---|---|---|---|---|---|---|---|---|
| 5905 Griggs Dr Flint, MI | 3.0 | 1.0 | 940 | $1,000 | $1.06 | 13d | 1 | 0.12mi |
| 5813 Edwards Ave Flint, MI | 3.0 | 1.0 | 1500 | $899 | $0.60 | 13d | 1 | 0.55mi |
| 5413 DuPont St Flint, MI | 4.0 | 1.5 | 1038 | $900 | $0.87 | 20d | 1 | 0.68mi |
| 6802 DuPont St Flint, MI | 3.0 | 1.0 | 1200 | $1,000 | $0.83 | 20d | 1 | 0.72mi |
| 514 W Alma Ave Flint, MI | 3.0 | 1.0 | 894 | $925 | $1.03 | 13d | 1 | 0.85mi |
| 100 Rosewood Mnr Flint, MI | 2.0 | 1.5 | 1159 | $947 | $0.82 | 13d | 1 | 1.01mi |
| 411 W Marengo Ave Flint, MI | 3.0 | 1.0 | 1350 | $1,072 | $0.79 | 13d | 1 | 1.05mi |
| 5280 Cedar Shores Ct Flint, MI | 2.0–3.0 | 2.0 | 1150 | $1,148 | $1.00 | 13d | 6 | 1.09mi |
Listing history 43 events
-
2026-06-09status $80,000 Pending 11 DOM
-
2026-06-08days on market $80,000 Active 11 DOM
-
2026-06-07days on market $80,000 Active 10 DOM
-
2026-06-05days on market $80,000 Active 7 DOM
-
2026-06-03days on market $80,000 Active 6 DOM
-
2026-06-02days on market $80,000 Active 5 DOM
-
2026-06-01days on market $80,000 Active 4 DOM
-
2026-05-31days on market $80,000 Active 3 DOM
-
2026-05-30days on market $80,000 Active 2 DOM
-
2026-05-28$80,000 Active
Show marketing remark (584 chars)
Step inside this beautifully renovated 3-bedroom 1 bathroom that's been fully redone from top to bottom! Every detail has been thoughtfully updated - from the modern kitchen with brand-new cabinetry, fresh flooring, roof, and fixtures throughout. The open layout creates a bright and inviting flow, perfect for everyday living and entertaining. Outside, enjoy a huge front and partially fenced in backyard offering plenty of space for gatherings, gardening, or relaxing outdoors. A 2-car detached garage adds convenience and extra storage. Move-in ready, stylish, and truly turn-key
-
2026-05-28$80,000 Active 584-char remark
Show marketing remark (584 chars)
Step inside this beautifully renovated 3-bedroom 1 bathroom that's been fully redone from top to bottom! Every detail has been thoughtfully updated - from the modern kitchen with brand-new cabinetry, fresh flooring, roof, and fixtures throughout. The open layout creates a bright and inviting flow, perfect for everyday living and entertaining. Outside, enjoy a huge front and partially fenced in backyard offering plenty of space for gatherings, gardening, or relaxing outdoors. A 2-car detached garage adds convenience and extra storage. Move-in ready, stylish, and truly turn-key
-
2021-02-17soldstatus $24,000 Sold 163-char remark
Show marketing remark (163 chars)
Great rental investment opportunity. Tenant occupied. Please do not disturb the tenants. Offered as part of a package deal with 5405 Fleming Rd and 5417 Fleming Rd
-
2021-02-10status Pending
Show marketing remark (163 chars)
Great rental investment opportunity. Tenant occupied. Please do not disturb the tenants. Offered as part of a package deal with 5405 Fleming Rd and 5417 Fleming Rd
-
2021-02-10status Pending 163-char remark
Show marketing remark (163 chars)
Great rental investment opportunity. Tenant occupied. Please do not disturb the tenants. Offered as part of a package deal with 5405 Fleming Rd and 5417 Fleming Rd
-
2021-02-03status Active
Show marketing remark (163 chars)
Great rental investment opportunity. Tenant occupied. Please do not disturb the tenants. Offered as part of a package deal with 5405 Fleming Rd and 5417 Fleming Rd
-
2021-02-03status Active 163-char remark
Show marketing remark (163 chars)
Great rental investment opportunity. Tenant occupied. Please do not disturb the tenants. Offered as part of a package deal with 5405 Fleming Rd and 5417 Fleming Rd
-
2021-02-02status Pending
Show marketing remark (163 chars)
Great rental investment opportunity. Tenant occupied. Please do not disturb the tenants. Offered as part of a package deal with 5405 Fleming Rd and 5417 Fleming Rd
-
2021-02-02status Pending 163-char remark
Show marketing remark (163 chars)
Great rental investment opportunity. Tenant occupied. Please do not disturb the tenants. Offered as part of a package deal with 5405 Fleming Rd and 5417 Fleming Rd
-
2021-01-25$32,000 Active 163-char remark
Show marketing remark (163 chars)
Great rental investment opportunity. Tenant occupied. Please do not disturb the tenants. Offered as part of a package deal with 5405 Fleming Rd and 5417 Fleming Rd
-
2021-01-25$32,000 Active
Show marketing remark (163 chars)
Great rental investment opportunity. Tenant occupied. Please do not disturb the tenants. Offered as part of a package deal with 5405 Fleming Rd and 5417 Fleming Rd
-
2014-01-25historical
-
2014-01-24historical
-
2013-10-28$19,900
-
2013-10-28$19,900
-
2010-12-06historical
-
2007-10-12soldstatus $14,900
-
2007-10-12soldstatus $14,900
-
2007-10-05historical
-
2007-08-15$14,900
-
2007-08-15$14,900
-
2000-06-07soldstatus $46,500
-
2000-06-07soldstatus $46,500
-
2000-03-15historical
-
2000-03-10$36,000
-
2000-03-10$36,000
-
1998-05-05soldstatus $52,500
-
1998-05-05soldstatus $52,500
-
1998-02-25historical
-
1998-02-17$52,500
-
1998-02-17$52,500
-
1997-10-22$57,000
-
1997-10-22$57,000
-
1997-10-22historical
ⓘ Source: listings_history table (triggers on properties + properties_extension) + one-shot
backfill from property_details.listing_events for pre-trigger history.
Tax reassessment forecast MI · Partial reset (capped growth)
- Current annual tax
- $1,078 · $90/mo
- Projected year-2 tax
- $1,155 · $96/mo
- Expected delta
- +$77/yr (+$6/mo · 7.1%)
ⓘ Screening estimate from a state-policy table — verify with the county assessor before closing.
Climate risk First Street
- Flood 1/10 Low FEMA zone X (unshaded) · 0% chance over 30 yrs
- Wildfire 1/10 Low
- Heat 2/10 Low 7 d/yr ≥96°F today · 15 d/yr by 30 yrs out
- Wind 2/10 Low
- Air quality 2/10 Low 1 unhealthy d/yr today · 3 by 30 yrs out
Nearby sold comps map
Loading sold comps map…
Walkable amenities ~0.75 mi
Loading nearby amenities…
Taxation est. · year 1
- Rental income
- $11,805
- − Mortgage interest
- −$4,481
- − Property taxes
- −$1,078
- − Insurance
- −$400
- − Repairs & maintenance
- −$944
- − Management
- −$944
- − Depreciation
- −$2,327
- Taxable income
- $1,629
- Est. tax owed @ 24.0%
- −$391
- After-tax cash flow
- $2,422/yr
For passive investors: Depreciation is non-cash, so a rental often shows a tax loss while cash-flowing — sheltering income. Rental losses are passive: they offset passive income freely, and up to $25,000/yr can offset ordinary (W-2) income if you actively participate and your MAGI is under $100k (phasing out to $0 by $150k); unused losses carry forward. On sale, claimed depreciation is recaptured at up to 25%, and gains may owe capital-gains tax (a 1031 exchange can defer both). Figures are a year-1 estimate at your 24.0% rate — not tax advice; consult a CPA.
Schools (NCES district)
- District
- Flint School District
- NCES district ID
- 2614520
- Math proficiency
- 7% ▬ 0.00%
- Reading proficiency
- 13% ▲ 3.00%
- Median HH income
- $25,954
- Composite
- 10.97/100
- National rank
- #14642
- State rank
- #714 of 760 in MI
Livability — Flint
- Score
- 74/100
- State rank
- #196
- US rank
- #4946
Category grades
Schools grade is shown separately in the Schools card above.
Census & demographics
- Census place
- Flint, MI
- City population
- 93,814
- Population (ZIP)
- 23,873
Population outlook (Genesee County) Hauer SSP2
- Today (2025)
- 381,312 people
- By 2030
- 362,731 · -4.9%
- By 2040
- 321,550 · -15.7%
- By 2050
- 279,212 · -26.8%
- By 2075
- 193,336 · -49.3%
- By 2100
- 128,118 · -66.4%
Race, ethnicity, and origin ACS 2023
- Neighborhood character
- Predominantly Black (66%)
- Race & ethnicity
- Black 66% White 24% Two or more races 6% Hispanic / Latino 5% Asian 1%
- Common ancestry
- Romanian 2% Lithuanian 1% Italian 1%
- Foreign-born
- 3% · Canada, China
- Languages at home
- 96% English-only · Spanish 2%
Political lean MEDSL · Genesee
- 2024 margin
- Toss-up / Even · D 51.4% · R 47.2% · Other 1.4%
- 2008→2024 swing
- -28.3pp toward R · 2008: 32.5pp · 2024: 4.2pp
- All cycles
- 2024: D+4.2 2020: D+9.3 2016: D+9.5 2012: D+28.2 2008: D+32.5
Not yet ingested
- Civics
- —
Market trends
- HPI YoY
- ▼ -101.67%
- Current HPI
- 94.3111
- Rent YoY
- —
- Metro
- —
- State GDP YoY
- ▲ 1.37%
- F500 in state
- 28
Industry mix (Fortune 500 HQ in MI)
| Industry | F500 HQs | Revenue |
|---|---|---|
| Automotive Parts | 3 | $48B |
|
||
| Automotive | 2 | $372B |
|
||
| Chemicals | 1 | $45B |
|
||
| Automotive Retail | 1 | $29B |
|
||
| Healthcare / Medical Devices | 1 | $23B |
|
||
| Automotive Technology | 1 | $20B |
|
||
Price history
+40.4% since first listed34 events — show timeline
- 2026-05-28 Listed $80,000 MiRealSource-MiMLS
- 2026-05-28 Listed $80,000 REALCOMP
- 2021-02-17 Sold (MLS) $24,000 REALCOMP
- 2021-02-10 Pending — MiRealSource-MiMLS
- 2021-02-10 Pending — REALCOMP
- 2021-02-03 Relisted — MiRealSource-MiMLS
- 2021-02-03 Relisted — REALCOMP
- 2021-02-02 Pending — MiRealSource-MiMLS
- 2021-02-02 Pending — REALCOMP
- 2021-01-25 Listed $32,000 MiRealSource-MiMLS
- 2021-01-25 Listed $32,000 REALCOMP
- 2014-01-25 Listing Removed — REALCOMP
- 2014-01-24 Listing Removed — MiRealSource-MiMLS
- 2013-10-28 Listed $19,900 MiRealSource-MiMLS
- 2013-10-28 Listed $19,900 REALCOMP
- 2010-12-06 Listing Removed — REALCOMP
- 2007-10-12 Sold (MLS) $14,900 REALCOMP
- 2007-10-12 Sold (MLS) $14,900 MiRealSource-MiMLS
- 2007-10-05 Listing Removed — MiRealSource-MiMLS
- 2007-08-15 Listed $14,900 REALCOMP
- 2007-08-15 Listed $14,900 MiRealSource-MiMLS
- 2000-06-07 Sold (MLS) $46,500 MiRealSource-MiMLS
- 2000-06-07 Sold (MLS) $46,500 REALCOMP
- 2000-03-15 Listing Removed — MiRealSource-MiMLS
- 2000-03-10 Listed $36,000 MiRealSource-MiMLS
- 2000-03-10 Listed $36,000 REALCOMP
- 1998-05-05 Sold (MLS) $52,500 MiRealSource-MiMLS
- 1998-05-05 Sold (MLS) $52,500 REALCOMP
- 1998-02-25 Listing Removed — MiRealSource-MiMLS
- 1998-02-17 Listed $52,500 MiRealSource-MiMLS
- 1998-02-17 Listed $52,500 REALCOMP
- 1997-10-22 Listing Removed — MiRealSource-MiMLS
- 1997-10-22 Listed $57,000 MiRealSource-MiMLS
- 1997-10-22 Listed $57,000 REALCOMP
Property tax history
+8.9%/yrLatest (2025): $1,078 · +1.7% YoY. Source: county tax records.
Cash-flow waterfall
monthlySold comps — $/sqft
last 12 mo · ≤1 miLoading sold comps…