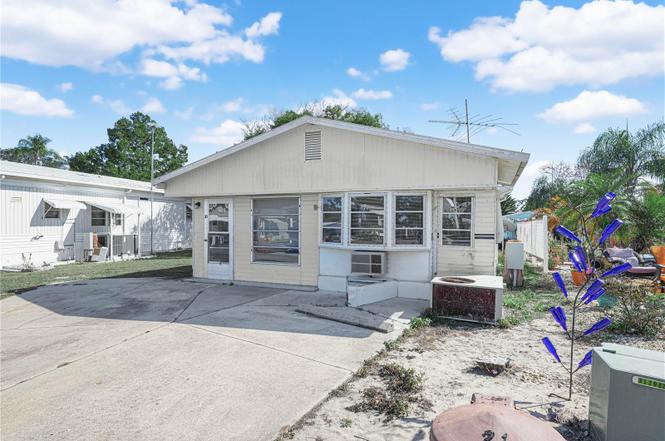
31 Stonefly Cir · Lake Wales, FL
Flood risk 1/10 · Minimal
- FEMA flood zone
- X (unshaded)
- Chance of flooding over 30 yrs
- 0.0%
- Est. flood insurance / yr
- $507 – $1,088
Fire risk 6/10 · Moderate
- Est. fire insurance / yr
- $947 – $1,759
Heat risk 8/10 · Major
- Hot days now (above 108°F)
- 7 days/yr
- Hot days in 30 yrs
- 23 days/yr
Wind risk 10/10 · Severe
- Chance of severe wind over 30 yrs
- 99.0%
Air-quality risk 2/10 · Minimal
- Unhealthy air days now
- 0 days/yr
- Unhealthy air days in 30 yrs
- 1 days/yr
Risk factors via First Street. Map © Google.
Why this score? — see what drove the B- grade
The composite is a weighted blend of 9 inputs, each scored 0–100. Each bar is that input's sub-score; the figure is the points it added to the 100-point composite (weight × sub-score).
- Cash flow +30.0/30.0
- 1% rule +10.0/10.0
- DSCR +10.0/10.0
- ARV discount +7.5/15.0
- Schools +3.5/10.0
- Livability +3.4/5.0
- Rent growth +2.5/5.0
- Condition / age +2.5/5.0
- Appreciation +0.0/10.0
$63,000
🖨 Deal sheet 📄 Offer letter ✓ Due diligence
Listing remarks
This furnished 1/1 home is located in the 55+ gated community of Saddlebag Lake Resort, where you own the land. The spacious living room welcomes you as you enter the front door. Upstairs you'll find a cozy kitchen and dining area, with a pass-through bathroom that leads to the comfortable owners suite. There's a vinyl room at the back of the home, which also houses the washer and dryer for your convenience. The shed has shelving, an easy place to store your gear and all your tools. Enjoy all the resort has to offer, including a heated pool, tennis and pickle ball courts, horse shoe pits, a screen enclosed hot tub, professional grade shuffleboard courts, a rec room with pool tables and saun
Key facts
- Gated community
- Shuffleboard courts
- Pickle ball courts
Tags
Property features AI
Finance
- Other: Furnished; Total living area listed as 616 sq ft (public records)
- Financial info: Lease restrictions apply
- HOA & community: HOA required; monthly fee approximately $226.67 (quarterly fee shown as $680); HOA covers water, sewer, and trash; Association amenities include clubhouse, fitness center, pool, spa/hot tub, sauna, tennis courts, pickleball courts, shuffleboard, recreation facilities, and security; Senior community; Pets allowed (cats and dogs); Dog park; Golf carts permitted
Exterior
- Parking: Parking available (details not specified)
- Security: Gated community
- Utilities: Electricity connected; Sewer connected; Water connected
- Home design: Manufactured home (single wide); Two levels; Northwest facing
- Construction: Vinyl siding; Metal roof; Crawlspace and slab foundation; Estimated building area: 156 sq ft
- Exterior features: Asphalt road access; 0.1-acre lot; Private water source; Private sewer
Interior
- Kitchen: Range; Refrigerator
- Bedrooms: 1 bedroom
- Flooring: Carpet; Ceramic tile; Laminate
- Bathrooms: 1 full bathroom
- Heating & cooling: Ductless heating; Wall/window cooling unit(s)
- Interior features: Ceiling fans
- Laundry & utility: Washer; Dryer; Laundry inside
Neighborhood map
What this means for you Summary
Snapshot
- This is a 1-bed/1.0-bath manufactured listed at $63k.
Deal economics
- At list price, monthly cash flow is $251 ($3k/yr) — positive.
- The deal already cash-flows at list — no discount required.
- Meets the 1% rule at list price ($1k rent vs $63k).
- Recommended offer: $55k (12.0% below list) — sets the bar for market timing.
Location & tenants
- Location reads 68/100 on livability (#535 in FL) — a middle-class / working-renter tenant base. Strengths: cost of living A+, housing A+; Watch: employment D+, schools D, amenities F.
- Polk (suburban): math 39% / reading 43% proficiency, ranked #62 of 73 in FL (top 85%) — families likely to look elsewhere, expect single-tenant / working-renter base with shorter leases.
- Market conditions: 500 active listings in the ZIP; 10,384 units permitted in Polk County in 2024 (1,716 in 5+ unit buildings).
Forward outlook
- Local home prices are declining (-3.0%/yr); year-one equity from $436 of loan paydown is wiped out by about $2k of value loss. Plan a longer hold.
- Polk County population projected at +33% by 2050 — long-run rental-demand tailwind backs the buy-and-hold thesis.
- At projected returns (-3.0% appreciation + 3.0% rent growth), your $18k cash investment doubles in ~7 years — after that, you're playing with house money.
Negotiation context
- It's been on market 133 days — a 12% lower offer ($55k) is reasonable based on typical stale-listing flexibility.
- Current owner paid $20k; list at $63k implies a 215% gain — meaningful room to come down on a strong offer.
Risks & watch-outs
- Watch-outs: HOA is 21% of rent.
- Climate carrying-cost: severe wind risk, 99% chance of damaging wind over 30y; major wildfire risk; extreme-heat days projected 7→23/yr by 2055 (HVAC capex compounding) — expect insurance premiums to compound above CPI over the hold.
Questions for the listing agent
- It's been on market 133 days. Have you received any prior offers? Is the seller open to a 12% concession, seller financing, or rate buy-down credit?
- What does the HOA fee cover, when was the last increase, and are there any pending special assessments or reserve-fund shortfalls?
- Why hasn't it sold? Are there any deal-killer items the seller is aware of (foundation, flood, title, zoning, code violations)?
- Is there a deadline driving the sale (1031 exchange, divorce, estate, relocation)? That informs how much negotiation room exists.
- Schools are D-rated, which usually means shorter tenancies and higher turnover. Who's the typical renter profile here, and what's been the actual vacancy rate?
- What's the average days-on-market for RENTAL listings here right now (not sales)? A rising rental-DOM trend means longer vacancies and softer asking-rent achievability than the comps imply.
- What's the recent tenant-quality profile in this submarket — average credit score on applications, eviction rate, late-payment / NSF rate, and stable-employment percentage? A property-management company in the area should have these aggregated.
- How much new for-sale + rental construction is in the pipeline within 1–3 miles? Heavy new supply typically softens prices + rents 12–24 months out; constrained supply supports both.
Investment metrics
- 1% rule
- 1.75% ✓
- Cap rate
- 11.07%
- Cash-on-cash
- 17.06%
- DSCR
- 1.76
- GRM
- 4.8
CMA / ARV
No comps found within radius.
Projected returns pro-forma
-3.0% appreciation · 3.0% rent growth · sell at horizon
- IRR
- 8.5%
- Equity multiple
- 1.33×
- Total profit
- $5,891
- Equity at exit
- $9,394
- IRR
- 17.8%
- Equity multiple
- 2.49×
- Total profit
- $26,220
- Equity at exit
- $5,447
Cash invested: $17,640 (down + closing). Projections, not guarantees.
Landlord ↔ Tenant lean methodology
- Overall (STATE)
- 87 Strongly Landlord-Friendly
- State Florida
- 87 Strongly Landlord-Friendly · R+3
- County
- — inherits STATE
- City
- — inherits STATE
ZIP-level market 33898
- Home prices YoY
- -15.1%
- Active inventory
- 500
- Price-to-rent
- 4.8×
Monthly cashflow live
- Estimated rent
- $1,102 medium interval (Pro) →
- Mortgage (P&I)
- −$330
- Tax from tax record
- −$37 /mo · $444/yr
- Insurance
- −$26
- HOA
- −$226
- Vacancy / Maint / Mgmt
- −$231
- Net cashflow
- $251
Break-even live
UW: 25.0% down · 7.5% · 30yr · 1.5% tax · 5.0% vac · 8.0% maint · 8.0% mgmt
Financing live
Cash to close
- Down payment
- $15,750
- Closing costs
- $1,890
- Reserves months
- —
- Total cash needed
- —
Loan-product check · same deal, 3 products live
Conventional
25% down · 7.5% · 30yr
- Down + closing
- —
- Monthly P&I
- —
- Monthly cashflow
- —
- DSCR
- —
- Eligible?
- —
Personal DTI + credit; lowest rate.
DSCR
20% down · 8.5% · 30yr
- Down + closing
- —
- Monthly P&I
- —
- Monthly cashflow
- —
- DSCR
- —
- Eligible?
- —
No personal income docs; deal must DSCR.
Hard money
10% down · 12.0% · 12mo
- Down + closing
- —
- Monthly P&I
- —
- Monthly cashflow
- —
- DSCR
- —
- Eligible?
- —
Short-term bridge; refi at stabilization.
HOA detail
- Monthly dues
- $226 · $2,712/yr
- Likely covers
- poolsecurity
Listing history 16 events
-
2026-06-18days on market $63,000 Active 133 DOM
-
2026-06-17days on market $63,000 Active 132 DOM
-
2026-06-16days on market $63,000 Active 131 DOM
-
2026-06-15days on market $63,000 Active 130 DOM
-
2026-06-13days on market $63,000 Active 128 DOM
-
2026-06-10days on market $63,000 Active 125 DOM
-
2026-06-09days on market $63,000 Active 124 DOM
-
2026-06-08days on market $63,000 Active 123 DOM
-
2026-06-07days on market $63,000 Active 122 DOM
-
2026-06-05days on market $63,000 Active 119 DOM
-
2026-06-03days on market $63,000 Active 117 DOM
-
2026-06-01days on market $63,000 Active 116 DOM
-
2026-05-31days on market $63,000 Active 115 DOM
-
2026-05-15price $63,000
-
2026-02-05$68,000 Active
-
1998-04-02soldstatus $20,000
ⓘ Source: listings_history table (triggers on properties + properties_extension) + one-shot
backfill from property_details.listing_events for pre-trigger history.
Tax reassessment forecast FL · Resets to sale price
- Current annual tax
- $444 · $37/mo
- Projected year-2 tax
- $523 · $44/mo
- Expected delta
- +$79/yr (+$7/mo · 17.7%)
ⓘ Screening estimate from a state-policy table — verify with the county assessor before closing.
Climate risk First Street
- Flood 1/10 Low FEMA zone X (unshaded) · 0% chance over 30 yrs
- Wildfire 6/10 Major
- Heat 8/10 Severe 7 d/yr ≥108°F today · 23 d/yr by 30 yrs out
- Wind 10/10 Extreme 99% chance of damaging wind over 30 yrs
- Air quality 2/10 Low 0 unhealthy d/yr today · 1 by 30 yrs out
Nearby sold comps map
Loading sold comps map…
Walkable amenities ~0.75 mi
Loading nearby amenities…
Taxation est. · year 1
- Rental income
- $13,221
- − Mortgage interest
- −$3,529
- − Property taxes
- −$444
- − Insurance
- −$315
- − Repairs & maintenance
- −$1,058
- − Management
- −$1,058
- − HOA
- −$2,712
- − Depreciation
- −$1,833
- Taxable income
- $2,273
- Est. tax owed @ 24.0%
- −$545
- After-tax cash flow
- $2,463/yr
For passive investors: Depreciation is non-cash, so a rental often shows a tax loss while cash-flowing — sheltering income. Rental losses are passive: they offset passive income freely, and up to $25,000/yr can offset ordinary (W-2) income if you actively participate and your MAGI is under $100k (phasing out to $0 by $150k); unused losses carry forward. On sale, claimed depreciation is recaptured at up to 25%, and gains may owe capital-gains tax (a 1031 exchange can defer both). Figures are a year-1 estimate at your 24.0% rate — not tax advice; consult a CPA.
Schools (NCES district)
- District
- Polk
- NCES district ID
- 1201590
- Math proficiency
- 39% ▼ -11.00%
- Reading proficiency
- 43% ▼ -4.00%
- Median HH income
- $43,979
- Composite
- 34.74/100
- National rank
- #5132
- State rank
- #62 of 73 in FL
Livability — Lake Wales
- Score
- 68/100
- State rank
- #535
- US rank
- #10036
Category grades
Schools grade is shown separately in the Schools card above.
Census & demographics
- County
- Polk County · 740,051 people
- City population
- 30,351
- Metro
- Lakeland-Winter Haven, FL
- Population (ZIP)
- 18,527
- Household income
- $57,224
- Rent vs Own
- Severe rent burden
- 148.0
Population outlook (Polk County) Hauer SSP2
- Today (2025)
- 752,975 people
- By 2030
- 804,621 · +6.9%
- By 2040
- 906,117 · +20.3%
- By 2050
- 1,000,476 · +32.9%
- By 2075
- 1,197,520 · +59.0%
- By 2100
- 1,271,518 · +68.9%
Race, ethnicity, and origin ACS 2023
- Neighborhood character
- Predominantly White (74%)
- Race & ethnicity
- White 74% Hispanic / Latino 17% Two or more races 10% Black 6%
- Hispanic origin (detail)
- Mexican 6% Puerto Rican 4% Cuban 3%
- Common ancestry
- Slovak 3% Lithuanian 2% Italian 2%
- Foreign-born
- 9% · Canada
- Languages at home
- 81% English-only · Spanish 17% French/Haitian/Cajun 1% Other Indo-European 1%
Political lean MEDSL · Polk
- 2024 margin
- Strong R (+20.7) · D 39.2% · R 59.9%
- 2008→2024 swing
- -14.6pp toward R · 2008: -6.1pp · 2024: -20.7pp
- All cycles
- 2024: R+20.7 2020: R+14.4 2016: R+14.1 2012: R+6.8 2008: R+6.1
Not yet ingested
- Civics
- —
Market trends
- HPI YoY
- ▼ -60.62%
- Current HPI
- 340.6056
- Rent YoY
- —
- Metro
- Lakeland-Winter Haven, FL
- State GDP YoY
- ▲ 3.28%
- F500 in state
- 36
Industry mix (Fortune 500 HQ in FL)
| Industry | F500 HQs | Revenue |
|---|---|---|
| Industrial Technology | 2 | $29B |
|
||
| Insurance | 2 | $17B |
|
||
| Retail | 1 | $60B |
|
||
| Technology Distribution | 1 | $58B |
|
||
| Homebuilding | 1 | $35B |
|
||
| Technology Manufacturing | 1 | $35B |
|
||
Price history
+215.0% since first listed3 events — show timeline
- 2026-05-15 Price Changed $63,000 Stellar MLS as Distributed by MLS Grid
- 2026-02-05 Listed $68,000 Stellar MLS as Distributed by MLS Grid
- 1998-04-02 Sold (Public Records) $20,000 Public Records
Property tax history
+8.4%/yrLatest (2025): $444 · +39.3% YoY. Source: county tax records.
Cash-flow waterfall
monthlySold comps — $/sqft
last 12 mo · ≤1 miLoading sold comps…