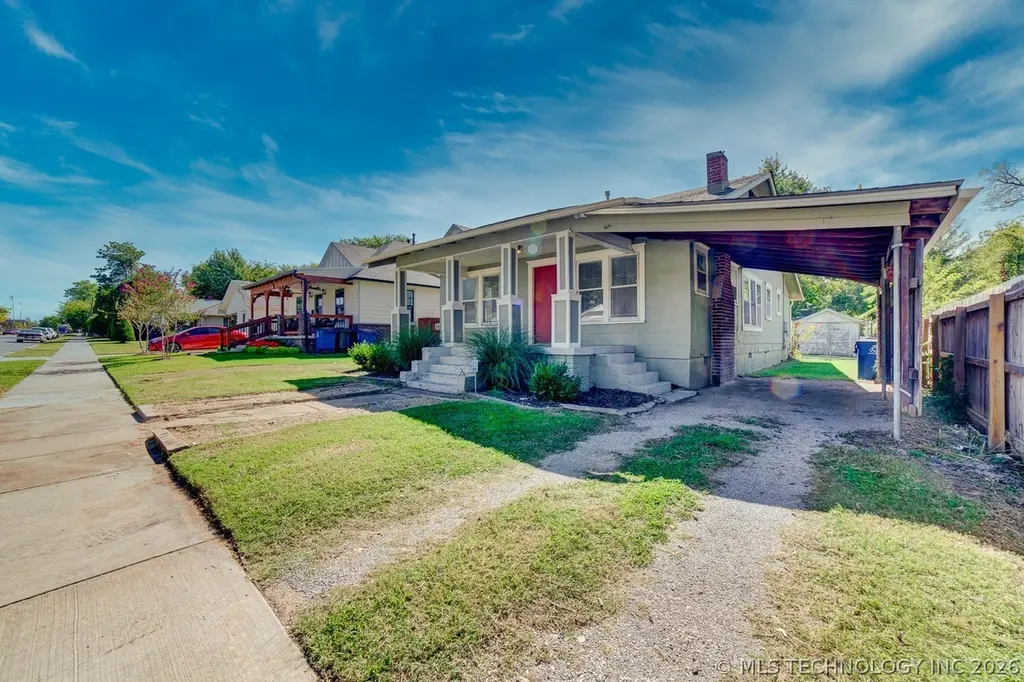
2520 E 7th St · Tulsa, OK
Flood risk 1/10 · Minimal
- FEMA flood zone
- X (unshaded)
- Chance of flooding over 30 yrs
- 0.0%
- Est. flood insurance / yr
- $507 – $1,088
Fire risk 1/10 · Minimal
- Est. fire insurance / yr
- $2,463 – $4,575
Heat risk 6/10 · Moderate
- Hot days now (above 110°F)
- 7 days/yr
- Hot days in 30 yrs
- 18 days/yr
Wind risk 2/10 · Minimal
- Chance of severe wind over 30 yrs
- 4.0%
Air-quality risk 2/10 · Minimal
- Unhealthy air days now
- 2 days/yr
- Unhealthy air days in 30 yrs
- 2 days/yr
Risk factors via First Street. Map © Google.
Why this score? — see what drove the C- grade
The composite is a weighted blend of 9 inputs, each scored 0–100. Each bar is that input's sub-score; the figure is the points it added to the 100-point composite (weight × sub-score).
- Cash flow +20.1/30.0
- ARV discount +8.2/15.0
- DSCR +6.4/10.0
- 1% rule +4.4/10.0
- Rent growth +4.0/5.0
- Livability +3.8/5.0
- Condition / age +2.5/5.0
- Schools +0.8/10.0
- Appreciation +0.0/10.0
$175,000
🖨 Deal sheet (PDF) 📄 Offer letter ✓ Due diligence
Listing remarks
Charming Midtown Tulsa Craftsman Bungalow! Welcome to this well-maintained 3-bedroom, 1-bathroom home full of character and in the heart of Midtown Tulsa. From the inviting covered front porch to the timeless architectural details, this home perfectly blends historic charm with well-thought-out updates. Step inside to find gorgeous hardwood floors, abundant natural light, neutral tones, and a spacious living area. The updated kitchen features white shaker-style cabinetry, ample counter space, stainless steel appliances, and a charming breakfast nook with built-in bench seating. This home features generously sized bedrooms that offer beautiful hardwood flooring, large windows, and ceiling
Key facts
- Covered front porch
- Breakfast nook
- Updated kitchen
Tags
Property features AI
Exterior
- Parking: 1-car garage; Carport
- Security: No safety shelter
- Utilities: Public water; Public sewer; Electricity available; Natural gas available; Cable available
- Home design: Single-story; Faces north; Crawlspace foundation
- Construction: Brick, stucco and wood frame construction; Year built reported by owner
- Exterior features: Front porch; Shed(s); Partial fencing; No notable additional exterior features listed
Interior
- Kitchen: Built-in oven; Oven; Range; Stove; Dishwasher; Refrigerator
- Bedrooms: Three bedrooms on the first floor
- Flooring: Hardwood; Wood
- Bathrooms: One full bathroom
- Heating & cooling: Central heating (electric); Central air conditioning
- Interior features: Ceiling fan(s); Laminate counters; Wood counters; Vinyl and wood frame windows; Wood and hardwood flooring; Electric oven/range connection; Gas oven/range connection
- Laundry & utility: Washer; Dryer; Electric dryer hookup; Gas water heater
Neighborhood map
What this means for you Summary
Snapshot
- This is a 3-bed/1.0-bath single-family listed at $175k.
Deal economics
- At list price, monthly cash flow is $219 ($3k/yr) — positive.
- The deal already cash-flows at list — no discount required.
- To meet the 1% rule (rent ≥ 1% of price), the offer needs to be $165k (5.8% below list).
- Recommended offer: $165k (5.8% below list) — sets the bar for 1% rule.
- Cap rate 7.8% vs local median 3.8% in Tulsa — top-decile yield for the area; either an underpriced asset or a hidden risk that comps aren't pricing in. Stress-test before assuming the spread holds.
Location & tenants
- Location reads 75/100 on livability (#13 in OK, #4,058 nationally) — a middle-class / working-renter tenant base. Strengths: amenities A+, commute A+, cost of living A+; Watch: crime F, employment D-.
- Tulsa (urban): math 7% / reading 12% proficiency, ranked #250 of 270 in OK (top 93%) — low school quality limits family demand, transient renter base, plan for 1-2y turnover; 76% free/reduced lunch — lower-income household profile, screen leases tightly.
- Zoned schools: Kendall-Whittier Es (math 2% / reading 3%, grade F, #802 of 845 statewide, top 100%, 818 students, 0% FRL); Monroe Demonstration Ms (math 0% / reading 2%, grade F, #344 of 345 statewide, top 100%, 688 students, 0% FRL); Booker T. Washington Hs (math 41% / reading 61%, grade D+, #2 of 447 statewide, top 0%, 1,280 students, 0% FRL) — zoned schools average 0% FRL vs 76% district-wide (76 pts lower); this property's tenant base skews higher-income than the district average.
- Market conditions: Rents rising fast (+5.8%/yr); 86 active listings in the ZIP; 32 comparable units currently listed for rent nearby; rentals at typical pace (median 16d on market — plan ~3-4 weeks tenant-placement turnaround); 2,818 units permitted in Tulsa County in 2024 (518 in 5+ unit buildings).
- This rent runs 36% of the median local income ($55k/yr) — at the standard rent-burdened threshold; future hikes will face affordability resistance.
Forward outlook
- Local home prices are declining (-3.0%/yr); year-one equity from $1k of loan paydown is wiped out by about $5k of value loss. Plan a longer hold.
- Tulsa County population projected at +30% by 2050 — long-run rental-demand tailwind backs the buy-and-hold thesis.
Negotiation context
- Only 2 days on market — expect competitive offers; lowballing is unlikely to land.
- 2 sale attempts since 3y ago with the ask held roughly flat each time — persistent listings suggest the price (not the market) is what's stuck; bring a comps-based counter.
- Current owner paid $62k; list at $175k implies a 180% gain — meaningful room to come down on a strong offer.
Risks & watch-outs
- Watch-outs: built in 1930 — expect roof / HVAC / electrical / plumbing capex.
- Climate carrying-cost: extreme-heat days projected 7→18/yr by 2055 (HVAC capex compounding) — expect insurance premiums to compound above CPI over the hold.
Questions for the listing agent
- Built in 1930 — when were the roof, HVAC, electrical panel, plumbing, and water heater last replaced?
- Is there a deadline driving the sale (1031 exchange, divorce, estate, relocation)? That informs how much negotiation room exists.
- Schools are F-rated, which usually means shorter tenancies and higher turnover. Who's the typical renter profile here, and what's been the actual vacancy rate?
- Crime grade is F in this area — have there been break-ins, vandalism, or insurance claims at this property in the last 3 years? What carrier currently insures it and at what premium?
- What's the average days-on-market for RENTAL listings here right now (not sales)? A rising rental-DOM trend means longer vacancies and softer asking-rent achievability than the comps imply.
- What's the recent tenant-quality profile in this submarket — average credit score on applications, eviction rate, late-payment / NSF rate, and stable-employment percentage? A property-management company in the area should have these aggregated.
- How much new for-sale + rental construction is in the pipeline within 1–3 miles? Heavy new supply typically softens prices + rents 12–24 months out; constrained supply supports both.
Investment metrics
- 1% rule
- 0.94% ✗
- Cap rate
- 7.79%
- Cash-on-cash
- 5.36%
- DSCR
- 1.24
- GRM
- 8.8
CMA / ARV
- ARV (on-the-fly)
- $177,920
- Comps found
- 12
Show comp detail 12 sales within ~0.75 mi
| Address | Dist | Beds/Ba | Sqft | Sold | Price | $/sf | Match |
|---|---|---|---|---|---|---|---|
| 2516 E 3rd St | 0.39mi | 2/1.0 (-1) | 1,088 (-2%) | 3mo | $174,500 | $160 | 70 |
| 1325 S Delaware Ave | 0.61mi | 3/1.0 | 1,064 (-4%) | 0mo | $157,500 | $148 | 64 |
| 2215 E 8th St | 0.29mi | 2/1.0 (-1) | 1,000 (-10%) | 2mo | $200,000 | $200 | 64 |
| 3119 E 3rd St | 0.74mi | 3/1.0 | 1,126 (+1%) | 2mo | $175,000 | $155 | 61 |
| 2811 E 3rd St | 0.55mi | 3/2.5 | 1,057 (-5%) | 3mo | $229,900 | $218 | 58 |
| 407 S Xanthus Ave | 0.54mi | 3/1.5 | 975 (-12%) | 0mo | $60,000 | $62 | 52 |
| 2604 E 2nd St | 0.47mi | 2/1.0 (-1) | 977 (-12%) | 1mo | $181,300 | $186 | 52 |
| 232 S Florence Ave | 0.69mi | 3/2.0 | 1,211 (+9%) | 2mo | $174,000 | $144 | 48 |
| 1739 E 8th St | 0.57mi | 3/2.0 | 1,248 (+12%) | 2mo | $110,000 | $88 | 47 |
| 1423 S Delaware Ave | 0.71mi | 2/1.0 (-1) | 1,205 (+8%) | 3mo | $242,000 | $201 | 45 |
| 2735 E 1st St | 0.64mi | 2/1.0 (-1) | 988 (-11%) | 3mo | $165,000 | $167 | 44 |
| 1737 E 8th St | 0.58mi | 2/2.0 (-1) | 1,245 (+12%) | 2mo | $100,000 | $80 | 42 |
Match score weights: distance 35% · size 25% · config 20% · recency 20%. Top-matched comps best support the ARV.
Projected returns pro-forma
-3.0% appreciation · 5.8% rent growth · sell at horizon
- IRR
- -5.2%
- Equity multiple
- 0.80×
- Total profit
- $-9,683
- Equity at exit
- $26,093
- IRR
- 7.3%
- Equity multiple
- 1.61×
- Total profit
- $30,081
- Equity at exit
- $15,131
Cash invested: $49,000 (down + closing). Projections, not guarantees.
Landlord ↔ Tenant lean methodology
- Overall (STATE)
- 83 Strongly Landlord-Friendly
- State Oklahoma
- 83 Strongly Landlord-Friendly · R+20
- County
- — inherits STATE
- City
- — inherits STATE
ZIP-level market 74104
- Rents YoY
- 5.8%
- Active inventory
- 86
- Price-to-rent
- 8.8×
Monthly cashflow live
- Estimated rent
- $1,649 high interval (Pro) →
- Mortgage (P&I)
- −$918
- Tax from tax record
- −$93 /mo · $1,120/yr
- Insurance
- −$73
- HOA
- −$0
- Vacancy / Maint / Mgmt
- −$346
- Net cashflow
- $219
Break-even live
Sensitivity live
| Price | -10% $318 | -5% $269 | +0% $219 | +5% $170 | +10% $120 |
|---|---|---|---|---|---|
| Rent | -10% $89 | -5% $154 | +0% $219 | +5% $284 | +10% $349 |
| Rate | -1.0pp $307 | -0.5pp $264 | base $219 | +0.5pp $174 | +1.0pp $128 |
UW: 25.0% down · 7.5% · 30yr · 1.5% tax · 5.0% vac · 8.0% maint · 8.0% mgmt
Financing live
Cash to close
- Down payment
- $43,750
- Closing costs
- $5,250
- Reserves months
- —
- Total cash needed
- —
Loan-product check · same deal, 3 products live
Conventional
25% down · 7.5% · 30yr
- Down + closing
- —
- Monthly P&I
- —
- Monthly cashflow
- —
- DSCR
- —
- Eligible?
- —
Personal DTI + credit; lowest rate.
DSCR
20% down · 8.5% · 30yr
- Down + closing
- —
- Monthly P&I
- —
- Monthly cashflow
- —
- DSCR
- —
- Eligible?
- —
No personal income docs; deal must DSCR.
Hard money
10% down · 12.0% · 12mo
- Down + closing
- —
- Monthly P&I
- —
- Monthly cashflow
- —
- DSCR
- —
- Eligible?
- —
Short-term bridge; refi at stabilization.
Rent comps 32 comps
| Address | Beds | Baths | Sqft | Rent | $/sqft | DOM | Units | Dist |
|---|---|---|---|---|---|---|---|---|
| 2509 E 7th St Tulsa, OK | 3.0 | 2.0 | 1161 | $1,815 | $1.56 | 13d | 1 | 0.03mi |
| 2435 E 10th St Tulsa, OK | 3.0 | 1.0 | 1040 | $1,650 | $1.59 | 5d | 1 | 0.17mi |
| 2219 E 11th St Tulsa, OK | 1.0–3.0 | 1.0–3.0 | 1136 | $2,787 | $2.45 | 3d | 10 | 0.30mi |
| 2532 E 4th St Tulsa, OK | 2.0 | 2.0 | 1088 | $800 | $0.74 | 25d | 1 | 0.30mi |
| 2319 E 13th St Tulsa, OK | 2.0 | 1.0 | 875 | $1,400 | $1.60 | 25d | 1 | 0.50mi |
| 1122 S Xanthus Pl Tulsa, OK | 2.0 | 1.0 | 1000 | $1,245 | $1.25 | 5d | 1 | 0.52mi |
| 1140 S College Ave Unit C Tulsa, OK | 2.0 | 1.5 | 840 | $1,650 | $1.96 | 25d | 1 | 0.56mi |
| 1115 S College Ave Unit 16 Tulsa, OK | 2.0 | 1.0 | 775 | $1,275 | $1.65 | 25d | 1 | 0.58mi |
| 223 S Evanston Ave Tulsa, OK | 3.0 | 2.0 | 1220 | $1,395 | $1.14 | 25d | 1 | 0.59mi |
| 2808 E 1st Pl Unit P21-Q Tulsa, OK | 2.0 | 1.0 | 1025 | $1,250 | $1.22 | 25d | 1 | 0.60mi |
| 2529 E Admiral Pl Unit A Tulsa, OK | 2.0 | 1.0 | 1100 | $1,295 | $1.18 | 25d | 1 | 0.69mi |
| 44 S Florence Ave Tulsa, OK | 2.0 | 1.0 | 1080 | $1,450 | $1.34 | 25d | 1 | 0.75mi |
| 1338 S Florence Ave Unit 1 Tulsa, OK | 2.0 | 1.0 | 1200 | $1,450 | $1.21 | 5d | 1 | 0.79mi |
| 3328 E 7th St Tulsa, OK | 2.0 | 1.0 | 1008 | $1,525 | $1.51 | 17d | 1 | 0.88mi |
| 2508 E 17th St Tulsa, OK | 2.0 | 1.0 | 1180 | $1,600 | $1.36 | 16d | 1 | 0.92mi |
| 720 N Columbia Ave Tulsa, OK | 3.0 | 1.0 | 1233 | $1,150 | $0.93 | 5d | 1 | 0.99mi |
| 1201 S Rockford Ave Unit 11 Tulsa, OK | 2.0 | 1.5 | 920 | $885 | $0.96 | 25d | 1 | 1.01mi |
| 1201 S Rockford Ave Unit 7 Tulsa, OK | 2.0 | 1.5 | 920 | $875 | $0.95 | 5d | 1 | 1.01mi |
| 1307 S Indianapolis Ave Tulsa, OK | 2.0 | 1.0 | 1108 | $1,990 | $1.80 | 3d | 1 | 1.02mi |
| 1125 S Quincy Ave Unit 1127-1 Tulsa, OK | 2.0 | 1.0 | 740 | $950 | $1.28 | 5d | 1 | 1.05mi |
| 1736 S Xanthus Ave Tulsa, OK | 2.0 | 1.0 | 1328 | $1,450 | $1.09 | 5d | 1 | 1.10mi |
| 537 S Marion Ave Tulsa, OK | 2.0 | 1.0 | 933 | $1,325 | $1.42 | 5d | 1 | 1.15mi |
| 3238 E Easton St Tulsa, OK | 2.0 | 1.0 | 800 | $1,150 | $1.44 | 5d | 1 | 1.15mi |
| 624 S Peoria Ave Tulsa, OK | 3.0 | 1.0–2.5 | 1521 | $3,995 | $2.63 | 3d | 10 | 1.17mi |
| 723 N Gary Pl Tulsa, OK | 2.0 | 1.0 | 1213 | $1,200 | $0.99 | 25d | 1 | 1.23mi |
| 1411 S Quaker Ave Tulsa, OK | 2.0 | 1.5–2.5 | 1200 | $2,049 | $1.71 | 16d | 2 | 1.24mi |
| 1428 S Quaker Ave Tulsa, OK | 2.0 | 1.0 | 850 | $1,225 | $1.44 | 5d | 1 | 1.29mi |
| 1316 S Oswego Ave Tulsa, OK | 2.0 | 1.0 | 975 | $1,295 | $1.33 | 25d | 1 | 1.34mi |
| 2405 E 22nd St Tulsa, OK | 2.0 | 1.0 | 1000 | $1,600 | $1.60 | 25d | 1 | 1.34mi |
| 516 S Quebec Ave Tulsa, OK | 2.0 | 1.0 | 1200 | $1,295 | $1.08 | 25d | 1 | 1.37mi |
| 1632 S Louisville Ave Tulsa, OK | 3.0 | 1.0 | 1205 | $1,700 | $1.41 | 13d | 1 | 1.40mi |
| 3140 E 21st St Tulsa, OK | 2.0 | 1.0 | 1040 | $1,200 | $1.15 | 5d | 1 | 1.41mi |
Listing history 2 events
-
2026-06-22remarks 699-char remark
-
2026-06-22$175,000 Active 2 DOM
ⓘ Source: listings_history table (triggers on properties + properties_extension) + one-shot
backfill from property_details.listing_events for pre-trigger history.
Tax reassessment forecast OK · Resets to sale price
- Current annual tax
- $1,120 · $93/mo
- Projected year-2 tax
- $1,575 · $131/mo
- Expected delta
- +$455/yr (+$38/mo · 40.6%)
ⓘ Screening estimate from a state-policy table — verify with the county assessor before closing.
Climate risk First Street
- Flood 1/10 Low FEMA zone X (unshaded) · 0% chance over 30 yrs
- Wildfire 1/10 Low
- Heat 6/10 Major 7 d/yr ≥110°F today · 18 d/yr by 30 yrs out
- Wind 2/10 Low 4% chance of damaging wind over 30 yrs
- Air quality 2/10 Low 2 unhealthy d/yr today · 2 by 30 yrs out
Nearby sold comps map
Loading sold comps map…
Walkable amenities ~0.75 mi
Loading nearby amenities…
Taxation est. · year 1
- Rental income
- $19,792
- − Mortgage interest
- −$9,803
- − Property taxes
- −$1,120
- − Insurance
- −$875
- − Repairs & maintenance
- −$1,583
- − Management
- −$1,583
- − Depreciation
- −$5,091
- Taxable loss
- −$263
- Est. tax savings @ 24.0%
- +$63
- After-tax cash flow
- $2,692/yr
For passive investors: Depreciation is non-cash, so a rental often shows a tax loss while cash-flowing — sheltering income. Rental losses are passive: they offset passive income freely, and up to $25,000/yr can offset ordinary (W-2) income if you actively participate and your MAGI is under $100k (phasing out to $0 by $150k); unused losses carry forward. On sale, claimed depreciation is recaptured at up to 25%, and gains may owe capital-gains tax (a 1031 exchange can defer both). Figures are a year-1 estimate at your 24.0% rate — not tax advice; consult a CPA.
Schools (NCES district)
- District
- Tulsa
- NCES district ID
- 4030240
- Math proficiency
- 7% ▼ -9.00%
- Reading proficiency
- 12% ▼ -7.00%
- Median HH income
- $37,895
- Composite
- 8.04/100
- National rank
- #9919
- State rank
- #250 of 270 in OK
Livability — Tulsa
- Score
- 75/100
- State rank
- #13
- US rank
- #4058
Category grades
Schools grade is shown separately in the Schools card above.
Census & demographics
- Census place
- Tulsa, OK
- County
- Tulsa County · 640,811 people
- City population
- 389,418
- Metro
- Tulsa, OK
- Population (ZIP)
- 12,806
- Household income
- $54,691
- Rent vs Own
- Severe rent burden
- 700.0
Population outlook (Tulsa County) Hauer SSP2
- Today (2025)
- 723,846 people
- By 2030
- 766,033 · +5.8%
- By 2040
- 851,386 · +17.6%
- By 2050
- 938,389 · +29.6%
- By 2075
- 1,166,011 · +61.1%
- By 2100
- 1,350,277 · +86.5%
Race, ethnicity, and origin ACS 2023
- Neighborhood character
- Diverse neighborhood (Simpson 0.57)
- Race & ethnicity
- White 64% Hispanic / Latino 14% Two or more races 12% Black 7% Native American 5% Asian 4%
- Hispanic origin (detail)
- Mexican 11%
- Common ancestry
- Lithuanian 2% Slovak 2% Italian 2%
- Foreign-born
- 12% · Canada, China, South Korea
- Languages at home
- 81% English-only · Spanish 12% Arabic 2% Other Asian/Pacific 1%
Political lean MEDSL · Tulsa
- 2024 margin
- R (+15.2) · D 41.3% · R 56.5% · Other 2.2%
- 2008→2024 swing
- +9.2pp toward D · 2008: -24.5pp · 2024: -15.2pp
- All cycles
- 2024: R+15.2 2020: R+15.6 2016: R+22.9 2012: R+27.4 2008: R+24.5
Not yet ingested
- Civics
- —
Market trends
- HPI YoY
- ▼ -322.78%
- Current HPI
- 306.7856
- Rent YoY
- ▲ 5.80%
- Metro
- Tulsa, OK
- State GDP YoY
- ▲ 1.55%
- F500 in state
- 6
Industry mix (Fortune 500 HQ in OK)
| Industry | F500 HQs | Revenue |
|---|---|---|
| Energy | 3 | $48B |
|
||
Price history
+180.0% since first listed7 events — show timeline
- 2026-06-19 Listed $175,000 MLS Technology, Inc.
- 2023-12-14 Rental Removed $1,325 RENTLY
- 2023-12-06 Price Changed $1,325 RENTLY
- 2023-11-20 Price Changed $1,350 RENTLY
- 2023-11-16 Price Changed $1,375 RENTLY
- 2023-09-26 Listed for Rent $1,400 RENTLY
- 2018-07-13 Sold (Public Records) $62,500 Public Records
Property tax history
+45.9%/yrLatest (2025): $1,120 · +8.6% YoY. Source: county tax records.
Cash-flow waterfall
monthlySold comps — $/sqft
last 12 mo · ≤1 miLoading sold comps…