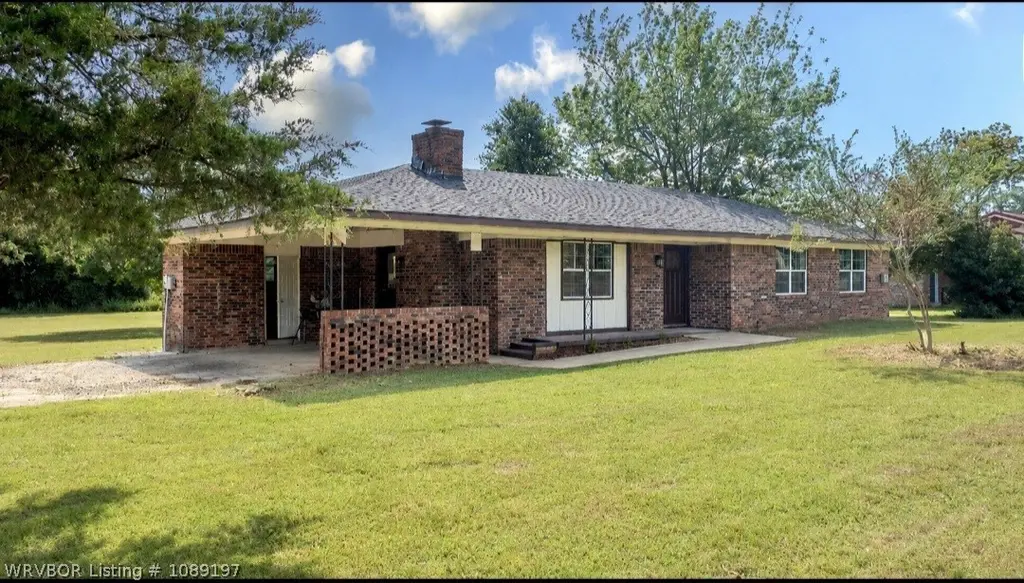
204 Highway 45 · Bonanza, AR
Flood risk 1/10 · Minimal
- FEMA flood zone
- X (unshaded)
- Chance of flooding over 30 yrs
- 0.0%
- Est. flood insurance / yr
- $507 – $1,088
Fire risk 7/10 · Major
- Est. fire insurance / yr
- $1,499 – $2,785
Heat risk 6/10 · Moderate
- Hot days now (above 111°F)
- 7 days/yr
- Hot days in 30 yrs
- 20 days/yr
Wind risk 2/10 · Minimal
- Chance of severe wind over 30 yrs
- 3.0%
Air-quality risk 2/10 · Minimal
- Unhealthy air days now
- 0 days/yr
- Unhealthy air days in 30 yrs
- 1 days/yr
Risk factors via First Street. Map © Google.
Why this score? — see what drove the D+ grade
The composite is a weighted blend of 9 inputs, each scored 0–100. Each bar is that input's sub-score; the figure is the points it added to the 100-point composite (weight × sub-score).
- Cash flow +14.3/30.0
- ARV discount +13.8/15.0
- DSCR +4.4/10.0
- 1% rule +4.0/10.0
- Livability +3.3/5.0
- Rent growth +2.9/5.0
- Condition / age +2.5/5.0
- Schools +2.3/10.0
- Appreciation +0.0/10.0
$185,000
🖨 Deal sheet 📄 Offer letter ✓ Due diligence
Listing remarks
Welcome home to this beautifully remodeled 3-bedroom, 2-bath home sitting on over half an acre just minutes from Fort Smith AR. This move in ready property has been completely redone with modern updates throughout while still offering the charm of a classic brick home. This property is price to sell!
Key facts
- 0.75 acre lot
- Listed 25 days
Property features AI
Exterior
- Parking: Attached carport; 1 covered space; Gravel parking
- Security: Smoke detectors; Fire alarm
- Utilities: Public water; Sewer available; Electricity available; Cable available; Water available
- Home design: Single family residence; One story; House
- Construction: Brick construction; Shingle/asphalt roof; Slab foundation; Built as a house
- Exterior features: Patio; Cleared city lot; Highway frontage
Interior
- Kitchen: Dishwasher; Oven; Range; Refrigerator; Electric water heater
- Flooring: Laminate; Vinyl
- Bathrooms: 2 full bathrooms
- Heating & cooling: Central heating; Central air; Attic fan
- Interior features: Eat-in kitchen; Fireplace in the living room
- Laundry & utility: Washer hookup; Electric dryer hookup
Neighborhood map
What this means for you Summary
Snapshot
- This is a 3-bed/2.0-bath single-family listed at $185k.
Deal economics
- At list price, monthly cash flow is $35 ($418/yr) — positive.
- The deal already cash-flows at list — no discount required.
- To meet the 1% rule (rent ≥ 1% of price), the offer needs to be $166k (10.1% below list).
- Recommended offer: $166k (10.1% below list) — sets the bar for 1% rule.
Location & tenants
- Location reads 66/100 on livability (#137 in AR) — a middle-class / working-renter tenant base. Strengths: crime A+, cost of living A+, housing A+; Watch: amenities F, commute F, employment D-.
- Hackett School District (rural): math 24% / reading 29% proficiency, ranked #173 of 238 in AR (top 73%) — low school quality limits family demand, transient renter base, plan for 1-2y turnover.
- Zoned schools: Hackett Elementary School (math 24% / reading 16%, grade F, #376 of 454 statewide, top 84%, 493 students, 100% FRL); Hackett High School (math 24% / reading 40%, grade F, #119 of 292 statewide, top 43%, 327 students, 100% FRL) — zoned schools average 100% FRL vs 54% district-wide (46 pts higher); higher-poverty schools than district average — tighter screening recommended.
- Market conditions: Rents rising (+1.6%/yr); 235 active listings in the ZIP; solid renter incomes; 388 units permitted in Sebastian County in 2024 (16 in 5+ unit buildings).
Forward outlook
- Local home prices are declining (-3.0%/yr); year-one equity from $1k of loan paydown is wiped out by about $6k of value loss. Plan a longer hold.
- Sebastian County population projected at +7% by 2050 — modest demand growth; plan on rents tracking national, not racing it.
Negotiation context
- It's been on market 26 days — a 2% lower offer ($182k) is reasonable based on typical stale-listing flexibility.
- Current owner paid $70k; list at $185k implies a 164% gain — meaningful room to come down on a strong offer.
Risks & watch-outs
- Climate carrying-cost: major wildfire risk; extreme-heat days projected 7→20/yr by 2055 (HVAC capex compounding) — expect insurance premiums to compound above CPI over the hold.
Questions for the listing agent
- Is there a deadline driving the sale (1031 exchange, divorce, estate, relocation)? That informs how much negotiation room exists.
- Schools are F-rated, which usually means shorter tenancies and higher turnover. Who's the typical renter profile here, and what's been the actual vacancy rate?
- The area grade is low — what's the realistic commute time and amenity access for the typical tenant pool here? Any planned neighborhood developments (good or bad) we should know about?
- What's the average days-on-market for RENTAL listings here right now (not sales)? A rising rental-DOM trend means longer vacancies and softer asking-rent achievability than the comps imply.
- What's the recent tenant-quality profile in this submarket — average credit score on applications, eviction rate, late-payment / NSF rate, and stable-employment percentage? A property-management company in the area should have these aggregated.
- How much new for-sale + rental construction is in the pipeline within 1–3 miles? Heavy new supply typically softens prices + rents 12–24 months out; constrained supply supports both.
Investment metrics
- 1% rule
- 0.90% ✗
- Cap rate
- 6.52%
- Cash-on-cash
- 0.81%
- DSCR
- 1.04
- GRM
- 9.3
CMA / ARV
- ARV (on-the-fly)
- $215,050
- Comps found
- 4
Show comp detail 4 sales within ~0.75 mi
| Address | Dist | Beds/Ba | Sqft | Sold | Price | $/sf | Match |
|---|---|---|---|---|---|---|---|
| 111 Sherwood Ave | 0.45mi | 2/2.0 (-1) | 1,274 (+1%) | 6mo | $140,000 | $110 | 68 |
| 606 Mcconnell Ave | 0.16mi | 2/1.0 (-1) | 1,120 (-12%) | 18mo | $12,650 | $11 | 50 |
| 1018 Lavender Rd | 0.71mi | 3/2.5 | 1,378 (+9%) | 1mo | $234,000 | $170 | 49 |
| 501 S Fifth Ave | 0.52mi | 3/1.0 | 1,428 (+13%) | 6mo | $258,000 | $181 | 45 |
Match score weights: distance 35% · size 25% · config 20% · recency 20%. Top-matched comps best support the ARV.
Projected returns pro-forma
-3.0% appreciation · 1.57% rent growth · sell at horizon
- IRR
- -16.6%
- Equity multiple
- 0.42×
- Total profit
- $-30,095
- Equity at exit
- $27,584
- IRR
- -11.2%
- Equity multiple
- 0.37×
- Total profit
- $-32,653
- Equity at exit
- $15,995
Cash invested: $51,800 (down + closing). Projections, not guarantees.
Landlord ↔ Tenant lean methodology
- Overall (STATE)
- 92 Strongly Landlord-Friendly
- State Arkansas
- 92 Strongly Landlord-Friendly · R+14
- County
- — inherits STATE
- City
- — inherits STATE
ZIP-level market 72916
- Home prices YoY
- -20.1%
- Rents YoY
- 1.6%
- Active inventory
- 235
- Price-to-rent
- 9.3×
Monthly cashflow live
- Estimated rent
- $1,662 medium interval (Pro) →
- Mortgage (P&I)
- −$970
- Tax est. 1.5%
- −$231 /mo · $2,775/yr
- Insurance
- −$77
- HOA
- −$0
- Vacancy / Maint / Mgmt
- −$349
- Net cashflow
- $35
Break-even live
UW: 25.0% down · 7.5% · 30yr · 1.5% tax · 5.0% vac · 8.0% maint · 8.0% mgmt
Financing live
Cash to close
- Down payment
- $46,250
- Closing costs
- $5,550
- Reserves months
- —
- Total cash needed
- —
Loan-product check · same deal, 3 products live
Conventional
25% down · 7.5% · 30yr
- Down + closing
- —
- Monthly P&I
- —
- Monthly cashflow
- —
- DSCR
- —
- Eligible?
- —
Personal DTI + credit; lowest rate.
DSCR
20% down · 8.5% · 30yr
- Down + closing
- —
- Monthly P&I
- —
- Monthly cashflow
- —
- DSCR
- —
- Eligible?
- —
No personal income docs; deal must DSCR.
Hard money
10% down · 12.0% · 12mo
- Down + closing
- —
- Monthly P&I
- —
- Monthly cashflow
- —
- DSCR
- —
- Eligible?
- —
Short-term bridge; refi at stabilization.
Listing history 19 events
-
2026-06-19days on market $185,000 Active 26 DOM
-
2026-06-18days on market $185,000 Active 25 DOM
-
2026-06-17days on market $185,000 Active 24 DOM
-
2026-06-16days on market $185,000 Active 23 DOM
-
2026-06-15days on market $185,000 Active 22 DOM
-
2026-06-14days on market $185,000 Active 20 DOM
-
2026-06-13days on market $185,000 Active 19 DOM
-
2026-06-10days on market $185,000 Active 17 DOM
-
2026-06-09days on market $185,000 Active 16 DOM
-
2026-06-08days on market $185,000 Active 15 DOM
-
2026-06-07days on market $185,000 Active 14 DOM
-
2026-06-05days on market $185,000 Active 11 DOM
-
2026-06-03days on market $185,000 Active 10 DOM
-
2026-06-02days on market $185,000 Active 9 DOM
-
2026-06-01days on market $185,000 Active 8 DOM
-
2026-05-31days on market $185,000 Active 7 DOM
-
2026-05-30days on market $185,000 Active 6 DOM
-
2026-05-19$185,000 Active
-
2025-10-22soldstatus $70,000
ⓘ Source: listings_history table (triggers on properties + properties_extension) + one-shot
backfill from property_details.listing_events for pre-trigger history.
Climate risk First Street
- Flood 1/10 Low FEMA zone X (unshaded) · 0% chance over 30 yrs
- Wildfire 7/10 Severe
- Heat 6/10 Major 7 d/yr ≥111°F today · 20 d/yr by 30 yrs out
- Wind 2/10 Low 3% chance of damaging wind over 30 yrs
- Air quality 2/10 Low 0 unhealthy d/yr today · 1 by 30 yrs out
Nearby sold comps map
Loading sold comps map…
Walkable amenities ~0.75 mi
Loading nearby amenities…
Taxation est. · year 1
- Rental income
- $19,949
- − Mortgage interest
- −$10,363
- − Property taxes
- −$2,775
- − Insurance
- −$925
- − Repairs & maintenance
- −$1,596
- − Management
- −$1,596
- − Depreciation
- −$5,382
- Taxable loss
- −$2,688
- Est. tax savings @ 24.0%
- +$645
- After-tax cash flow
- $1,063/yr
For passive investors: Depreciation is non-cash, so a rental often shows a tax loss while cash-flowing — sheltering income. Rental losses are passive: they offset passive income freely, and up to $25,000/yr can offset ordinary (W-2) income if you actively participate and your MAGI is under $100k (phasing out to $0 by $150k); unused losses carry forward. On sale, claimed depreciation is recaptured at up to 25%, and gains may owe capital-gains tax (a 1031 exchange can defer both). Figures are a year-1 estimate at your 24.0% rate — not tax advice; consult a CPA.
Schools (NCES district)
- District
- Hackett School District
- NCES district ID
- 0507170
- Math proficiency
- 24% ▼ -16.00%
- Reading proficiency
- 29% ▼ -17.00%
- Median HH income
- $42,751
- Composite
- 22.59/100
- National rank
- #8071
- State rank
- #173 of 238 in AR
Livability — Bonanza
- Score
- 66/100
- State rank
- #137
- US rank
- #12289
Category grades
Schools grade is shown separately in the Schools card above.
Census & demographics
- Census place
- Bonanza, AR
- County
- Sebastian County · 99,312 people
- Metro
- Fort Smith, AR-OK
- Population (ZIP)
- 11,711
- Household income
- $87,983
- Rent vs Own
- Severe rent burden
- 141.0
Population outlook (Sebastian County) Hauer SSP2
- Today (2025)
- 133,992 people
- By 2030
- 136,620 · +2.0%
- By 2040
- 140,832 · +5.1%
- By 2050
- 143,301 · +6.9%
- By 2075
- 147,964 · +10.4%
- By 2100
- 145,848 · +8.8%
Race, ethnicity, and origin ACS 2023
- Neighborhood character
- Predominantly White (75%)
- Race & ethnicity
- White 75% Two or more races 10% Asian 7% Hispanic / Latino 6% Black 4%
- Hispanic origin (detail)
- Mexican 5%
- Common ancestry
- Italian 4% Scandinavian 2% Slovak 2%
- Foreign-born
- 6% · Canada
- Languages at home
- 89% English-only · Spanish 3% Other Asian/Pacific 3% German/W. Germanic 2%
Political lean MEDSL · Sebastian
- 2024 margin
- Solid R (+37.5) · D 30.0% · R 67.6% · Other 2.4%
- 2008→2024 swing
- -2.9pp toward R · 2008: -34.6pp · 2024: -37.5pp
- All cycles
- 2024: R+37.5 2020: R+35.5 2016: R+38.1 2012: R+37.1 2008: R+34.6
Not yet ingested
- Civics
- —
Market trends
- HPI YoY
- ▼ -54.92%
- Current HPI
- 218.0302
- Rent YoY
- ▲ 1.57%
- Metro
- Fort Smith, AR-OK
- State GDP YoY
- ▲ 3.80%
- F500 in state
- 10
Industry mix (Fortune 500 HQ in AR)
| Industry | F500 HQs | Revenue |
|---|---|---|
| Retail | 1 | $681B |
|
||
| Food / Agriculture | 1 | $53B |
|
||
| Retail / Energy | 1 | $22B |
|
||
| Transportation / Logistics | 1 | $12B |
|
||
| Energy | 1 | $4B |
|
||
Price history
+164.3% since first listed2 events — show timeline
- 2026-05-19 Listed $185,000 WRVBOR
- 2025-10-22 Sold (Public Records) $70,000 Public Records
Property tax history
-8.2%/yrLatest (2025): $235 · -20.4% YoY. Source: county tax records.
Cash-flow waterfall
monthlySold comps — $/sqft
last 12 mo · ≤1 miLoading sold comps…