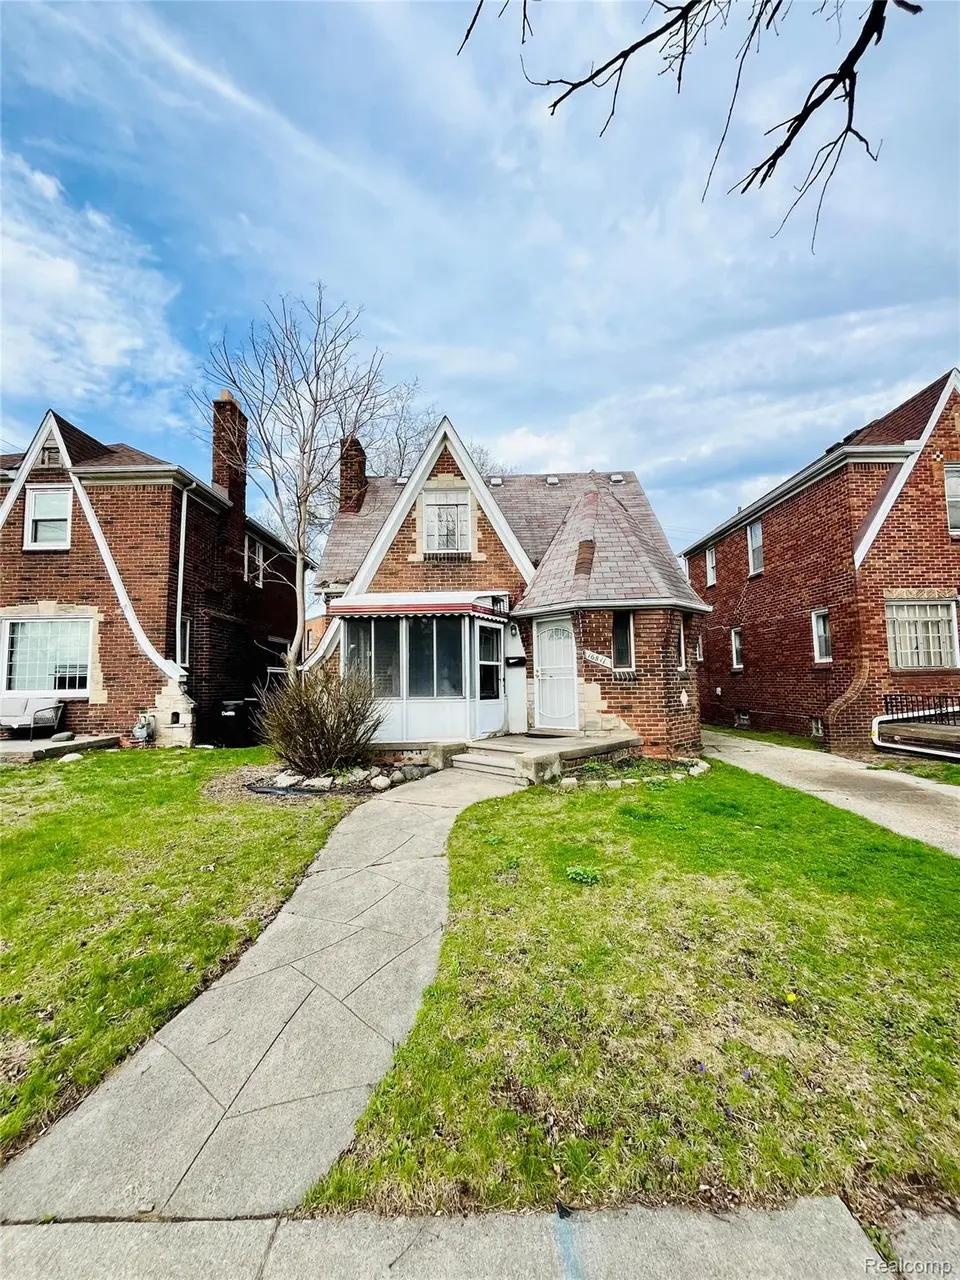
16811 Manor St · Detroit, MI
Flood risk 1/10 · Minimal
- FEMA flood zone
- X (unshaded)
- Chance of flooding over 30 yrs
- 0.0%
- Est. flood insurance / yr
- $473 – $860
Fire risk 1/10 · Minimal
- Est. fire insurance / yr
- $784 – $1,456
Heat risk 3/10 · Minor
- Hot days now (above 97°F)
- 7 days/yr
- Hot days in 30 yrs
- 15 days/yr
Wind risk 2/10 · Minimal
- Chance of severe wind over 30 yrs
- —
Air-quality risk 3/10 · Minor
- Unhealthy air days now
- 2 days/yr
- Unhealthy air days in 30 yrs
- 5 days/yr
Risk factors via First Street. Map © Google.
Why this score? — see what drove the B+ grade
The composite is a weighted blend of 9 inputs, each scored 0–100. Each bar is that input's sub-score; the figure is the points it added to the 100-point composite (weight × sub-score).
- Cash flow +30.0/30.0
- ARV discount +15.0/15.0
- 1% rule +10.0/10.0
- DSCR +10.0/10.0
- Livability +3.7/5.0
- Rent growth +3.4/5.0
- Condition / age +2.5/5.0
- Schools +1.3/10.0
- Appreciation +0.0/10.0
$44,900
🖨 Deal sheet (PDF) 📄 Offer letter ✓ Due diligence
Listing remarks MLS
1,516 sq. ft. , 3 bedroom, 1.5 bath, brick bungalow located in Arcadia Park. Well-proportioned layout with good natural flow between living, dining, and kitchen areas. Bedrooms offer solid size and closet space. Full basement provides additional storage and laundry. Property will need roof repair/replacement, presenting a strong opportunity for a flip or value-add rental investment. Great potential for investors or rehab buyers looking for upside.
Key facts
- 3,920 sq ft lot
- Built 1938
- Listed 2 days
Neighborhood map
What this means for you Summary
Snapshot
- This is a 3-bed/1.0-bath single-family listed at $45k.
Deal economics
- At list price, monthly cash flow is $699 ($8k/yr) — positive.
- The deal already cash-flows at list — no discount required.
- Meets the 1% rule at list price ($1k rent vs $45k).
- Cap rate 25.0% vs local median 10.0% in Detroit — top-decile yield for the area; either an underpriced asset or a hidden risk that comps aren't pricing in. Stress-test before assuming the spread holds.
Location & tenants
- Location reads 73/100 on livability (#218 in MI) — a middle-class / working-renter tenant base. Strengths: amenities A+, commute A+, cost of living A+; Watch: schools F, crime F, employment F.
- Detroit Public Schools Community District (urban): math 10% / reading 24% proficiency, ranked #499 of 540 in MI (top 92%) — low school quality limits family demand, transient renter base, plan for 1-2y turnover; 90% free/reduced lunch — lower-income household profile, screen leases tightly.
- Market conditions: Rents rising (+3.4%/yr); 349 active listings in the ZIP; 40 comparable units currently listed for rent nearby; rentals at typical pace (median 26d on market — plan ~3-4 weeks tenant-placement turnaround); 2,639 units permitted in Wayne County in 2024 (1,216 in 5+ unit buildings).
Forward outlook
- Local home prices are declining (-3.0%/yr); year-one equity from $310 of loan paydown is wiped out by about $1k of value loss. Plan a longer hold.
- Wayne County population projected at -17% by 2050 — secular population decline; favor cash flow + early exit over multi-decade hold.
- At projected returns (-3.0% appreciation + 3.4% rent growth), your $13k cash investment doubles in ~2 years — after that, you're playing with house money.
Negotiation context
- Only 2 days on market — expect competitive offers; lowballing is unlikely to land.
- 5 sale attempts since 24y ago with the ask held roughly flat each time — persistent listings suggest the price (not the market) is what's stuck; bring a comps-based counter.
Risks & watch-outs
- Watch-outs: property tax is 2.8% of price; built in 1938 — expect roof / HVAC / electrical / plumbing capex.
Questions for the listing agent
- Built in 1938 — when were the roof, HVAC, electrical panel, plumbing, and water heater last replaced?
- Property tax is high relative to price — has the assessment been appealed recently, and will the sale trigger a re-assessment?
- Is there a deadline driving the sale (1031 exchange, divorce, estate, relocation)? That informs how much negotiation room exists.
- Schools are F-rated, which usually means shorter tenancies and higher turnover. Who's the typical renter profile here, and what's been the actual vacancy rate?
- Crime grade is F in this area — have there been break-ins, vandalism, or insurance claims at this property in the last 3 years? What carrier currently insures it and at what premium?
- What's the average days-on-market for RENTAL listings here right now (not sales)? A rising rental-DOM trend means longer vacancies and softer asking-rent achievability than the comps imply.
- What's the recent tenant-quality profile in this submarket — average credit score on applications, eviction rate, late-payment / NSF rate, and stable-employment percentage? A property-management company in the area should have these aggregated.
- How much new for-sale + rental construction is in the pipeline within 1–3 miles? Heavy new supply typically softens prices + rents 12–24 months out; constrained supply supports both.
Investment metrics
- 1% rule
- 2.98% ✓
- Cap rate
- 24.97%
- Cash-on-cash
- 66.69%
- DSCR
- 3.97
- GRM
- 2.8
CMA / ARV
- ARV (on-the-fly)
- $68,970
- Comps found
- 12
Show comp detail 12 sales within ~0.75 mi
| Address | Dist | Beds/Ba | Sqft | Sold | Price | $/sf | Match |
|---|---|---|---|---|---|---|---|
| 16516 Appoline St | 0.17mi | 3/1.0 | 1,350 (+8%) | 1mo | $39,500 | $29 | 78 |
| 16800 Ilene St | 0.36mi | 3/2.5 | 1,298 (+4%) | 1mo | $210,000 | $162 | 70 |
| 16562 Tracey St | 0.59mi | 3/1.0 | 1,244 (-1%) | 2mo | $60,000 | $48 | 69 |
| 15771 Birwood St | 0.57mi | 3/1.5 | 1,290 (+3%) | 0mo | $128,995 | $100 | 66 |
| 17621 Meyers Rd | 0.53mi | 2/2.0 (-1) | 1,264 (+1%) | 0mo | $40,000 | $32 | 65 |
| 16176 Tracey St | 0.63mi | 3/2.0 | 1,270 (+1%) | 1mo | $70,000 | $55 | 64 |
| 17147 Appoline St | 0.23mi | 3/2.0 | 1,100 (-12%) | 1mo | $170,000 | $155 | 64 |
| 17161 Ward Ave | 0.38mi | 3/1.5 | 1,377 (+10%) | 2mo | $194,500 | $141 | 62 |
| 16180 Snowden St | 0.49mi | 3/1.0 | 1,137 (-9%) | 0mo | $61,000 | $54 | 61 |
| 16863 Tracey St | 0.61mi | 3/2.0 | 1,200 (-4%) | 2mo | $165,000 | $138 | 58 |
| 15824 Snowden St | 0.60mi | 3/1.0 | 1,127 (-10%) | 1mo | $61,000 | $54 | 54 |
| 15824 Snowden St | 0.60mi | 3/1.0 | 1,127 (-10%) | 1mo | $61,000 | $54 | 54 |
Match score weights: distance 35% · size 25% · config 20% · recency 20%. Top-matched comps best support the ARV.
Projected returns pro-forma
-3.0% appreciation · 3.44% rent growth · sell at horizon
- IRR
- 66.5%
- Equity multiple
- 4.01×
- Total profit
- $37,872
- Equity at exit
- $6,695
- IRR
- 70.9%
- Equity multiple
- 8.39×
- Total profit
- $92,954
- Equity at exit
- $3,882
Cash invested: $12,572 (down + closing). Projections, not guarantees.
Landlord ↔ Tenant lean methodology
- Overall (STATE)
- 62 Landlord-Friendly
- State Michigan
- 62 Landlord-Friendly · EVEN
- County
- — inherits STATE
- City
- — inherits STATE
ZIP-level market 48221
- Rents YoY
- 3.4%
- Active inventory
- 349
- Price-to-rent
- 2.8×
Monthly cashflow live
- Estimated rent
- $1,340 high interval (Pro) →
- Mortgage (P&I)
- −$235
- Tax from tax record
- −$106 /mo · $1,267/yr
- Insurance
- −$19
- HOA
- −$0
- Vacancy / Maint / Mgmt
- −$281
- Net cashflow
- $699
Break-even live
Sensitivity live
| Price | -10% $724 | -5% $711 | +0% $699 | +5% $686 | +10% $673 |
|---|---|---|---|---|---|
| Rent | -10% $593 | -5% $646 | +0% $699 | +5% $752 | +10% $805 |
| Rate | -1.0pp $721 | -0.5pp $710 | base $699 | +0.5pp $687 | +1.0pp $675 |
UW: 25.0% down · 7.5% · 30yr · 1.5% tax · 5.0% vac · 8.0% maint · 8.0% mgmt
Financing live
Cash to close
- Down payment
- $11,225
- Closing costs
- $1,347
- Reserves months
- —
- Total cash needed
- —
Loan-product check · same deal, 3 products live
Conventional
25% down · 7.5% · 30yr
- Down + closing
- —
- Monthly P&I
- —
- Monthly cashflow
- —
- DSCR
- —
- Eligible?
- —
Personal DTI + credit; lowest rate.
DSCR
20% down · 8.5% · 30yr
- Down + closing
- —
- Monthly P&I
- —
- Monthly cashflow
- —
- DSCR
- —
- Eligible?
- —
No personal income docs; deal must DSCR.
Hard money
10% down · 12.0% · 12mo
- Down + closing
- —
- Monthly P&I
- —
- Monthly cashflow
- —
- DSCR
- —
- Eligible?
- —
Short-term bridge; refi at stabilization.
Rent comps 40 comps
| Address | Beds | Baths | Sqft | Rent | $/sqft | DOM | Units | Dist |
|---|---|---|---|---|---|---|---|---|
| 16204 Steel St Detroit, MI | 3.0 | 1.0 | 969 | $1,150 | $1.19 | 45d | 1 | 0.30mi |
| 16934 Ilene St Detroit, MI | 3.0 | 1.5 | 1516 | $1,400 | $0.92 | 21d | 1 | 0.36mi |
| 16889 Washburn St Detroit, MI | 3.0 | 1.5 | 1300 | $1,100 | $0.85 | 19d | 1 | 0.38mi |
| 16230 Cheyenne St Detroit, MI | 3.0 | 1.0 | 1653 | $1,450 | $0.88 | 45d | 1 | 0.40mi |
| 17540 Pinehurst St Detroit, MI | 3.0 | 1.0 | 1200 | $1,395 | $1.16 | 45d | 1 | 0.43mi |
| 15760 Monte Vista St Detroit, MI | 2.0 | 1.0 | 1080 | $1,250 | $1.16 | 45d | 1 | 0.57mi |
| 16230 Indiana St Unit 2 Detroit, MI | 2.0 | 1.0 | 1050 | $1,200 | $1.14 | 19d | 1 | 0.62mi |
| 16546 Wisconsin St Detroit, MI | 3.0 | 1.0 | 1577 | $1,500 | $0.95 | 45d | 1 | 0.65mi |
| 15512 Mendota St Detroit, MI | 2.0 | 1.0 | 931 | $1,200 | $1.29 | 6d | 1 | 0.66mi |
| 15512 Mendota St Apt 2 Detroit, MI | 2.0 | 1.0 | 1000 | $1,200 | $1.20 | 45d | 1 | 0.66mi |
| 15708 Birwood St Detroit, MI | 3.0 | 1.0 | 1255 | $1,100 | $0.88 | 6d | 1 | 0.66mi |
| 16183 Wisconsin St Detroit, MI | 3.0 | 1.5 | 1370 | $1,400 | $1.02 | 45d | 1 | 0.67mi |
| 15765 Washburn St Unit 15767 Washburn Upper Detroit, MI | 2.0 | 1.0 | 1093 | $950 | $0.87 | 0d | 1 | 0.68mi |
| 16505 Stansbury St Detroit, MI | 3.0 | 1.0 | 1100 | $1,250 | $1.14 | 12d | 1 | 0.75mi |
| 16505 Stansbury St Detroit, MI | 3.0 | 1.0 | 1700 | $1,345 | $0.79 | 45d | 1 | 0.75mi |
| 15388 Appoline St #203 Detroit, MI | 2.0 | 1.0 | 900 | $850 | $0.94 | 45d | 1 | 0.77mi |
| 17159 Northlawn St Unit 17161 Detroit, MI | 2.0 | 1.0 | 1122 | $975 | $0.87 | 6d | 1 | 0.80mi |
| 17195 Northlawn St #1 Detroit, MI | 2.0 | 1.0 | 1200 | $1,100 | $0.92 | 21d | 1 | 0.81mi |
| 17195 Northlawn St #2 Detroit, MI | 2.0 | 1.0 | 1200 | $1,050 | $0.88 | 26d | 1 | 0.81mi |
| 15777 Wisconsin St Unit 77 Detroit, MI | 2.0 | 1.0 | 900 | $950 | $1.06 | 6d | 1 | 0.81mi |
| 18010 Lesure St Detroit, MI | 3.0 | 1.0 | 1010 | $1,500 | $1.49 | 0d | 1 | 0.84mi |
| 15791 Cherrylawn St Detroit, MI | 2.0 | 1.0 | 1792 | $1,100 | $0.61 | 45d | 1 | 0.89mi |
| 15517 Lesure St Unit BDRM1A Detroit, MI | 2.0 | 1.0 | 1000 | $850 | $0.85 | 26d | 1 | 0.92mi |
| 18675 Meyers Rd Unit 18677 Detroit, MI | 2.0 | 1.0 | 942 | $1,100 | $1.17 | 45d | 1 | 0.96mi |
| 17530 Roselawn St Unit 1 Detroit, MI | 3.0 | 2.0 | 1600 | $2,000 | $1.25 | 26d | 1 | 0.96mi |
| 15340 Hartwell St Detroit, MI | 2.0 | 1.0 | 900 | $1,300 | $1.44 | 18d | 1 | 0.96mi |
| 15088 Littlefield St Detroit, MI | 2.0 | 1.0 | 1294 | $1,275 | $0.99 | 23d | 1 | 1.01mi |
| 18512 Schaefer Hwy Detroit, MI | 2.0 | 1.0 | 962 | $1,200 | $1.25 | 26d | 1 | 1.02mi |
| 15387 Lesure St Detroit, MI | 3.0 | 1.0 | 1064 | $1,350 | $1.27 | 14d | 1 | 1.02mi |
| 17368 Woodingham Dr Detroit, MI | 3.0 | 1.5 | 1200 | $1,800 | $1.50 | 45d | 1 | 1.04mi |
| 15762 Mark Twain St Detroit, MI | 3.0 | 2.0 | 1430 | $1,250 | $0.87 | 18d | 1 | 1.06mi |
| 15457 Cloverlawn St Detroit, MI | 3.0 | 2.0 | 1500 | $1,275 | $0.85 | 26d | 1 | 1.07mi |
| 16722 Tuller St Detroit, MI | 3.0 | 1.5 | 1100 | $1,500 | $1.36 | 18d | 1 | 1.08mi |
| 14881 Mendota St Detroit, MI | 3.0 | 1.0 | 1026 | $1,100 | $1.07 | 26d | 1 | 1.12mi |
| 16255 Lilac St Detroit, MI | 3.0 | 1.0 | 1312 | $1,394 | $1.06 | 19d | 1 | 1.13mi |
| 18257 Mark Twain St Detroit, MI | 3.0 | 1.0 | 1185 | $1,507 | $1.27 | 18d | 1 | 1.16mi |
| 15771 Turner St Detroit, MI | 2.0 | 1.0 | 1000 | $1,049 | $1.05 | 45d | 1 | 1.16mi |
| 18935 Indiana St Detroit, MI | 3.0 | 1.0 | 1248 | $1,523 | $1.22 | 6d | 1 | 1.16mi |
| 17163 Prairie St Unit 1B Detroit, MI | 3.0 | 1.5 | 1317 | $1,350 | $1.03 | 45d | 1 | 1.22mi |
| 14891 Hartwell St Detroit, MI | 3.0 | 1.0 | 1000 | $1,150 | $1.15 | 45d | 1 | 1.22mi |
Listing history 13 events
-
2026-04-17status Pending 451-char remark
Show marketing remark (451 chars)
1,516 sq. ft. , 3 bedroom, 1.5 bath, brick bungalow located in Arcadia Park. Well-proportioned layout with good natural flow between living, dining, and kitchen areas. Bedrooms offer solid size and closet space. Full basement provides additional storage and laundry. Property will need roof repair/replacement, presenting a strong opportunity for a flip or value-add rental investment. Great potential for investors or rehab buyers looking for upside.
-
2026-04-17status Pending
Show marketing remark (451 chars)
1,516 sq. ft. , 3 bedroom, 1.5 bath, brick bungalow located in Arcadia Park. Well-proportioned layout with good natural flow between living, dining, and kitchen areas. Bedrooms offer solid size and closet space. Full basement provides additional storage and laundry. Property will need roof repair/replacement, presenting a strong opportunity for a flip or value-add rental investment. Great potential for investors or rehab buyers looking for upside.
-
2026-04-15$44,900 Active
Show marketing remark (451 chars)
1,516 sq. ft. , 3 bedroom, 1.5 bath, brick bungalow located in Arcadia Park. Well-proportioned layout with good natural flow between living, dining, and kitchen areas. Bedrooms offer solid size and closet space. Full basement provides additional storage and laundry. Property will need roof repair/replacement, presenting a strong opportunity for a flip or value-add rental investment. Great potential for investors or rehab buyers looking for upside.
-
2026-04-15$44,900 Active 451-char remark
Show marketing remark (451 chars)
1,516 sq. ft. , 3 bedroom, 1.5 bath, brick bungalow located in Arcadia Park. Well-proportioned layout with good natural flow between living, dining, and kitchen areas. Bedrooms offer solid size and closet space. Full basement provides additional storage and laundry. Property will need roof repair/replacement, presenting a strong opportunity for a flip or value-add rental investment. Great potential for investors or rehab buyers looking for upside.
-
2024-02-04historical $1,100
-
2024-01-01price $1,100
-
2023-12-13price $1,200
-
2023-10-20$1,300
-
2006-11-06soldstatus $110,000
-
2004-06-30historical
-
2003-12-30$95,000
-
2003-02-26historical
-
2002-08-27$110,000
ⓘ Source: listings_history table (triggers on properties + properties_extension) + one-shot
backfill from property_details.listing_events for pre-trigger history.
Tax reassessment forecast MI · Partial reset (capped growth)
- Current annual tax
- $1,267 · $106/mo
- Projected year-2 tax
- $1,267 · $106/mo
- Expected delta
- $0/yr ($0/mo · 0.0%)
ⓘ Screening estimate from a state-policy table — verify with the county assessor before closing.
Climate risk First Street
- Flood 1/10 Low FEMA zone X (unshaded) · 0% chance over 30 yrs
- Wildfire 1/10 Low
- Heat 3/10 Moderate 7 d/yr ≥97°F today · 15 d/yr by 30 yrs out
- Wind 2/10 Low
- Air quality 3/10 Moderate 2 unhealthy d/yr today · 5 by 30 yrs out
Nearby sold comps map
Loading sold comps map…
Walkable amenities ~0.75 mi
Loading nearby amenities…
Taxation est. · year 1
- Rental income
- $16,078
- − Mortgage interest
- −$2,515
- − Property taxes
- −$1,267
- − Insurance
- −$224
- − Repairs & maintenance
- −$1,286
- − Management
- −$1,286
- − Depreciation
- −$1,306
- Taxable income
- $8,193
- Est. tax owed @ 24.0%
- −$1,966
- After-tax cash flow
- $6,418/yr
For passive investors: Depreciation is non-cash, so a rental often shows a tax loss while cash-flowing — sheltering income. Rental losses are passive: they offset passive income freely, and up to $25,000/yr can offset ordinary (W-2) income if you actively participate and your MAGI is under $100k (phasing out to $0 by $150k); unused losses carry forward. On sale, claimed depreciation is recaptured at up to 25%, and gains may owe capital-gains tax (a 1031 exchange can defer both). Figures are a year-1 estimate at your 24.0% rate — not tax advice; consult a CPA.
Schools (NCES district)
- District
- Detroit Public Schools Community District
- NCES district ID
- 2601103
- Math proficiency
- 10% ▼ -2.00%
- Reading proficiency
- 24% ▲ 6.00%
- Median HH income
- $25,815
- Composite
- 13.06/100
- National rank
- #9564
- State rank
- #499 of 540 in MI
Livability — Detroit
- Score
- 73/100
- State rank
- #218
- US rank
- #5427
Category grades
Schools grade is shown separately in the Schools card above.
Census & demographics
- Census place
- Detroit, MI
- County
- Wayne County · 1,562,939 people
- City population
- 572,865
- Metro
- Detroit-Warren-Dearborn, MI
- Population (ZIP)
- 41,392
- Household income
- $57,878
- Rent vs Own
- Severe rent burden
- 1646.0
Population outlook (Wayne County) Hauer SSP2
- Today (2025)
- 1,675,273 people
- By 2030
- 1,620,300 · -3.3%
- By 2040
- 1,502,341 · -10.3%
- By 2050
- 1,384,039 · -17.4%
- By 2075
- 1,124,592 · -32.9%
- By 2100
- 881,193 · -47.4%
Race, ethnicity, and origin ACS 2023
- Neighborhood character
- Predominantly Black (85%)
- Race & ethnicity
- Black 85% White 8% Two or more races 4% Asian 1%
- Common ancestry
- Romanian 1% Lithuanian 1%
- Foreign-born
- 2% · Canada
- Languages at home
- 97% English-only · Spanish 1% Other Indo-European 1%
Political lean MEDSL · Wayne
- 2024 margin
- Strong D (+29.0) · D 62.7% · R 33.7% · Other 3.6%
- 2008→2024 swing
- -20.5pp toward R · 2008: 49.5pp · 2024: 29.0pp
- All cycles
- 2024: D+29.0 2020: D+38.1 2016: D+37.3 2012: D+46.9 2008: D+49.5
Not yet ingested
- Civics
- —
Market trends
- HPI YoY
- ▼ -433.14%
- Current HPI
- 280.5434
- Rent YoY
- ▲ 3.44%
- Metro
- Detroit-Warren-Dearborn, MI
- State GDP YoY
- ▲ 1.37%
- F500 in state
- 28
Industry mix (Fortune 500 HQ in MI)
| Industry | F500 HQs | Revenue |
|---|---|---|
| Automotive Parts | 3 | $48B |
|
||
| Automotive | 2 | $372B |
|
||
| Chemicals | 1 | $45B |
|
||
| Automotive Retail | 1 | $29B |
|
||
| Healthcare / Medical Devices | 1 | $23B |
|
||
| Automotive Technology | 1 | $20B |
|
||
Price history
-59.2% since first listed13 events — show timeline
- 2026-04-17 Pending — MiRealSource-MiMLS
- 2026-04-17 Pending — REALCOMP
- 2026-04-15 Listed $44,900 REALCOMP
- 2026-04-15 Listed $44,900 MiRealSource-MiMLS
- 2024-02-04 Rental Removed $1,100 BUILDIUM
- 2024-01-01 Price Changed $1,100 BUILDIUM
- 2023-12-13 Price Changed $1,200 BUILDIUM
- 2023-10-20 Listed for Rent $1,300 BUILDIUM
- 2006-11-06 Sold (Public Records) $110,000 Public Records
- 2004-06-30 Listing Removed — REALCOMP
- 2003-12-30 Listed $95,000 REALCOMP
- 2003-02-26 Listing Removed — REALCOMP
- 2002-08-27 Listed $110,000 REALCOMP
Property tax history
+0.8%/yrLatest (2025): $1,267 · -9.0% YoY. Source: county tax records.
Cash-flow waterfall
monthlySold comps — $/sqft
last 12 mo · ≤1 miLoading sold comps…