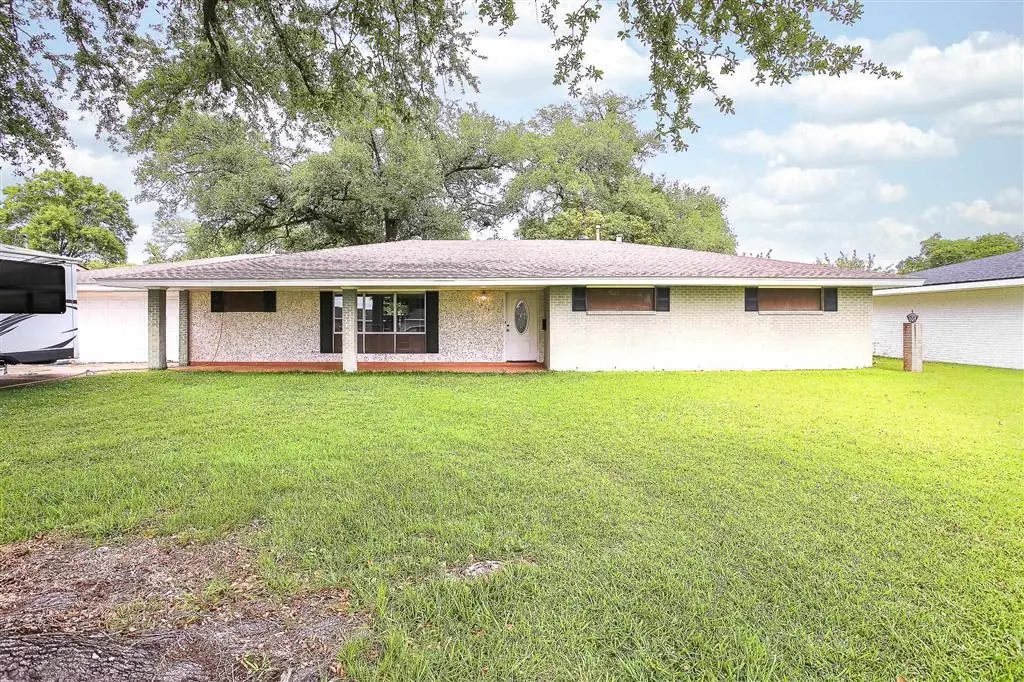
1314 Jefferson Dr · Lake Charles, LA
Flood risk 4/10 · Minor
- FEMA flood zone
- X (shaded)
- Chance of flooding over 30 yrs
- 0.22%
- Est. flood insurance / yr
- $507 – $1,088
Fire risk 1/10 · Minimal
- Est. fire insurance / yr
- $1,269 – $2,357
Heat risk 9/10 · Severe
- Hot days now (above 109°F)
- 7 days/yr
- Hot days in 30 yrs
- 21 days/yr
Wind risk 9/10 · Severe
- Chance of severe wind over 30 yrs
- 99.0%
Air-quality risk 2/10 · Minimal
- Unhealthy air days now
- 1 days/yr
- Unhealthy air days in 30 yrs
- 1 days/yr
Risk factors via First Street. Map © Google.
Why this score? — see what drove the D grade
The composite is a weighted blend of 9 inputs, each scored 0–100. Each bar is that input's sub-score; the figure is the points it added to the 100-point composite (weight × sub-score).
- Cash flow +18.2/30.0
- DSCR +5.7/10.0
- Rent growth +5.0/5.0
- 1% rule +3.9/10.0
- Livability +3.4/5.0
- Schools +3.1/10.0
- Condition / age +2.5/5.0
- ARV discount +1.5/15.0
- Appreciation +0.0/10.0
$224,900
🖨 Deal sheet (PDF) 📄 Offer letter ✓ Due diligence
Listing remarks
Located in University subdivision this 4-bedroom, 3-bath brick home is conveniently located in the center of town offering space and convenience. This property features a 5-year-old roof and is located in Flood Zone X (No flood insurance required). Inside, you'll find a spacious layout with generous living areas and plenty of natural light. The home sits on a large yard, ideal for outdoor entertaining, gardening, or simply enjoying extra space. The outdoor area includes a greenhouse integrated into the yard along with a producing lime tree perfect for gardening enthusiasts or anyone looking to enjoy fresh homegrown fruit. This property combines space, functionality, and outdoor appeal in a
Key facts
- 5 year old roof
- Large yard
- Producing lime tree
Tags
Property features AI
Exterior
- Parking: Driveway; Open parking available
- Utilities: Public water; Public sewer; Electricity connected; Natural gas connected; Cable connected; Water connected; Sewer connected
- Home design: Single-family residence; One story; House structure; Residential zoning
- Construction: Brick construction; Shingle roof; Slab foundation; Built as a single-story house
- Exterior features: Chain link fenced yard; Fenced property; Greenhouse on the property; Sidewalks in the community
Interior
- Bedrooms: Four main-level bedrooms
- Bathrooms: Three full bathrooms (all on the main level)
- Heating & cooling: Central heating; Central air conditioning
- Interior features: No fireplace
Neighborhood map
What this means for you Summary
Snapshot
- This is a 4-bed/3.0-bath single-family listed at $225k.
Deal economics
- At list price, monthly cash flow is $201 ($2k/yr) — positive.
- The deal already cash-flows at list — no discount required.
- To meet the 1% rule (rent ≥ 1% of price), the offer needs to be $201k (10.7% below list).
- Recommended offer: $201k (10.7% below list) — sets the bar for 1% rule.
- Cap rate 7.4% vs local median 4.3% in Lake Charles — top-decile yield for the area; either an underpriced asset or a hidden risk that comps aren't pricing in. Stress-test before assuming the spread holds.
Location & tenants
- Location reads 68/100 on livability (#95 in LA) — a middle-class / working-renter tenant base. Strengths: commute A+, cost of living A+, housing A+; Watch: crime F, amenities F, employment D-.
- Calcasieu Parish (other): math 30% / reading 44% proficiency, ranked #29 of 98 in LA (top 30%) — families likely to look elsewhere, expect single-tenant / working-renter base with shorter leases.
- Zoned schools: A. A. Nelson Elementary School (math 36% / reading 52%, grade F, #191 of 646 statewide, top 30%, 741 students, 55% FRL); F. K. White Middle School (math 26% / reading 39%, grade F, #104 of 218 statewide, top 48%, 661 students, 67% FRL); Alfred M. Barbe High School (math 41% / reading 56%, grade D, #41 of 265 statewide, top 16%, 1,991 students, 41% FRL) — zoned schools at 54% FRL track the district average.
- Market conditions: Rents rising fast (+15.1%/yr); 464 active listings in the ZIP; 5 comparable units currently listed for rent nearby; rentals lingering (median 46d on market — plan ~5-8 weeks vacancy on turnover, expect pricing pressure); 60% of comp listings sitting > 30 days — soft ceiling on asking rent; solid renter incomes; 1,298 units permitted in Calcasieu Parish in 2024 (526 in 5+ unit buildings).
Forward outlook
- Local home prices are declining (-3.0%/yr); year-one equity from $2k of loan paydown is wiped out by about $7k of value loss. Plan a longer hold.
- Calcasieu County population projected at +11% by 2050 — modest demand growth; plan on rents tracking national, not racing it.
- At projected returns (-3.0% appreciation + 8.0% rent growth), your $63k cash investment doubles in ~10 years — after that, you're playing with house money.
Negotiation context
- It's been on market 61 days — a 6% lower offer ($211k) is reasonable based on typical stale-listing flexibility.
- Current owner paid $135k; list at $225k implies a 67% gain — meaningful room to come down on a strong offer.
Risks & watch-outs
- Climate carrying-cost: severe wind risk, 99% chance of damaging wind over 30y; extreme-heat days projected 7→21/yr by 2055 (HVAC capex compounding) — expect insurance premiums to compound above CPI over the hold.
Questions for the listing agent
- It's been on market 61 days. Have you received any prior offers? Is the seller open to a 11% concession, seller financing, or rate buy-down credit?
- Built in 1976 — when were the roof, HVAC, electrical panel, plumbing, and water heater last replaced?
- Why hasn't it sold? Are there any deal-killer items the seller is aware of (foundation, flood, title, zoning, code violations)?
- Is there a deadline driving the sale (1031 exchange, divorce, estate, relocation)? That informs how much negotiation room exists.
- Schools are B-rated — typically a magnet for longer-tenancy family renters. What's the average tenant stay here, and is there a school-zone premium baked into asking?
- Crime grade is F in this area — have there been break-ins, vandalism, or insurance claims at this property in the last 3 years? What carrier currently insures it and at what premium?
- The area grade is low — what's the realistic commute time and amenity access for the typical tenant pool here? Any planned neighborhood developments (good or bad) we should know about?
- What's the average days-on-market for RENTAL listings here right now (not sales)? A rising rental-DOM trend means longer vacancies and softer asking-rent achievability than the comps imply.
- What's the recent tenant-quality profile in this submarket — average credit score on applications, eviction rate, late-payment / NSF rate, and stable-employment percentage? A property-management company in the area should have these aggregated.
- How much new for-sale + rental construction is in the pipeline within 1–3 miles? Heavy new supply typically softens prices + rents 12–24 months out; constrained supply supports both.
Investment metrics
- 1% rule
- 0.89% ✗
- Cap rate
- 7.37%
- Cash-on-cash
- 3.84%
- DSCR
- 1.17
- GRM
- 9.3
CMA / ARV
- ARV (median comp)
- $198,390
- List price
- $224,900
- Delta
- 13.36%
- Verdict
- OVERPRICED
- Comps
- 20 within 1.0 mi
Show comp detail 12 sales within ~0.75 mi
| Address | Dist | Beds/Ba | Sqft | Sold | Price | $/sf | Match |
|---|---|---|---|---|---|---|---|
| 4308 Dean St | 0.38mi | 3/2.0 (-1) | 2,260 (+0%) | 3mo | $235,000 | $104 | 70 |
| 4304 Sarver St | 0.47mi | 4/3.0 | 2,142 (-5%) | 4mo | $223,400 | $104 | 67 |
| 4119 Pleasant Dr | 0.60mi | 3/2.0 (-1) | 2,240 (-0%) | 3mo | $195,000 | $87 | 60 |
| 929 Carondelet St St | 0.63mi | 3/2.5 (-1) | 2,338 (+4%) | 1mo | $365,000 | $156 | 56 |
| 4315 Oaklawn | 0.48mi | 4/3.0 | 1,972 (-12%) | 2mo | $239,000 | $121 | 55 |
| 445 Washington | 0.69mi | 4/2.0 | 2,177 (-3%) | 3mo | $189,000 | $87 | 55 |
| 4022 Wooded Dr | 0.74mi | 3/2.0 (-1) | 2,244 (-0%) | 1mo | $85,000 | $38 | 55 |
| 1407 Jefferson Dr | 0.22mi | 3/2.0 (-1) | 1,946 (-14%) | 4mo | $260,000 | $134 | 55 |
| 4410 Dean St St | 0.30mi | 3/2.0 (-1) | 1,931 (-14%) | 1mo | $172,500 | $89 | 52 |
| 1220 Five Oaks Dr | 0.61mi | 3/2.5 (-1) | 2,425 (+8%) | 3mo | $490,000 | $202 | 49 |
| 625 Archwood St | 0.71mi | 4/2.5 | 2,458 (+9%) | 3mo | $392,500 | $160 | 47 |
| 4307 Oaklawn St | 0.50mi | 3/2.0 (-1) | 1,926 (-14%) | 2mo | $157,900 | $82 | 42 |
Match score weights: distance 35% · size 25% · config 20% · recency 20%. Top-matched comps best support the ARV.
Projected returns pro-forma
-3.0% appreciation · 8.0% rent growth · sell at horizon
- IRR
- -5.3%
- Equity multiple
- 0.79×
- Total profit
- $-13,077
- Equity at exit
- $33,533
- IRR
- 9.1%
- Equity multiple
- 1.84×
- Total profit
- $53,127
- Equity at exit
- $19,445
Cash invested: $62,972 (down + closing). Projections, not guarantees.
Landlord ↔ Tenant lean methodology
- Overall (STATE)
- 90 Strongly Landlord-Friendly
- State Louisiana
- 90 Strongly Landlord-Friendly · R+12
- County
- — inherits STATE
- City
- — inherits STATE
ZIP-level market 70605
- Rents YoY
- 15.1%
- Active inventory
- 464
- Price-to-rent
- 9.3×
Monthly cashflow live
- Estimated rent
- $2,008 medium interval (Pro) →
- Mortgage (P&I)
- −$1,179
- Tax from tax record
- −$112 /mo · $1,339/yr
- Insurance
- −$94
- HOA
- −$0
- Lot rent
- −$0
- Vacancy / Maint / Mgmt
- −$422
- Net cashflow
- $201
Break-even live
Sensitivity live
| Price | -10% $329 | -5% $265 | +0% $201 | +5% $138 | +10% $74 |
|---|---|---|---|---|---|
| Rent | -10% $43 | -5% $122 | +0% $201 | +5% $281 | +10% $360 |
| Rate | -1.0pp $315 | -0.5pp $259 | base $201 | +0.5pp $143 | +1.0pp $84 |
UW: 25.0% down · 7.5% · 30yr · 1.5% tax · 5.0% vac · 8.0% maint · 8.0% mgmt
Financing live
Cash to close
- Down payment
- $56,225
- Closing costs
- $6,747
- Reserves months
- —
- Total cash needed
- —
Loan-product check · same deal, 3 products live
Conventional
25% down · 7.5% · 30yr
- Down + closing
- —
- Monthly P&I
- —
- Monthly cashflow
- —
- DSCR
- —
- Eligible?
- —
Personal DTI + credit; lowest rate.
DSCR
20% down · 8.5% · 30yr
- Down + closing
- —
- Monthly P&I
- —
- Monthly cashflow
- —
- DSCR
- —
- Eligible?
- —
No personal income docs; deal must DSCR.
Hard money
10% down · 12.0% · 12mo
- Down + closing
- —
- Monthly P&I
- —
- Monthly cashflow
- —
- DSCR
- —
- Eligible?
- —
Short-term bridge; refi at stabilization.
Rent comps 5 comps
| Address | Beds | Baths | Sqft | Rent | $/sqft | DOM | Units | Dist |
|---|---|---|---|---|---|---|---|---|
| 716 Dianne Ln Lake Charles, LA | 3.0 | 2.0 | 2200 | $5,000 | $2.27 | 46d | 1 | 0.82mi |
| 4326 Christina St Lake Charles, LA | 3.0 | 2.0 | 1600 | $1,770 | $1.11 | 23d | 1 | 0.88mi |
| 1549 L'Acadie Dr Lake Charles, LA | 4.0 | 4.0 | 3100 | $3,550 | $1.15 | 15d | 1 | 1.06mi |
| 4128 Center St Lake Charles, LA | 4.0 | 2.0 | 2227 | $1,500 | $0.67 | 46d | 1 | 1.16mi |
| 417 E Claude St Lake Charles, LA | 4.0 | 1.0 | 1610 | $1,400 | $0.87 | 46d | 1 | 1.29mi |
Listing history 23 events
-
2026-06-23days on market $224,900 Active 61 DOM
-
2026-06-21days on market $224,900 Active 60 DOM
-
2026-06-19days on market $224,900 Active 58 DOM
-
2026-06-18days on market $224,900 Active 57 DOM
-
2026-06-17days on market $224,900 Active 56 DOM
-
2026-06-16days on market $224,900 Active 55 DOM
-
2026-06-15days on market $224,900 Active 54 DOM
-
2026-06-14days on market $224,900 Active 52 DOM
-
2026-06-13days on market $224,900 Active 51 DOM
-
2026-06-10days on market $224,900 Active 49 DOM
-
2026-06-09days on market $224,900 Active 48 DOM
-
2026-06-08days on market $224,900 Active 47 DOM
-
2026-06-07days on market $224,900 Active 46 DOM
-
2026-06-05days on market $224,900 Active 43 DOM
-
2026-06-02days on market $224,900 Active 41 DOM
-
2026-06-01days on market $224,900 Active 40 DOM
-
2026-05-31days on market $224,900 Active 39 DOM
-
2026-05-30days on market $224,900 Active 38 DOM
-
2026-04-22$224,900 Active 746-char remark
-
2025-01-27soldstatus $135,000
-
2011-10-07soldstatus $160,000
-
2004-10-04soldstatus $136,000
-
1999-03-31soldstatus $68,000
ⓘ Source: listings_history table (triggers on properties + properties_extension) + one-shot
backfill from property_details.listing_events for pre-trigger history.
Tax reassessment forecast LA · Resets to sale price
- Current annual tax
- $1,339 · $112/mo
- Projected year-2 tax
- $1,339 · $112/mo
- Expected delta
- $0/yr ($0/mo · 0.0%)
ⓘ Screening estimate from a state-policy table — verify with the county assessor before closing.
Climate risk First Street
- Flood 4/10 Moderate FEMA zone X (shaded) · 22% chance over 30 yrs
- Wildfire 1/10 Low
- Heat 9/10 Extreme 7 d/yr ≥109°F today · 21 d/yr by 30 yrs out
- Wind 9/10 Extreme 99% chance of damaging wind over 30 yrs
- Air quality 2/10 Low 1 unhealthy d/yr today · 1 by 30 yrs out
Nearby sold comps map
Loading sold comps map…
Walkable amenities ~0.75 mi
Loading nearby amenities…
Taxation est. · year 1
- Rental income
- $24,093
- − Mortgage interest
- −$12,598
- − Property taxes
- −$1,339
- − Insurance
- −$1,124
- − Repairs & maintenance
- −$1,927
- − Management
- −$1,927
- − Depreciation
- −$6,543
- Taxable loss
- −$1,366
- Est. tax savings @ 24.0%
- +$328
- After-tax cash flow
- $2,745/yr
For passive investors: Depreciation is non-cash, so a rental often shows a tax loss while cash-flowing — sheltering income. Rental losses are passive: they offset passive income freely, and up to $25,000/yr can offset ordinary (W-2) income if you actively participate and your MAGI is under $100k (phasing out to $0 by $150k); unused losses carry forward. On sale, claimed depreciation is recaptured at up to 25%, and gains may owe capital-gains tax (a 1031 exchange can defer both). Figures are a year-1 estimate at your 24.0% rate — not tax advice; consult a CPA.
Schools (NCES district)
- District
- Calcasieu Parish
- NCES district ID
- 2200330
- Math proficiency
- 30% ▼ -39.00%
- Reading proficiency
- 44% ▼ -33.00%
- Median HH income
- $44,700
- Composite
- 31.45/100
- National rank
- #5979
- State rank
- #29 of 98 in LA
Livability — Lake Charles
- Score
- 68/100
- State rank
- #95
- US rank
- #9820
Category grades
Schools grade is shown separately in the Schools card above.
Census & demographics
- Census place
- Lake Charles, LA
- County
- Calcasieu Parish · 170,889 people
- City population
- 133,538
- Metro
- Lake Charles, LA
- Population (ZIP)
- 40,482
- Household income
- $86,015
- Rent vs Own
- Severe rent burden
- 1328.0
Population outlook (Calcasieu County) Hauer SSP2
- Today (2025)
- 212,179 people
- By 2030
- 218,199 · +2.8%
- By 2040
- 228,486 · +7.7%
- By 2050
- 236,208 · +11.3%
- By 2075
- 251,696 · +18.6%
- By 2100
- 247,848 · +16.8%
Race, ethnicity, and origin ACS 2023
- Neighborhood character
- Predominantly White (79%)
- Race & ethnicity
- White 79% Black 10% Hispanic / Latino 6% Two or more races 6% Asian 3%
- Hispanic origin (detail)
- Mexican 2%
- Common ancestry
- Lithuanian 12% Italian 3% Slovak 2%
- Foreign-born
- 6% · Canada, Jamaica
- Languages at home
- 92% English-only · Spanish 4% Other Indo-European 2% Other Asian/Pacific 1%
Political lean MEDSL · Calcasieu
- 2024 margin
- Solid R (+39.6) · D 29.5% · R 69.0% · Other 1.5%
- 2008→2024 swing
- -15.0pp toward R · 2008: -24.6pp · 2024: -39.6pp
- All cycles
- 2024: R+39.6 2020: R+35.2 2016: R+33.3 2012: R+28.7 2008: R+24.6
Not yet ingested
- Civics
- —
Market trends
- HPI YoY
- ▼ -102.68%
- Current HPI
- 105.1903
- Rent YoY
- ▲ 15.10%
- Metro
- Lake Charles, LA
- State GDP YoY
- ▲ 3.29%
- F500 in state
- 10
Industry mix (Fortune 500 HQ in LA)
| Industry | F500 HQs | Revenue |
|---|---|---|
| Telecommunications | 2 | $23B |
|
||
| Utilities | 1 | $12B |
|
||
| Wholesale / Distribution | 1 | $5B |
|
||
| Advertising | 1 | $2B |
|
||
Price history
+230.7% since first listed5 events — show timeline
- 2026-04-22 Listed $224,900 SWLAR
- 2025-01-27 Sold (Public Records) $135,000 Public Records
- 2011-10-07 Sold (Public Records) $160,000 Public Records
- 2004-10-04 Sold (Public Records) $136,000 Public Records
- 1999-03-31 Sold (Public Records) $68,000 Public Records
Property tax history
-0.0%/yrLatest (2025): $1,339 · +2.4% YoY. Source: county tax records.
Cash-flow waterfall
monthlySold comps — $/sqft
last 12 mo · ≤1 miLoading sold comps…