315 Oakstone Dr · Maggie Valley, NC
Flood risk 1/10 · Minimal
- FEMA flood zone
- X (unshaded)
- Chance of flooding over 30 yrs
- 0.0%
- Est. flood insurance / yr
- $473 – $860
Fire risk 4/10 · Minor
- Est. fire insurance / yr
- $906 – $1,684
Heat risk 2/10 · Minimal
- Hot days now (above 92°F)
- 9 days/yr
- Hot days in 30 yrs
- 26 days/yr
Wind risk 2/10 · Minimal
- Chance of severe wind over 30 yrs
- —
Air-quality risk 3/10 · Minor
- Unhealthy air days now
- 2 days/yr
- Unhealthy air days in 30 yrs
- 2 days/yr
Risk factors via First Street. Map © Google.
Why this score? — see what drove the D grade
The composite is a weighted blend of 9 inputs, each scored 0–100. Each bar is that input's sub-score; the figure is the points it added to the 100-point composite (weight × sub-score).
- Cash flow +14.6/30.0
- ARV discount +7.5/15.0
- DSCR +4.5/10.0
- Schools +4.5/10.0
- 1% rule +2.9/10.0
- Livability +2.6/5.0
- Rent growth +2.5/5.0
- Condition / age +2.5/5.0
- Appreciation +0.0/10.0
$210,000
🖨 Deal sheet (PDF) 📄 Offer letter ✓ Due diligence
Listing remarks MLS
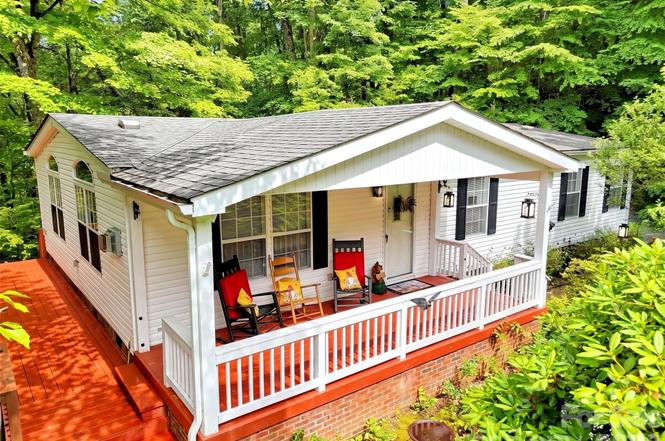
End of the road privacy, nicely landscaped paved year round access and plenty of parking are only a few of the many things you will love about this well cared for doublewide. Updated kitchen, 3 bedrooms, 2 updated bathrooms and plenty of natural light throughout the house. Outbuilding for your garden tools, decks to enjoy outdoor entertaining and a firepit for those cool fall evenings. Priced to sell make your appointment today. High Speed Cable internet is available at this location.
Key facts
- Covered front porch
- Large back deck
- Firepit
Tags
Property features AI
Finance
- Other: Road maintained via road maintenance agreement; Lot size approximately 0.71 acre; Elevation approximately 2,500 ft; Directions: From Waynesville to 276 Jonathan Creek Road left onto Hemphill Road. Just past Ned Cove Road left onto Oakstone Drive to last house on the left.
- Financial info: No investor or multifamily income/expense details
- HOA & community: No HOA dues
Exterior
- Parking: Driveway parking; Three open parking spaces
- Security: No specific security features listed
- Utilities: Shared well water; Septic system installed; Propane available; Cable available
- Home design: Manufactured doublewide single-family residence; One level; Completed development; R1 zoning
- Construction: Manufactured construction; Vinyl exterior; Composition roof; Foundation: other (see remarks); Built by Fleetwood Homes
- Exterior features: Covered rear porch; Deck; Front porch; Storage; Outbuilding; Private, wooded lot; Fire pit
Interior
- Kitchen: Dishwasher; Electric range; Refrigerator; Kitchen island; Pantry
- Bedrooms: Three bedrooms on the main level
- Flooring: Carpet; Vinyl
- Bathrooms: Two full bathrooms on the main level
- Heating & cooling: Heat pump (heating and cooling); Ceiling fans; Other heating details (see remarks)
- Interior features: Kitchen island; Pantry; Walk-in closets; Fireplace in living room (gas vented); Fire pit
- Laundry & utility: Main-level laundry room; Washer; Dryer; Electric water heater
Neighborhood map
What this means for you Summary
Snapshot
- This is a 3-bed/2.0-bath manufactured listed at $210k.
Deal economics
- At list price, monthly cash flow is $52 ($621/yr) — positive.
- The deal already cash-flows at list — no discount required.
- To meet the 1% rule (rent ≥ 1% of price), the offer needs to be $166k (21.0% below list).
- Recommended offer: $166k (21.0% below list) — sets the bar for 1% rule.
- Cap rate 6.6% vs local median 2.3% in Maggie Valley — top-decile yield for the area; either an underpriced asset or a hidden risk that comps aren't pricing in. Stress-test before assuming the spread holds.
Location & tenants
- Location reads 51/100 on livability (#701 in NC) — a working-class tenant base; expect higher turnover. Strengths: housing A+, cost of living A; Watch: crime F, amenities F, commute F.
- Haywood County Schools (suburban): math 55% / reading 53% proficiency, ranked #50 of 178 in NC (top 28%) — acceptable for families but not a draw, mixed tenant base, ~2y average lease.
- Zoned schools: Jonathan Valley Elementary (math 52% / reading 47%, grade D, #417 of 1,410 statewide, top 32%, 378 students, 99% FRL); Waynesville Middle (math 49% / reading 54%, grade C, #103 of 475 statewide, top 22%, 720 students, 62% FRL); Tuscola High (math 57% / reading 60%, grade C, #235 of 535 statewide, top 45%, 917 students, 49% FRL) — zoned schools average 70% FRL vs 49% district-wide (21 pts higher); higher-poverty schools than district average — tighter screening recommended.
- Market conditions: 287 active listings in the ZIP; 537 units permitted in Haywood County in 2024 (150 in 5+ unit buildings).
Forward outlook
- Local home prices are declining (-3.0%/yr); year-one equity from $1k of loan paydown is wiped out by about $6k of value loss. Plan a longer hold.
Negotiation context
- Only 3 days on market — expect competitive offers; lowballing is unlikely to land.
- Current owner paid $165k; 27% above their basis — modest negotiation headroom, anchor on the comps not their cost.
Questions for the listing agent
- Is there a deadline driving the sale (1031 exchange, divorce, estate, relocation)? That informs how much negotiation room exists.
- Schools are D-rated, which usually means shorter tenancies and higher turnover. Who's the typical renter profile here, and what's been the actual vacancy rate?
- Crime grade is F in this area — have there been break-ins, vandalism, or insurance claims at this property in the last 3 years? What carrier currently insures it and at what premium?
- The area grade is low — what's the realistic commute time and amenity access for the typical tenant pool here? Any planned neighborhood developments (good or bad) we should know about?
- What's the average days-on-market for RENTAL listings here right now (not sales)? A rising rental-DOM trend means longer vacancies and softer asking-rent achievability than the comps imply.
- What's the recent tenant-quality profile in this submarket — average credit score on applications, eviction rate, late-payment / NSF rate, and stable-employment percentage? A property-management company in the area should have these aggregated.
- How much new for-sale + rental construction is in the pipeline within 1–3 miles? Heavy new supply typically softens prices + rents 12–24 months out; constrained supply supports both.
Investment metrics
- 1% rule
- 0.79% ✗
- Cap rate
- 6.59%
- Cash-on-cash
- 1.06%
- DSCR
- 1.05
- GRM
- 10.5
CMA / ARV
No comps found within radius.
Projected returns pro-forma
-3.0% appreciation · 3.0% rent growth · sell at horizon
- IRR
- -14.7%
- Equity multiple
- 0.48×
- Total profit
- $-30,826
- Equity at exit
- $31,312
- IRR
- -6.1%
- Equity multiple
- 0.61×
- Total profit
- $-22,977
- Equity at exit
- $18,157
Cash invested: $58,800 (down + closing). Projections, not guarantees.
Landlord ↔ Tenant lean methodology
- Overall (STATE)
- 85 Strongly Landlord-Friendly
- State North Carolina
- 85 Strongly Landlord-Friendly · R+3
- County
- — inherits STATE
- City
- — inherits STATE
ZIP-level market 28785
- Home prices YoY
- -19.4%
- Active inventory
- 287
- Price-to-rent
- 10.5×
Monthly cashflow live
- Estimated rent
- $1,660 medium interval (Pro) →
- Mortgage (P&I)
- −$1,101
- Tax from tax record
- −$71 /mo · $849/yr
- Insurance
- −$88
- HOA
- −$0
- Vacancy / Maint / Mgmt
- −$349
- Net cashflow
- $52
Break-even live
Sensitivity live
| Price | -10% $171 | -5% $111 | +0% $52 | +5% $-8 | +10% $-67 |
|---|---|---|---|---|---|
| Rent | -10% $-79 | -5% $-14 | +0% $52 | +5% $117 | +10% $183 |
| Rate | -1.0pp $157 | -0.5pp $105 | base $52 | +0.5pp $-3 | +1.0pp $-58 |
UW: 25.0% down · 7.5% · 30yr · 1.5% tax · 5.0% vac · 8.0% maint · 8.0% mgmt
Financing live
Cash to close
- Down payment
- $52,500
- Closing costs
- $6,300
- Reserves months
- —
- Total cash needed
- —
Loan-product check · same deal, 3 products live
Conventional
25% down · 7.5% · 30yr
- Down + closing
- —
- Monthly P&I
- —
- Monthly cashflow
- —
- DSCR
- —
- Eligible?
- —
Personal DTI + credit; lowest rate.
DSCR
20% down · 8.5% · 30yr
- Down + closing
- —
- Monthly P&I
- —
- Monthly cashflow
- —
- DSCR
- —
- Eligible?
- —
No personal income docs; deal must DSCR.
Hard money
10% down · 12.0% · 12mo
- Down + closing
- —
- Monthly P&I
- —
- Monthly cashflow
- —
- DSCR
- —
- Eligible?
- —
Short-term bridge; refi at stabilization.
Listing history 3 events
-
2026-06-22statusdays on market $210,000 Active 3 DOM
-
2026-06-17remarks 699-char remark
-
2026-06-17$210,000 Coming Soon 1 DOM
ⓘ Source: listings_history table (triggers on properties + properties_extension) + one-shot
backfill from property_details.listing_events for pre-trigger history.
Tax reassessment forecast NC · Resets to sale price
- Current annual tax
- $849 · $71/mo
- Projected year-2 tax
- $1,722 · $144/mo
- Expected delta
- +$873/yr (+$73/mo · 102.9%)
ⓘ Screening estimate from a state-policy table — verify with the county assessor before closing.
Climate risk First Street
- Flood 1/10 Low FEMA zone X (unshaded) · 0% chance over 30 yrs
- Wildfire 4/10 Moderate
- Heat 2/10 Low 9 d/yr ≥92°F today · 26 d/yr by 30 yrs out
- Wind 2/10 Low
- Air quality 3/10 Moderate 2 unhealthy d/yr today · 2 by 30 yrs out
Nearby sold comps map
Loading sold comps map…
Walkable amenities ~0.75 mi
Loading nearby amenities…
Taxation est. · year 1
- Rental income
- $19,917
- − Mortgage interest
- −$11,763
- − Property taxes
- −$849
- − Insurance
- −$1,050
- − Repairs & maintenance
- −$1,593
- − Management
- −$1,593
- − Depreciation
- −$6,109
- Taxable loss
- −$3,040
- Est. tax savings @ 24.0%
- +$730
- After-tax cash flow
- $1,351/yr
For passive investors: Depreciation is non-cash, so a rental often shows a tax loss while cash-flowing — sheltering income. Rental losses are passive: they offset passive income freely, and up to $25,000/yr can offset ordinary (W-2) income if you actively participate and your MAGI is under $100k (phasing out to $0 by $150k); unused losses carry forward. On sale, claimed depreciation is recaptured at up to 25%, and gains may owe capital-gains tax (a 1031 exchange can defer both). Figures are a year-1 estimate at your 24.0% rate — not tax advice; consult a CPA.
Schools (NCES district)
- District
- Haywood County Schools
- NCES district ID
- 3702040
- Math proficiency
- 55% ▲ 7.00%
- Reading proficiency
- 53% ▲ 2.00%
- Median HH income
- $42,715
- Composite
- 45.42/100
- National rank
- #2623
- State rank
- #50 of 178 in NC
Livability — Maggie Valley
- Score
- 51/100
- State rank
- #701
- US rank
- #25374
Category grades
Schools grade is shown separately in the Schools card above.
Census & demographics
- Population (ZIP)
- 8,619
Population outlook (Haywood County) Hauer SSP2
- Today (2025)
- 61,607 people
- By 2030
- 62,137 · +0.9%
- By 2040
- 62,418 · +1.3%
- By 2050
- 61,578 · +-0.0%
- By 2075
- 59,137 · -4.0%
- By 2100
- 53,470 · -13.2%
Race, ethnicity, and origin ACS 2023
- Neighborhood character
- Predominantly White (94%)
- Race & ethnicity
- White 94% Two or more races 4% Hispanic / Latino 3%
- Common ancestry
- Serbian 10% Slovak 7% Italian 6%
- Foreign-born
- 2% · Canada
- Languages at home
- 97% English-only · Spanish 2% Other Indo-European 1%
Political lean MEDSL · Haywood
- 2024 margin
- Strong R (+25.1) · D 36.9% · R 62.0% · Other 1.1%
- 2008→2024 swing
- -17.4pp toward R · 2008: -7.8pp · 2024: -25.1pp
- All cycles
- 2024: R+25.1 2020: R+26.5 2016: R+28.0 2012: R+13.8 2008: R+7.8
Not yet ingested
- Civics
- —
Market trends
- HPI YoY
- ▼ -48.83%
- Current HPI
- 202.6632
- Rent YoY
- —
- Metro
- —
- State GDP YoY
- ▲ 3.28%
- F500 in state
- 26
Industry mix (Fortune 500 HQ in NC)
| Industry | F500 HQs | Revenue |
|---|---|---|
| Financial Services | 2 | $213B |
|
||
| Retail | 2 | $95B |
|
||
| Industrial Conglomerate | 1 | $38B |
|
||
| Metals / Steel | 1 | $35B |
|
||
| Utilities | 1 | $30B |
|
||
| Industrial Machinery | 1 | $19B |
|
||
Price history
+133.3% since first listed7 events — show timeline
- 2026-06-17 Coming Soon $210,000 CANOPYMLS as Distributed by MLS Grid
- 2020-09-29 Sold (Public Records) $165,000 Public Records
- 2020-09-29 Sold (MLS) $165,000 CANOPYMLS as Distributed by MLS Grid
- 2020-08-30 Contingent — CANOPYMLS as Distributed by MLS Grid
- 2020-08-19 Listed $158,900 CANOPYMLS as Distributed by MLS Grid
- 2007-08-28 Sold (Public Records) $108,000 Public Records
- 2004-06-15 Sold (Public Records) $90,000 Public Records
Property tax history
+2.0%/yrLatest (2025): $849 · -4.7% YoY. Source: county tax records.
Cash-flow waterfall
monthlySold comps — $/sqft
last 12 mo · ≤1 miLoading sold comps…