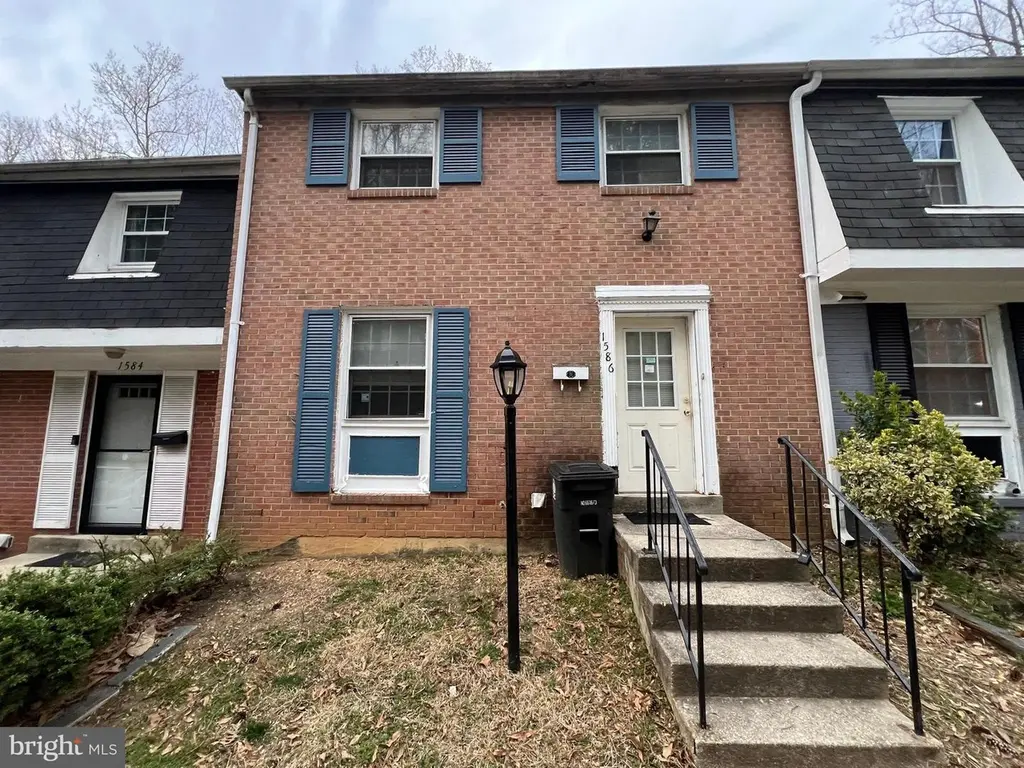
1586 Potomac Heights Dr #231 · Oxon Hill, MD
Flood risk 1/10 · Minimal
- FEMA flood zone
- X (unshaded)
- Chance of flooding over 30 yrs
- 0.0%
- Est. flood insurance / yr
- $507 – $1,088
Fire risk 4/10 · Minor
- Est. fire insurance / yr
- $755 – $1,403
Heat risk 8/10 · Major
- Hot days now (above 103°F)
- 7 days/yr
- Hot days in 30 yrs
- 16 days/yr
Wind risk 4/10 · Minor
- Chance of severe wind over 30 yrs
- 21.0%
Air-quality risk 3/10 · Minor
- Unhealthy air days now
- 2 days/yr
- Unhealthy air days in 30 yrs
- 3 days/yr
Risk factors via First Street. Map © Google.
Why this score? — see what drove the D+ grade
The composite is a weighted blend of 9 inputs, each scored 0–100. Each bar is that input's sub-score; the figure is the points it added to the 100-point composite (weight × sub-score).
- ARV discount +15.0/15.0
- Cash flow +14.1/30.0
- 1% rule +5.4/10.0
- DSCR +4.3/10.0
- Rent growth +3.3/5.0
- Livability +3.1/5.0
- Condition / age +2.5/5.0
- Schools +1.7/10.0
- Appreciation +0.0/10.0
$249,900
🖨 Deal sheet 📄 Offer letter ✓ Due diligence
Listing remarks MLS
INVESTOR SPECIAL! This charming towhouse in highly sought after Fort Washington offers tons of potential with a main level featuring a living room, kitchen and dining room. Upstairs features three large bedrooms and 2 full bathrooms. The full-footprint tall basement with 1 full bathroom presents endless possibilities and space to increase your rental or resale value. This property is ideally situated near major highways, dining, and shopping, making it a top contender for a reliable long-term rental, as well as a profitable fix-and-flip. Investors will love the upside potential and the high demand for updated homes in this growing area. With the right vision, this home can become a standout asset in your portfolio. The property is being sold AS-IS, so move quickly. Opportunities like this don’t last long! * * * SELLERS PREFER SANCTUARY TITLE FOR CLOSING * * *
Key facts
- $290 HOA
- Community pool
- Built 1973
Neighborhood map
What this means for you Summary
Snapshot
- This is a 3-bed/3.0-bath townhouse listed at $250k.
Deal economics
- At list price, monthly cash flow is $35 ($418/yr) — positive.
- The deal already cash-flows at list — no discount required.
- Meets the 1% rule at list price ($3k rent vs $250k).
- Recommended offer: $235k (6.0% below list) — sets the bar for market timing.
- Cap rate 6.5% vs local median 4.5% in Oxon Hill — top-decile yield for the area; either an underpriced asset or a hidden risk that comps aren't pricing in. Stress-test before assuming the spread holds.
Location & tenants
- Location reads 62/100 on livability (#311 in MD) — a middle-class / working-renter tenant base. Strengths: employment A+, housing A+; Watch: cost of living D+, crime D, schools F.
- Prince George'S County Public Schools (suburban): math 8% / reading 24% proficiency, ranked #21 of 24 in MD (top 88%) — low school quality limits family demand, transient renter base, plan for 1-2y turnover.
- Market conditions: Rents rising (+3.1%/yr); 179 active listings in the ZIP; 5 comparable units currently listed for rent nearby; rentals lingering (median 44d on market — plan ~5-8 weeks vacancy on turnover, expect pricing pressure); 60% of comp listings sitting > 30 days — soft ceiling on asking rent; high-income renter base; 1,481 units permitted in Prince George's County in 2024 (0 in 5+ unit buildings).
Forward outlook
- Local home prices are declining (-3.0%/yr); year-one equity from $2k of loan paydown is wiped out by about $7k of value loss. Plan a longer hold.
- Prince George's County population projected at +18% by 2050 — long-run rental-demand tailwind backs the buy-and-hold thesis.
Negotiation context
- It's been on market 74 days — a 6% lower offer ($235k) is reasonable based on typical stale-listing flexibility.
- 2 sale attempts since 24y ago with the ask held roughly flat each time — persistent listings suggest the price (not the market) is what's stuck; bring a comps-based counter.
- Current owner paid $136k; list at $250k implies a 84% gain — meaningful room to come down on a strong offer.
Risks & watch-outs
- Climate carrying-cost: extreme-heat days projected 7→16/yr by 2055 (HVAC capex compounding) — expect insurance premiums to compound above CPI over the hold.
Questions for the listing agent
- It's been on market 74 days. Have you received any prior offers? Is the seller open to a 6% concession, seller financing, or rate buy-down credit?
- Built in 1973 — when were the roof, HVAC, electrical panel, plumbing, and water heater last replaced?
- What does the HOA fee cover, when was the last increase, and are there any pending special assessments or reserve-fund shortfalls?
- Why hasn't it sold? Are there any deal-killer items the seller is aware of (foundation, flood, title, zoning, code violations)?
- Is there a deadline driving the sale (1031 exchange, divorce, estate, relocation)? That informs how much negotiation room exists.
- Schools are F-rated, which usually means shorter tenancies and higher turnover. Who's the typical renter profile here, and what's been the actual vacancy rate?
- Crime grade is D in this area — have there been break-ins, vandalism, or insurance claims at this property in the last 3 years? What carrier currently insures it and at what premium?
- The area grade is low — what's the realistic commute time and amenity access for the typical tenant pool here? Any planned neighborhood developments (good or bad) we should know about?
- What's the average days-on-market for RENTAL listings here right now (not sales)? A rising rental-DOM trend means longer vacancies and softer asking-rent achievability than the comps imply.
- What's the recent tenant-quality profile in this submarket — average credit score on applications, eviction rate, late-payment / NSF rate, and stable-employment percentage? A property-management company in the area should have these aggregated.
- How much new for-sale + rental construction is in the pipeline within 1–3 miles? Heavy new supply typically softens prices + rents 12–24 months out; constrained supply supports both.
Investment metrics
- 1% rule
- 1.04% ✓
- Cap rate
- 6.46%
- Cash-on-cash
- 0.60%
- DSCR
- 1.03
- GRM
- 8.0
CMA / ARV
- ARV (on-the-fly)
- $344,575
- Comps found
- 12
Show comp detail 12 sales within ~0.75 mi
| Address | Dist | Beds/Ba | Sqft | Sold | Price | $/sf | Match |
|---|---|---|---|---|---|---|---|
| 1475 Potomac Heights Dr #241 | 0.06mi | 3/2.5 | 1,969 (0%) | 0mo | $315,000 | $160 | 95 |
| 1521 Potomac Heights Dr #273 | 0.08mi | 4/3.0 (+1) | 1,969 (0%) | 0mo | $342,500 | $174 | 91 |
| 1353 Potomac Heights Dr #54 | 0.14mi | 3/2.5 | 1,969 (0%) | 3mo | $350,000 | $178 | 89 |
| 1278 Palmer Rd #88 | 0.17mi | 4/3.0 (+1) | 1,969 (0%) | 1mo | $375,000 | $190 | 87 |
| 1470 Potomac Heights Dr #126 | 0.13mi | 4/3.0 (+1) | 1,969 (0%) | 4mo | $375,000 | $190 | 86 |
| 1540 Potomac Heights Dr #208 | 0.11mi | 4/3.0 (+1) | 1,969 (0%) | 7mo | $379,000 | $192 | 84 |
| 1518 Potomac Heights Dr #197 | 0.13mi | 4/2.5 (+1) | 1,969 (0%) | 7mo | $325,000 | $165 | 81 |
| 1342 Potomac Heights Dr #72 | 0.10mi | 4/3.0 (+1) | 1,969 (0%) | 14mo | $375,950 | $191 | 79 |
| 1486 Potomac Heights Dr #134 | 0.15mi | 4/3.0 (+1) | 1,969 (0%) | 14mo | $340,000 | $173 | 76 |
| 1212 Palmer Rd #121 | 0.25mi | 3/2.5 | 1,969 (0%) | 15mo | $345,000 | $175 | 74 |
| 1580 Potomac Heights Dr #228 | 0.02mi | 4/3.0 (+1) | 2,250 (+14%) | 3mo | $349,555 | $155 | 68 |
| 8875 Rusland Ct | 0.35mi | 3/2.0 | 1,940 (-2%) | 20mo | $300,280 | $155 | 60 |
Match score weights: distance 35% · size 25% · config 20% · recency 20%. Top-matched comps best support the ARV.
Projected returns pro-forma
-3.0% appreciation · 3.06% rent growth · sell at horizon
- IRR
- -15.2%
- Equity multiple
- 0.46×
- Total profit
- $-37,898
- Equity at exit
- $37,261
- IRR
- -6.3%
- Equity multiple
- 0.59×
- Total profit
- $-28,607
- Equity at exit
- $21,607
Cash invested: $69,972 (down + closing). Projections, not guarantees.
Landlord ↔ Tenant lean methodology
- Overall (STATE)
- 27 Tenant-Leaning
- State Maryland
- 27 Tenant-Leaning · D+14
- County
- — inherits STATE
- City
- — inherits STATE
ZIP-level market 20744
- Rents YoY
- 3.1%
- Active inventory
- 179
- Price-to-rent
- 8.0×
Monthly cashflow live
- Estimated rent
- $2,601 high interval (Pro) →
- Mortgage (P&I)
- −$1,311
- Tax from tax record
- −$315 /mo · $3,782/yr
- Insurance
- −$104
- HOA
- −$290
- Vacancy / Maint / Mgmt
- −$546
- Net cashflow
- $35
Break-even live
UW: 25.0% down · 7.5% · 30yr · 1.5% tax · 5.0% vac · 8.0% maint · 8.0% mgmt
Financing live
Cash to close
- Down payment
- $62,475
- Closing costs
- $7,497
- Reserves months
- —
- Total cash needed
- —
Loan-product check · same deal, 3 products live
Conventional
25% down · 7.5% · 30yr
- Down + closing
- —
- Monthly P&I
- —
- Monthly cashflow
- —
- DSCR
- —
- Eligible?
- —
Personal DTI + credit; lowest rate.
DSCR
20% down · 8.5% · 30yr
- Down + closing
- —
- Monthly P&I
- —
- Monthly cashflow
- —
- DSCR
- —
- Eligible?
- —
No personal income docs; deal must DSCR.
Hard money
10% down · 12.0% · 12mo
- Down + closing
- —
- Monthly P&I
- —
- Monthly cashflow
- —
- DSCR
- —
- Eligible?
- —
Short-term bridge; refi at stabilization.
Rent comps 5 comps
| Address | Beds | Baths | Sqft | Rent | $/sqft | DOM | Units | Dist |
|---|---|---|---|---|---|---|---|---|
| 1023 Spring Valley Ct Fort Washington, MD | 3.0 | 2.0 | 1470 | $2,500 | $1.70 | 43d | 1 | 0.21mi |
| 8102 Carey Branch Dr Fort Washington, MD | 3.0 | 2.5 | 2484 | $2,700 | $1.09 | 18d | 1 | 0.72mi |
| 9518 Blanchard Dr Fort Washington, MD | 3.0 | 2.0 | 1250 | $3,300 | $2.64 | 43d | 1 | 0.96mi |
| 9102 Cooper Dr Fort Washington, MD | 3.0 | 1.5 | 1400 | $3,499 | $2.50 | 43d | 1 | 1.11mi |
| 7521 Catone Ct Oxon Hill, MD | 3.0 | 3.5 | 2048 | $3,500 | $1.71 | 24d | 1 | 1.23mi |
HOA detail
- Monthly dues
- $290 · $3,480/yr
Listing history 16 events
-
2026-06-08days on market $249,900 Active 74 DOM
-
2026-06-07days on market $249,900 Active 73 DOM
-
2026-06-04days on market $249,900 Active 70 DOM
-
2026-06-03days on market $249,900 Active 69 DOM
-
2026-06-02days on market $249,900 Active 68 DOM
-
2026-06-01days on market $249,900 Active 67 DOM
-
2026-05-31days on market $249,900 Active 66 DOM
-
2026-03-27$249,900 Active 882-char remark
Show marketing remark (882 chars)
INVESTOR SPECIAL! This charming towhouse in highly sought after Fort Washington offers tons of potential with a main level featuring a living room, kitchen and dining room. Upstairs features three large bedrooms and 2 full bathrooms. The full-footprint tall basement with 1 full bathroom presents endless possibilities and space to increase your rental or resale value. This property is ideally situated near major highways, dining, and shopping, making it a top contender for a reliable long-term rental, as well as a profitable fix-and-flip. Investors will love the upside potential and the high demand for updated homes in this growing area. With the right vision, this home can become a standout asset in your portfolio. The property is being sold AS-IS, so move quickly. Opportunities like this don’t last long! * * * SELLERS PREFER SANCTUARY TITLE FOR CLOSING * * *
-
2026-03-26historical $249,900 882-char remark
Show marketing remark (882 chars)
INVESTOR SPECIAL! This charming towhouse in highly sought after Fort Washington offers tons of potential with a main level featuring a living room, kitchen and dining room. Upstairs features three large bedrooms and 2 full bathrooms. The full-footprint tall basement with 1 full bathroom presents endless possibilities and space to increase your rental or resale value. This property is ideally situated near major highways, dining, and shopping, making it a top contender for a reliable long-term rental, as well as a profitable fix-and-flip. Investors will love the upside potential and the high demand for updated homes in this growing area. With the right vision, this home can become a standout asset in your portfolio. The property is being sold AS-IS, so move quickly. Opportunities like this don’t last long! * * * SELLERS PREFER SANCTUARY TITLE FOR CLOSING * * *
-
2004-01-23soldstatus $136,000
-
2003-05-27soldstatus $136,000
-
2003-04-07historical
-
2002-10-19$129,000
-
1993-07-27soldstatus $107,500
-
1991-06-06soldstatus $95,000
-
1990-04-02soldstatus $104,000
ⓘ Source: listings_history table (triggers on properties + properties_extension) + one-shot
backfill from property_details.listing_events for pre-trigger history.
Tax reassessment forecast MD · Partial reset (capped growth)
- Current annual tax
- $3,782 · $315/mo
- Projected year-2 tax
- $3,782 · $315/mo
- Expected delta
- $0/yr ($0/mo · 0.0%)
ⓘ Screening estimate from a state-policy table — verify with the county assessor before closing.
Climate risk First Street
- Flood 1/10 Low FEMA zone X (unshaded) · 0% chance over 30 yrs
- Wildfire 4/10 Moderate
- Heat 8/10 Severe 7 d/yr ≥103°F today · 16 d/yr by 30 yrs out
- Wind 4/10 Moderate 21% chance of damaging wind over 30 yrs
- Air quality 3/10 Moderate 2 unhealthy d/yr today · 3 by 30 yrs out
Nearby sold comps map
Loading sold comps map…
Walkable amenities ~0.75 mi
Loading nearby amenities…
Taxation est. · year 1
- Rental income
- $31,209
- − Mortgage interest
- −$13,998
- − Property taxes
- −$3,782
- − Insurance
- −$1,250
- − Repairs & maintenance
- −$2,497
- − Management
- −$2,497
- − HOA
- −$3,480
- − Depreciation
- −$7,270
- Taxable loss
- −$3,563
- Est. tax savings @ 24.0%
- +$855
- After-tax cash flow
- $1,273/yr
For passive investors: Depreciation is non-cash, so a rental often shows a tax loss while cash-flowing — sheltering income. Rental losses are passive: they offset passive income freely, and up to $25,000/yr can offset ordinary (W-2) income if you actively participate and your MAGI is under $100k (phasing out to $0 by $150k); unused losses carry forward. On sale, claimed depreciation is recaptured at up to 25%, and gains may owe capital-gains tax (a 1031 exchange can defer both). Figures are a year-1 estimate at your 24.0% rate — not tax advice; consult a CPA.
Schools (NCES district)
- District
- Prince George'S County Public Schools
- NCES district ID
- 2400510
- Math proficiency
- 8% ▼ -11.00%
- Reading proficiency
- 24% ▼ -9.00%
- Median HH income
- $73,967
- Composite
- 16.82/100
- National rank
- #9151
- State rank
- #21 of 24 in MD
Livability — Oxon Hill
- Score
- 62/100
- State rank
- #311
- US rank
- #16277
Category grades
Schools grade is shown separately in the Schools card above.
Census & demographics
- Census place
- Oxon Hill, MD
- County
- Prince Georges County · 919,866 people
- Metro
- Washington-Arlington-Alexandria, DC-VA-MD-WV
- Population (ZIP)
- 54,441
- Household income
- $124,190
- Rent vs Own
- Severe rent burden
- 833.0
Population outlook (Prince George's County) Hauer SSP2
- Today (2025)
- 1,005,426 people
- By 2030
- 1,048,416 · +4.3%
- By 2040
- 1,123,425 · +11.7%
- By 2050
- 1,183,220 · +17.7%
- By 2075
- 1,306,202 · +29.9%
- By 2100
- 1,408,179 · +40.1%
Race, ethnicity, and origin ACS 2023
- Neighborhood character
- Diverse neighborhood (Simpson 0.56)
- Race & ethnicity
- Black 62% Hispanic / Latino 21% White 7% Two or more races 7% Asian 4%
- Hispanic origin (detail)
- Puerto Rican 1%
- Foreign-born
- 20% · Canada, South Korea
- Languages at home
- 74% English-only · Spanish 20% Tagalog/Filipino 2% French/Haitian/Cajun 1%
Political lean MEDSL · Prince George's
- 2024 margin
- Solid D (+75.2) · D 86.3% · R 11.2% · Other 2.5%
- 2008→2024 swing
- -3.3pp toward R · 2008: 78.5pp · 2024: 75.2pp
- All cycles
- 2024: D+75.2 2020: D+80.5 2016: D+81.0 2012: D+80.9 2008: D+78.5
Not yet ingested
- Civics
- —
Market trends
- HPI YoY
- ▼ -265.38%
- Current HPI
- 250.5558
- Rent YoY
- ▲ 3.06%
- Metro
- Washington-Arlington-Alexandria, DC-VA-MD-WV
- State GDP YoY
- ▲ 2.97%
- F500 in state
- 12
Industry mix (Fortune 500 HQ in MD)
| Industry | F500 HQs | Revenue |
|---|---|---|
| Aerospace / Defense | 1 | $71B |
|
||
| Utilities | 1 | $25B |
|
||
| Hotels | 1 | $24B |
|
||
| Consumer Goods | 1 | $7B |
|
||
| Real Estate | 1 | $6B |
|
||
| Chemicals | 1 | $2B |
|
||
Price history
+140.3% since first listed9 events — show timeline
- 2026-03-27 Listed $249,900 BRIGHT MLS
- 2026-03-26 Coming Soon $249,900 BRIGHT MLS
- 2004-01-23 Sold (Public Records) $136,000 Public Records
- 2003-05-27 Sold (MLS) $136,000 MRIS
- 2003-04-07 Delisted — MRIS
- 2002-10-19 Listed $129,000 MRIS
- 1993-07-27 Sold (Public Records) $107,500 Public Records
- 1991-06-06 Sold (Public Records) $95,000 Public Records
- 1990-04-02 Sold (Public Records) $104,000 Public Records
Property tax history
+6.0%/yrLatest (2025): $3,782 · +9.0% YoY. Source: county tax records.
Cash-flow waterfall
monthlySold comps — $/sqft
last 12 mo · ≤1 miLoading sold comps…