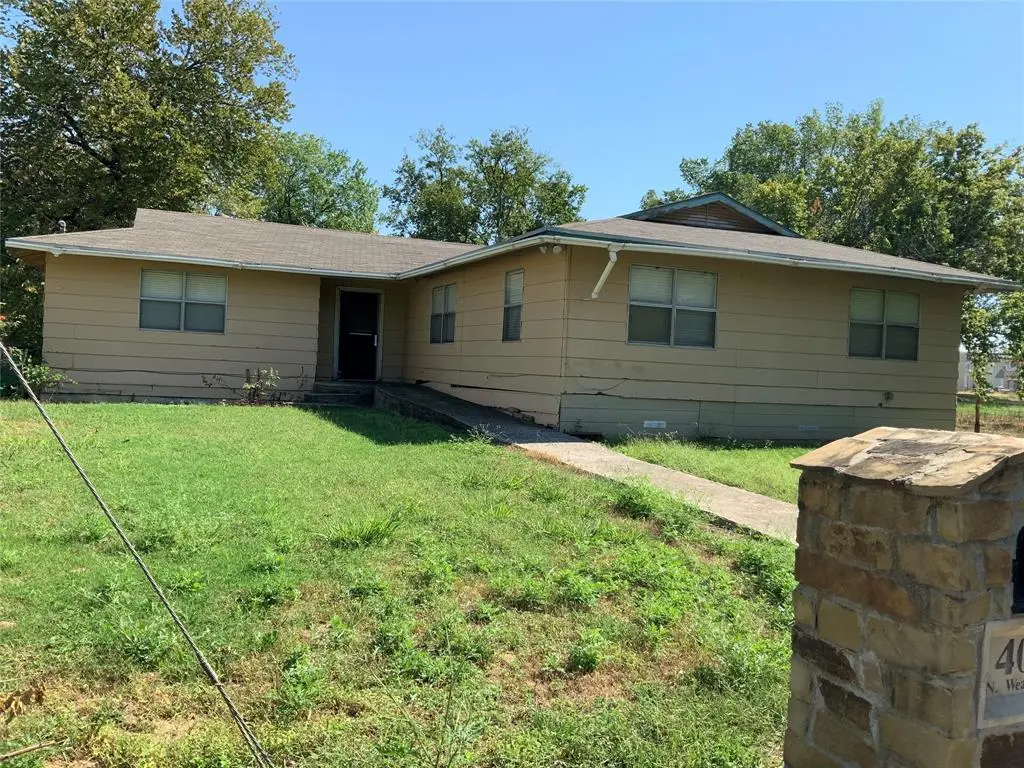
400 N Weaver St · Gainesville, TX
Flood risk 1/10 · Minimal
- FEMA flood zone
- X (unshaded)
- Chance of flooding over 30 yrs
- 0.0%
- Est. flood insurance / yr
- $507 – $1,088
Fire risk 7/10 · Major
- Est. fire insurance / yr
- $1,222 – $2,270
Heat risk 7/10 · Major
- Hot days now (above 110°F)
- 7 days/yr
- Hot days in 30 yrs
- 22 days/yr
Wind risk 4/10 · Minor
- Chance of severe wind over 30 yrs
- 15.0%
Air-quality risk 3/10 · Minor
- Unhealthy air days now
- 3 days/yr
- Unhealthy air days in 30 yrs
- 4 days/yr
Risk factors via First Street. Map © Google.
Why this score? — see what drove the C- grade
The composite is a weighted blend of 9 inputs, each scored 0–100. Each bar is that input's sub-score; the figure is the points it added to the 100-point composite (weight × sub-score).
- Cash flow +17.1/30.0
- ARV discount +15.0/15.0
- DSCR +5.3/10.0
- 1% rule +4.8/10.0
- Livability +3.3/5.0
- Schools +2.6/10.0
- Rent growth +2.5/5.0
- Condition / age +2.5/5.0
- Appreciation +0.0/10.0
$189,000
🖨 Deal sheet (PDF) 📄 Offer letter ✓ Due diligence
Listing remarks MLS
***THIS IS THE DAY AND AGE WHERE THERE IS PLENTY OF BUILDING AND REMODELING GOING ON*DRIVE BY THIS PROPERTY AND BRING YOUR VISION***
Key facts
- Remodeling going on
- 0.25 acre lot
- Garage
Tags
Neighborhood map
What this means for you Summary
Snapshot
- This is a 2-bed/2.0-bath single-family listed at $189k.
Deal economics
- At list price, monthly cash flow is $133 ($2k/yr) — positive.
- The deal already cash-flows at list — no discount required.
- To meet the 1% rule (rent ≥ 1% of price), the offer needs to be $184k (2.5% below list).
- Recommended offer: $166k (12.0% below list) — sets the bar for market timing.
- Cap rate 7.1% vs local median 3.6% in Gainesville — top-decile yield for the area; either an underpriced asset or a hidden risk that comps aren't pricing in. Stress-test before assuming the spread holds.
Location & tenants
- Location reads 66/100 on livability (#602 in TX) — a middle-class / working-renter tenant base. Strengths: cost of living A+, housing A+, crime B+; Watch: amenities F, commute F, employment F.
- Gainesville ISD (rural): math 33% / reading 29% proficiency, ranked #606 of 826 in TX (top 73%) — families likely to look elsewhere, expect single-tenant / working-renter base with shorter leases; 72% free/reduced lunch — lower-income household profile, screen leases tightly.
- Zoned schools: W E Chalmers El (math 28% / reading 24%, grade F, #2,954 of 4,322 statewide, top 69%, 716 students, 67% FRL); Gainesville J H (math 32% / reading 38%, grade F, #842 of 1,662 statewide, top 51%, 426 students, 71% FRL); Gainesville H S (math 42% / reading 22%, grade F, #1,044 of 1,632 statewide, top 66%, 863 students, 47% FRL).
- Market conditions: 461 active listings in the ZIP; 4 comparable units currently listed for rent nearby; rentals lingering (median 45d on market — plan ~5-8 weeks vacancy on turnover, expect pricing pressure); 100% of comp listings sitting > 30 days — soft ceiling on asking rent; 190 units permitted in Cooke County in 2024 (0 in 5+ unit buildings).
- This rent runs 31% of the median local income ($72k/yr) — at the standard rent-burdened threshold; future hikes will face affordability resistance.
Forward outlook
- Local home prices are declining (-3.0%/yr); year-one equity from $1k of loan paydown is wiped out by about $6k of value loss. Plan a longer hold.
Negotiation context
- It's been on market 605 days — a 12% lower offer ($166k) is reasonable based on typical stale-listing flexibility.
Risks & watch-outs
- Climate carrying-cost: major wildfire risk; extreme-heat days projected 7→22/yr by 2055 (HVAC capex compounding) — expect insurance premiums to compound above CPI over the hold.
Questions for the listing agent
- It's been on market 605 days. Have you received any prior offers? Is the seller open to a 12% concession, seller financing, or rate buy-down credit?
- Why hasn't it sold? Are there any deal-killer items the seller is aware of (foundation, flood, title, zoning, code violations)?
- Is there a deadline driving the sale (1031 exchange, divorce, estate, relocation)? That informs how much negotiation room exists.
- Schools are F-rated, which usually means shorter tenancies and higher turnover. Who's the typical renter profile here, and what's been the actual vacancy rate?
- What's the average days-on-market for RENTAL listings here right now (not sales)? A rising rental-DOM trend means longer vacancies and softer asking-rent achievability than the comps imply.
- What's the recent tenant-quality profile in this submarket — average credit score on applications, eviction rate, late-payment / NSF rate, and stable-employment percentage? A property-management company in the area should have these aggregated.
- How much new for-sale + rental construction is in the pipeline within 1–3 miles? Heavy new supply typically softens prices + rents 12–24 months out; constrained supply supports both.
Investment metrics
- 1% rule
- 0.98% ✗
- Cap rate
- 7.14%
- Cash-on-cash
- 3.01%
- DSCR
- 1.13
- GRM
- 8.5
CMA / ARV
- ARV (median comp)
- $251,831
- List price
- $189,000
- Delta
- -24.95%
- Verdict
- UNDERPRICED
- Comps
- 20 within 1.0 mi
Show comp detail 8 sales within ~0.75 mi
| Address | Dist | Beds/Ba | Sqft | Sold | Price | $/sf | Match |
|---|---|---|---|---|---|---|---|
| 502 S Chestnut St | 0.50mi | 3/2.0 (+1) | 1,725 (-8%) | 4mo | $179,000 | $104 | 55 |
| 723 S Dixon St | 0.66mi | 3/2.0 (+1) | 1,736 (-8%) | 1mo | $230,000 | $132 | 51 |
| 415 N Taylor St | 0.68mi | 3/2.0 (+1) | 1,832 (-3%) | 12mo | $239,000 | $130 | 50 |
| 511 Lindsay | 0.60mi | 3/2.0 (+1) | 2,070 (+10%) | 1mo | $262,000 | $127 | 49 |
| 803 S Rusk St | 0.68mi | 3/2.0 (+1) | 1,748 (-7%) | 6mo | $285,000 | $163 | 46 |
| 1124 Throckmorton St | 0.59mi | 2/1.0 | 1,610 (-14%) | 6mo | $187,000 | $116 | 39 |
| 810 Mill St | 0.39mi | 3/2.0 (+1) | 1,636 (-13%) | 22mo | $295,000 | $180 | 37 |
| 410 Lanius St | 0.74mi | 3/2.0 (+1) | 1,625 (-14%) | 16mo | $253,500 | $156 | 24 |
Match score weights: distance 35% · size 25% · config 20% · recency 20%. Top-matched comps best support the ARV.
Projected returns pro-forma
-3.0% appreciation · 3.0% rent growth · sell at horizon
- IRR
- -11.5%
- Equity multiple
- 0.58×
- Total profit
- $-22,135
- Equity at exit
- $28,181
- IRR
- -2.3%
- Equity multiple
- 0.84×
- Total profit
- $-8,234
- Equity at exit
- $16,341
Cash invested: $52,920 (down + closing). Projections, not guarantees.
Landlord ↔ Tenant lean methodology
- Overall (STATE)
- 87 Strongly Landlord-Friendly
- State Texas
- 87 Strongly Landlord-Friendly · R+5
- County
- — inherits STATE
- City
- — inherits STATE
ZIP-level market 76240
- Active inventory
- 461
- Price-to-rent
- 8.5×
Monthly cashflow live
- Estimated rent
- $1,843 medium interval (Pro) →
- Mortgage (P&I)
- −$991
- Tax from tax record
- −$253 /mo · $3,040/yr
- Insurance
- −$79
- HOA
- −$0
- Vacancy / Maint / Mgmt
- −$387
- Net cashflow
- $133
Break-even live
Sensitivity live
| Price | -10% $240 | -5% $186 | +0% $133 | +5% $79 | +10% $26 |
|---|---|---|---|---|---|
| Rent | -10% $-13 | -5% $60 | +0% $133 | +5% $206 | +10% $278 |
| Rate | -1.0pp $228 | -0.5pp $181 | base $133 | +0.5pp $84 | +1.0pp $34 |
UW: 25.0% down · 7.5% · 30yr · 1.5% tax · 5.0% vac · 8.0% maint · 8.0% mgmt
Financing live
Cash to close
- Down payment
- $47,250
- Closing costs
- $5,670
- Reserves months
- —
- Total cash needed
- —
Loan-product check · same deal, 3 products live
Conventional
25% down · 7.5% · 30yr
- Down + closing
- —
- Monthly P&I
- —
- Monthly cashflow
- —
- DSCR
- —
- Eligible?
- —
Personal DTI + credit; lowest rate.
DSCR
20% down · 8.5% · 30yr
- Down + closing
- —
- Monthly P&I
- —
- Monthly cashflow
- —
- DSCR
- —
- Eligible?
- —
No personal income docs; deal must DSCR.
Hard money
10% down · 12.0% · 12mo
- Down + closing
- —
- Monthly P&I
- —
- Monthly cashflow
- —
- DSCR
- —
- Eligible?
- —
Short-term bridge; refi at stabilization.
Rent comps 4 comps
| Address | Beds | Baths | Sqft | Rent | $/sqft | DOM | Units | Dist |
|---|---|---|---|---|---|---|---|---|
| 1010 E Main St Gainesville, TX | 3.0 | 1.0 | 1263 | $1,550 | $1.23 | 45d | 1 | 0.77mi |
| 426 N Clements St Gainesville, TX | 3.0 | 2.0 | 1408 | $2,307 | $1.64 | 45d | 1 | 0.92mi |
| 1331 Lanius St Gainesville, TX | 3.0 | 2.0 | 1300 | $1,850 | $1.42 | 45d | 1 | 1.16mi |
| 1911 College St Gainesville, TX | 3.0 | 2.0 | 1880 | $2,425 | $1.29 | 45d | 1 | 1.45mi |
Listing history 21 events
-
2026-06-19days on market $189,000 Active 605 DOM
-
2026-06-18days on market $189,000 Active 604 DOM
-
2026-06-17days on market $189,000 Active 603 DOM
-
2026-06-16days on market $189,000 Active 602 DOM
-
2026-06-15days on market $189,000 Active 601 DOM
-
2026-06-14days on market $189,000 Active 599 DOM
-
2026-06-12days on market $189,000 Active 598 DOM
-
2026-06-09days on market $189,000 Active 595 DOM
-
2026-06-08days on market $189,000 Active 594 DOM
-
2026-06-07days on market $189,000 Active 593 DOM
-
2026-06-05days on market $189,000 Active 590 DOM
-
2026-06-03days on market $189,000 Active 589 DOM
-
2026-06-02days on market $189,000 Active 588 DOM
-
2026-06-01days on market $189,000 Active 587 DOM
-
2026-05-31days on market $189,000 Active 586 DOM
-
2026-05-30days on market $189,000 Active 585 DOM
-
2026-03-08price $189,000 132-char remark
Show marketing remark (132 chars)
***THIS IS THE DAY AND AGE WHERE THERE IS PLENTY OF BUILDING AND REMODELING GOING ON*DRIVE BY THIS PROPERTY AND BRING YOUR VISION***
-
2025-11-24price $195,000 132-char remark
Show marketing remark (132 chars)
***THIS IS THE DAY AND AGE WHERE THERE IS PLENTY OF BUILDING AND REMODELING GOING ON*DRIVE BY THIS PROPERTY AND BRING YOUR VISION***
-
2024-10-20$199,900 Active 132-char remark
Show marketing remark (132 chars)
***THIS IS THE DAY AND AGE WHERE THERE IS PLENTY OF BUILDING AND REMODELING GOING ON*DRIVE BY THIS PROPERTY AND BRING YOUR VISION***
-
2011-05-11soldstatus
-
2001-04-11soldstatus
ⓘ Source: listings_history table (triggers on properties + properties_extension) + one-shot
backfill from property_details.listing_events for pre-trigger history.
Tax reassessment forecast TX · Resets to sale price
- Current annual tax
- $3,040 · $253/mo
- Projected year-2 tax
- $3,459 · $288/mo
- Expected delta
- +$419/yr (+$35/mo · 13.8%)
ⓘ Screening estimate from a state-policy table — verify with the county assessor before closing.
Climate risk First Street
- Flood 1/10 Low FEMA zone X (unshaded) · 0% chance over 30 yrs
- Wildfire 7/10 Severe
- Heat 7/10 Severe 7 d/yr ≥110°F today · 22 d/yr by 30 yrs out
- Wind 4/10 Moderate 15% chance of damaging wind over 30 yrs
- Air quality 3/10 Moderate 3 unhealthy d/yr today · 4 by 30 yrs out
Nearby sold comps map
Loading sold comps map…
Walkable amenities ~0.75 mi
Loading nearby amenities…
Taxation est. · year 1
- Rental income
- $22,115
- − Mortgage interest
- −$10,587
- − Property taxes
- −$3,040
- − Insurance
- −$945
- − Repairs & maintenance
- −$1,769
- − Management
- −$1,769
- − Depreciation
- −$5,498
- Taxable loss
- −$1,493
- Est. tax savings @ 24.0%
- +$358
- After-tax cash flow
- $1,951/yr
For passive investors: Depreciation is non-cash, so a rental often shows a tax loss while cash-flowing — sheltering income. Rental losses are passive: they offset passive income freely, and up to $25,000/yr can offset ordinary (W-2) income if you actively participate and your MAGI is under $100k (phasing out to $0 by $150k); unused losses carry forward. On sale, claimed depreciation is recaptured at up to 25%, and gains may owe capital-gains tax (a 1031 exchange can defer both). Figures are a year-1 estimate at your 24.0% rate — not tax advice; consult a CPA.
Schools (NCES district)
- District
- Gainesville ISD
- NCES district ID
- 4820220
- Math proficiency
- 33% ▼ -9.00%
- Reading proficiency
- 29% ▼ -2.00%
- Median HH income
- $41,772
- Composite
- 26.27/100
- National rank
- #7252
- State rank
- #606 of 826 in TX
Livability — Gainesville
- Score
- 66/100
- State rank
- #602
- US rank
- #11445
Category grades
Schools grade is shown separately in the Schools card above.
Census & demographics
- Census place
- Gainesville, TX
- County
- Cooke County · 29,419 people
- City population
- 29,419
- Metro
- Gainesville, TX
- Population (ZIP)
- 29,419
- Household income
- $71,502
- Rent vs Own
- Severe rent burden
- 660.0
Population outlook (Cooke County) Hauer SSP2
- Today (2025)
- 39,965 people
- By 2030
- 39,974 · +0.0%
- By 2040
- 39,772 · -0.5%
- By 2050
- 39,258 · -1.8%
- By 2075
- 37,262 · -6.8%
- By 2100
- 33,363 · -16.5%
Race, ethnicity, and origin ACS 2023
- Neighborhood character
- Predominantly White (66%)
- Race & ethnicity
- White 66% Hispanic / Latino 24% Two or more races 14% Black 5%
- Hispanic origin (detail)
- Mexican 21%
- Common ancestry
- Serbian 2% Lithuanian 2% Slovak 1%
- Foreign-born
- 8% · Canada
- Languages at home
- 83% English-only · Spanish 16% Other Indo-European 1%
Political lean MEDSL · Cooke
- 2024 margin
- Solid R (+66.9) · D 16.2% · R 83.1%
- 2008→2024 swing
- -8.2pp toward R · 2008: -58.7pp · 2024: -66.9pp
- All cycles
- 2024: R+66.9 2020: R+65.2 2016: R+68.1 2012: R+67.6 2008: R+58.7
Not yet ingested
- Civics
- —
Market trends
- HPI YoY
- ▼ -198.63%
- Current HPI
- 247.3822
- Rent YoY
- —
- Metro
- Gainesville, TX
- State GDP YoY
- ▲ 3.95%
- F500 in state
- 110
Industry mix (Fortune 500 HQ in TX)
| Industry | F500 HQs | Revenue |
|---|---|---|
| Energy | 16 | $1,198B |
|
||
| Technology | 5 | $198B |
|
||
| Engineering / Construction | 4 | $72B |
|
||
| Energy Services | 3 | $60B |
|
||
| Utilities | 3 | $41B |
|
||
| Healthcare | 2 | $330B |
|
||
Price history
-5.5% since first listed5 events — show timeline
- 2026-03-08 Price Changed $189,000 NTREIS
- 2025-11-24 Price Changed $195,000 NTREIS
- 2024-10-20 Listed $199,900 NTREIS
- 2011-05-11 Sold (Public Records) — Public Records
- 2001-04-11 Sold (Public Records) — Public Records
Property tax history
+9.0%/yrLatest (2025): $3,040 · +10.4% YoY. Source: county tax records.
Cash-flow waterfall
monthlySold comps — $/sqft
last 12 mo · ≤1 miLoading sold comps…