7350 Park Brown Rd · Harrington, DE
Flood risk 3/10 · Minor
- FEMA flood zone
- X (unshaded)
- Chance of flooding over 30 yrs
- 0.1%
- Est. flood insurance / yr
- $507 – $1,088
Fire risk 2/10 · Minimal
- Est. fire insurance / yr
- $476 – $884
Heat risk 8/10 · Major
- Hot days now (above 102°F)
- 7 days/yr
- Hot days in 30 yrs
- 16 days/yr
Wind risk 6/10 · Moderate
- Chance of severe wind over 30 yrs
- 67.0%
Air-quality risk 2/10 · Minimal
- Unhealthy air days now
- 1 days/yr
- Unhealthy air days in 30 yrs
- 1 days/yr
Risk factors via First Street. Map © Google.
Why this score? — see what drove the B grade
The composite is a weighted blend of 9 inputs, each scored 0–100. Each bar is that input's sub-score; the figure is the points it added to the 100-point composite (weight × sub-score).
- Cash flow +30.0/30.0
- 1% rule +10.0/10.0
- DSCR +10.0/10.0
- ARV discount +7.5/15.0
- Appreciation +4.0/10.0
- Livability +3.7/5.0
- Schools +3.0/10.0
- Rent growth +2.5/5.0
- Condition / age +2.5/5.0
$85,000
🖨 Deal sheet (PDF) 📄 Offer letter ✓ Due diligence
Listing remarks MLS
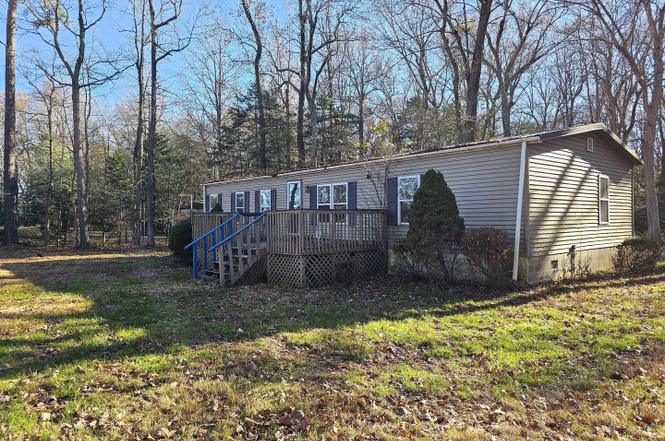
Class C double wide on permanent foundation in quiet country setting, just minutes outside of town. Close to Harrington Raceway and Casino. One acre lot partially wooded and landscaped. Pull into this secluded oasis and enter the large sundeck porch into the living room dining room combination. Off the living room is a large master suite with walk in closet and full bath. On the other end are two large bedrooms that share another full bath. Just off dining room are sliding glass doors that lead onto another large sundeck. Backyard is partially cleared with shed. Home has wall A/C unit that cools entire house. Home comes with a AHS one year warranty.
Key facts
- 1 acre lot
- Built 1979
- Listed 2 days
Property features AI
Exterior
- Parking: Driveway
- Utilities: Well water; On-site septic; Electric service available; Water available; Sewer available; Electric hot water
- Home design: Detached home; Year built reported as estimated
- Construction: Block foundation; Vinyl siding exterior
- Exterior features: Detached structure; Vinyl siding; Shed on the property; No tidal water
Interior
- Bedrooms: Three bedrooms on the main level (Bedroom 1, Bedroom 2, Bedroom 3)
- Bathrooms: Two full bathrooms on the main level
- Heating & cooling: Forced air heating; Window air conditioning units (electric)
- Interior features: No basement; Five total rooms
Neighborhood map
What this means for you Summary
Snapshot
- This is a 3-bed/2.0-bath manufactured listed at $85k.
Deal economics
- At list price, monthly cash flow is $441 ($5k/yr) — positive.
- The deal already cash-flows at list — no discount required.
- Meets the 1% rule at list price ($1k rent vs $85k).
- Cap rate 12.5% vs local median 3.8% in Harrington — top-decile yield for the area; either an underpriced asset or a hidden risk that comps aren't pricing in. Stress-test before assuming the spread holds.
Location & tenants
- Location reads 73/100 on livability (#9 in DE) — a middle-class / working-renter tenant base. Strengths: cost of living A+, housing A+, health & safety A+; Watch: crime D+, amenities F, commute F.
- Lake Forest School District (rural): math 26% / reading 44% proficiency, ranked #13 of 26 in DE (top 50%) — families likely to look elsewhere, expect single-tenant / working-renter base with shorter leases.
- Zoned schools: Lake Forest South Elementary School (math 17% / reading 27%, grade F, #70 of 105 statewide, top 70%, 379 students, 0% FRL); Chipman (W.T.) Middle School (math 24% / reading 45%, grade F, #12 of 36 statewide, top 34%, 965 students, 0% FRL); Lake Forest High School (math 27% / reading 47%, grade F, #16 of 40 statewide, top 38%, 870 students, 0% FRL) — zoned schools average 0% FRL vs 47% district-wide (47 pts lower); this property's tenant base skews higher-income than the district average.
- Market conditions: 78 active listings in the ZIP; 1,201 units permitted in Kent County in 2024 (116 in 5+ unit buildings).
Forward outlook
- Local home prices are declining (-2.1%/yr); year-one equity from $588 of loan paydown is wiped out by about $2k of value loss. Plan a longer hold.
- Kent County population projected at +22% by 2050 — long-run rental-demand tailwind backs the buy-and-hold thesis.
- At projected returns (-2.1% appreciation + 3.0% rent growth), your $24k cash investment doubles in ~5 years — after that, you're playing with house money.
Negotiation context
- Only 2 days on market — expect competitive offers; lowballing is unlikely to land.
- 5 sale attempts since 14y ago with the ask held roughly flat each time — persistent listings suggest the price (not the market) is what's stuck; bring a comps-based counter.
Risks & watch-outs
- Climate carrying-cost: major wind risk, 67% chance of damaging wind over 30y; extreme-heat days projected 7→16/yr by 2055 (HVAC capex compounding) — expect insurance premiums to compound above CPI over the hold.
Questions for the listing agent
- Built in 1979 — when were the roof, HVAC, electrical panel, plumbing, and water heater last replaced?
- Is there a deadline driving the sale (1031 exchange, divorce, estate, relocation)? That informs how much negotiation room exists.
- Crime grade is D in this area — have there been break-ins, vandalism, or insurance claims at this property in the last 3 years? What carrier currently insures it and at what premium?
- What's the average days-on-market for RENTAL listings here right now (not sales)? A rising rental-DOM trend means longer vacancies and softer asking-rent achievability than the comps imply.
- What's the recent tenant-quality profile in this submarket — average credit score on applications, eviction rate, late-payment / NSF rate, and stable-employment percentage? A property-management company in the area should have these aggregated.
- How much new for-sale + rental construction is in the pipeline within 1–3 miles? Heavy new supply typically softens prices + rents 12–24 months out; constrained supply supports both.
Investment metrics
- 1% rule
- 1.61% ✓
- Cap rate
- 12.51%
- Cash-on-cash
- 22.22%
- DSCR
- 1.99
- GRM
- 5.2
CMA / ARV
No comps found within radius.
Projected returns pro-forma
-2.07% appreciation · 3.0% rent growth · sell at horizon
- IRR
- 17.4%
- Equity multiple
- 1.74×
- Total profit
- $17,699
- Equity at exit
- $16,241
- IRR
- 24.6%
- Equity multiple
- 3.30×
- Total profit
- $54,752
- Equity at exit
- $13,625
Cash invested: $23,800 (down + closing). Projections, not guarantees.
Landlord ↔ Tenant lean methodology
- Overall (STATE)
- 70 Landlord-Friendly
- State Delaware
- 70 Landlord-Friendly · D+7
- County
- — inherits STATE
- City
- — inherits STATE
ZIP-level market 19952
- Home prices YoY
- -0.8%
- Active inventory
- 78
- Price-to-rent
- 5.2×
Monthly cashflow live
- Estimated rent
- $1,371 medium interval (Pro) →
- Mortgage (P&I)
- −$446
- Tax from tax record
- −$161 /mo · $1,934/yr
- Insurance
- −$35
- HOA
- −$0
- Lot rent leased land?
- −$0
- Vacancy / Maint / Mgmt
- −$288
- Net cashflow
- $441
Break-even live
Sensitivity live
| Price | -10% $489 | -5% $465 | +0% $441 | +5% $417 | +10% $393 |
|---|---|---|---|---|---|
| Rent | -10% $332 | -5% $387 | +0% $441 | +5% $495 | +10% $549 |
| Rate | -1.0pp $483 | -0.5pp $462 | base $441 | +0.5pp $419 | +1.0pp $396 |
UW: 25.0% down · 7.5% · 30yr · 1.5% tax · 5.0% vac · 8.0% maint · 8.0% mgmt
Financing live
Cash to close
- Down payment
- $21,250
- Closing costs
- $2,550
- Reserves months
- —
- Total cash needed
- —
Loan-product check · same deal, 3 products live
Conventional
25% down · 7.5% · 30yr
- Down + closing
- —
- Monthly P&I
- —
- Monthly cashflow
- —
- DSCR
- —
- Eligible?
- —
Personal DTI + credit; lowest rate.
DSCR
20% down · 8.5% · 30yr
- Down + closing
- —
- Monthly P&I
- —
- Monthly cashflow
- —
- DSCR
- —
- Eligible?
- —
No personal income docs; deal must DSCR.
Hard money
10% down · 12.0% · 12mo
- Down + closing
- —
- Monthly P&I
- —
- Monthly cashflow
- —
- DSCR
- —
- Eligible?
- —
Short-term bridge; refi at stabilization.
Listing history 2 events
-
2026-06-10remarks 517-char remark
-
2026-06-10$85,000 Pending 2 DOM
ⓘ Source: listings_history table (triggers on properties + properties_extension) + one-shot
backfill from property_details.listing_events for pre-trigger history.
Tax reassessment forecast DE · Partial reset (capped growth)
- Current annual tax
- $1,934 · $161/mo
- Projected year-2 tax
- $1,934 · $161/mo
- Expected delta
- $0/yr ($0/mo · 0.0%)
ⓘ Screening estimate from a state-policy table — verify with the county assessor before closing.
Climate risk First Street
- Flood 3/10 Moderate FEMA zone X (unshaded) · 10% chance over 30 yrs
- Wildfire 2/10 Low
- Heat 8/10 Severe 7 d/yr ≥102°F today · 16 d/yr by 30 yrs out
- Wind 6/10 Major 67% chance of damaging wind over 30 yrs
- Air quality 2/10 Low 1 unhealthy d/yr today · 1 by 30 yrs out
Nearby sold comps map
Loading sold comps map…
Walkable amenities ~0.75 mi
Loading nearby amenities…
Taxation est. · year 1
- Rental income
- $16,450
- − Mortgage interest
- −$4,761
- − Property taxes
- −$1,934
- − Insurance
- −$425
- − Repairs & maintenance
- −$1,316
- − Management
- −$1,316
- − Depreciation
- −$2,473
- Taxable income
- $4,225
- Est. tax owed @ 24.0%
- −$1,014
- After-tax cash flow
- $4,274/yr
For passive investors: Depreciation is non-cash, so a rental often shows a tax loss while cash-flowing — sheltering income. Rental losses are passive: they offset passive income freely, and up to $25,000/yr can offset ordinary (W-2) income if you actively participate and your MAGI is under $100k (phasing out to $0 by $150k); unused losses carry forward. On sale, claimed depreciation is recaptured at up to 25%, and gains may owe capital-gains tax (a 1031 exchange can defer both). Figures are a year-1 estimate at your 24.0% rate — not tax advice; consult a CPA.
Schools (NCES district)
- District
- Lake Forest School District
- NCES district ID
- 1000790
- Math proficiency
- 26% ▼ -23.00%
- Reading proficiency
- 44% ▼ -14.00%
- Median HH income
- $52,034
- Composite
- 30.47/100
- National rank
- #6225
- State rank
- #13 of 26 in DE
Livability — Harrington
- Score
- 73/100
- State rank
- #9
- US rank
- #5270
Category grades
Schools grade is shown separately in the Schools card above.
Census & demographics
- Population (ZIP)
- 10,730
Population outlook (Kent County) Hauer SSP2
- Today (2025)
- 194,477 people
- By 2030
- 204,351 · +5.1%
- By 2040
- 222,135 · +14.2%
- By 2050
- 236,483 · +21.6%
- By 2075
- 266,327 · +36.9%
- By 2100
- 275,335 · +41.6%
Race, ethnicity, and origin ACS 2023
- Neighborhood character
- Predominantly White (84%)
- Race & ethnicity
- White 84% Black 8% Hispanic / Latino 5% Two or more races 4% Asian 1%
- Hispanic origin (detail)
- Mexican 2% Puerto Rican 3%
- Common ancestry
- Slovak 2% Romanian 1% Portuguese 1%
- Foreign-born
- 3% · Canada, Vietnam, South Korea
- Languages at home
- 93% English-only · Spanish 4% Vietnamese 1% German/W. Germanic 1%
Political lean MEDSL · Kent
- 2024 margin
- Toss-up / Even · D 50.2% · R 48.2% · Other 1.7%
- 2008→2024 swing
- -7.8pp toward R · 2008: 9.8pp · 2024: 2.0pp
- All cycles
- 2024: D+2.0 2020: D+4.1 2016: R+4.9 2012: D+4.9 2008: D+9.8
Not yet ingested
- Civics
- —
Market trends
- HPI YoY
- ▼ -2.07%
- Current HPI
- 268.56
- Rent YoY
- —
- Metro
- —
- State GDP YoY
- —
- F500 in state
- 0
Price history
+71.7% since first listed15 events — show timeline
- 2026-06-10 Pending — BRIGHT MLS
- 2026-06-10 Relisted — BRIGHT MLS
- 2026-02-26 Listing Removed — BRIGHT MLS
- 2026-01-16 Contingent — BRIGHT MLS
- 2026-01-13 Listed $85,000 BRIGHT MLS
- 2014-08-22 Sold (Public Records) $125,000 Public Records
- 2014-08-18 Sold (MLS) $125,000 TREND
- 2014-08-18 Sold (MLS) $125,000 BRIGHT MLS
- 2014-07-07 Pending — TREND
- 2014-07-03 Listing Removed — BRIGHT MLS
- 2014-05-23 Listed $129,000 TREND
- 2014-05-23 Listed $129,000 BRIGHT MLS
- 2013-11-21 Listing Removed — BRIGHT MLS
- 2012-11-26 Listed $119,900 BRIGHT MLS
- 1994-08-01 Sold (Public Records) $49,500 Public Records
Property tax history
+13.0%/yrLatest (2025): $1,934 · +83.8% YoY. Source: county tax records.
Cash-flow waterfall
monthlySold comps — $/sqft
last 12 mo · ≤1 miLoading sold comps…