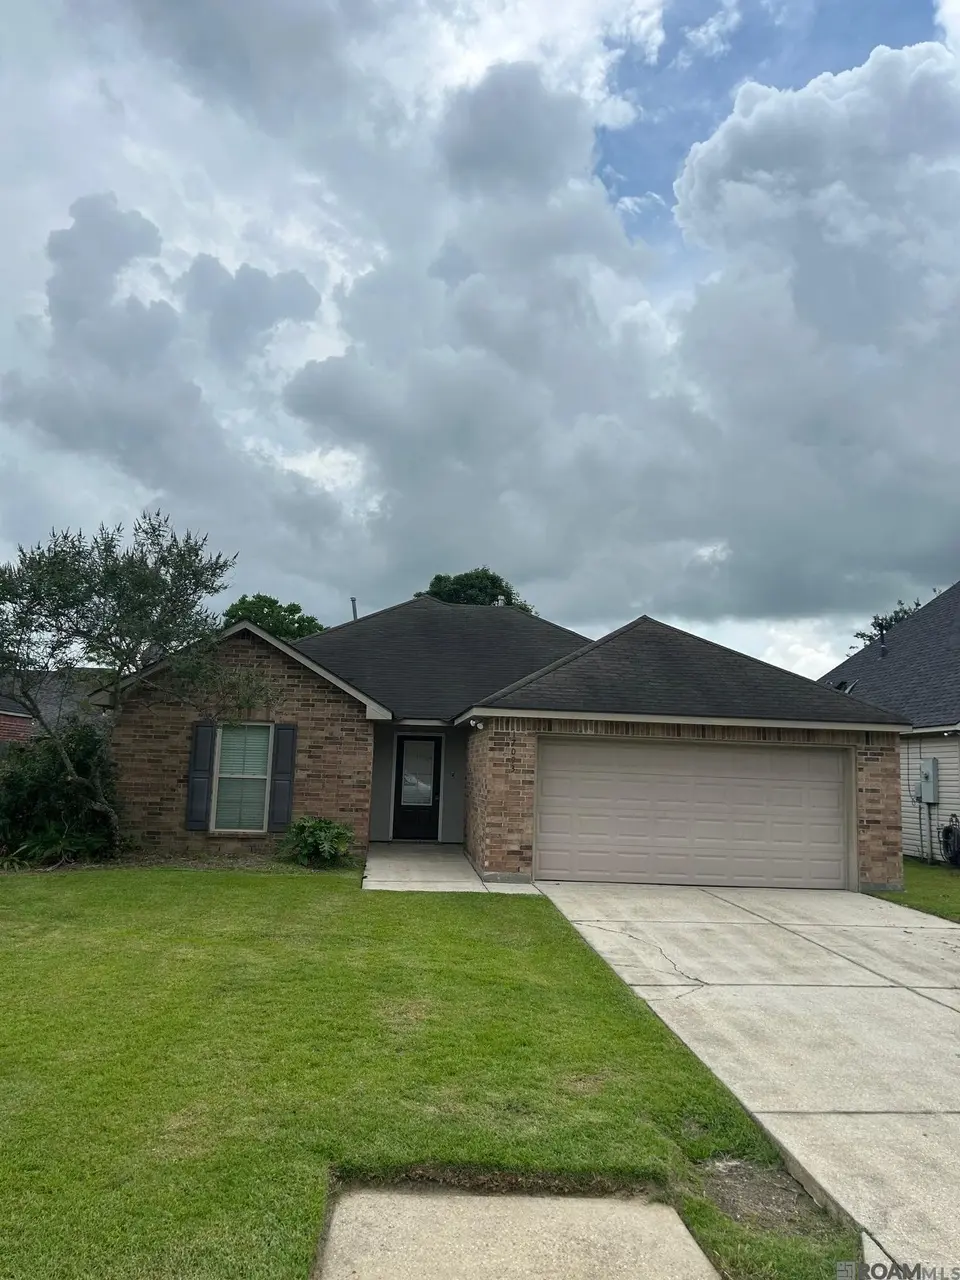
17093 Richmond Dr · Prairieville, LA
Flood risk 1/10 · Minimal
- FEMA flood zone
- X
- Chance of flooding over 30 yrs
- 0.0%
- Est. flood insurance / yr
- $507 – $1,088
Fire risk 1/10 · Minimal
- Est. fire insurance / yr
- $1,269 – $2,357
Heat risk 8/10 · Major
- Hot days now (above 108°F)
- 7 days/yr
- Hot days in 30 yrs
- 21 days/yr
Wind risk 9/10 · Severe
- Chance of severe wind over 30 yrs
- 99.0%
Air-quality risk 2/10 · Minimal
- Unhealthy air days now
- 2 days/yr
- Unhealthy air days in 30 yrs
- 2 days/yr
Risk factors via First Street. Map © Google.
Why this score? — see what drove the D grade
The composite is a weighted blend of 9 inputs, each scored 0–100. Each bar is that input's sub-score; the figure is the points it added to the 100-point composite (weight × sub-score).
- Cash flow +11.7/30.0
- ARV discount +9.7/15.0
- Schools +4.7/10.0
- Livability +3.5/5.0
- DSCR +3.4/10.0
- Rent growth +3.4/5.0
- 1% rule +2.6/10.0
- Condition / age +2.5/5.0
- Appreciation +0.0/10.0
$225,000
🖨 Deal sheet 📄 Offer letter ✓ Due diligence
Listing remarks MLS
MUST SEE 3 BEDROOM, 2 BATH HOME LOCATED INSIDE JAMESTOWNE COURT SUBDIVISION! ENJOY THE LARGE LIVING ROOM AND SPLIT FLOOR PLAN. HOME INTERIOR HAS BEEN COMPLETEY BEEN REPAINTED, NEW CARPET, NEW KITCHEN APPLIANCES ( GLASS TOP STOVE, DISHWASHER AND GARBAGE DISPOSAL), AND NEW GRANITE KITCHEN COUNTERS WITH SUBWAY TILE BACK SPLASHES! THIS HOME IS LOCATED WITH ASCENSION PARISH SCHOOL SYSTEM AND THERE IS NO HOME OWNERS ASSOCIATION!!!
Key facts
- Split floor plan
- Large living room
- 6,011 sq ft lot
Tags
Property features AI
Exterior
- Parking: Garage
- Utilities: Public water; Public sewer
- Home design: Detached single-family residence; Residential property
- Construction: Vinyl siding and brick exterior; Slab foundation; Built with 1,847 square feet
- Exterior features: Public water; Public sewer; Located in the Jamestowne Court subdivision
Interior
- Bathrooms: 2 full bathrooms
- Heating & cooling: Central heating; Central air conditioning
- Interior features: Walk-in closet(s)
Neighborhood map
What this means for you Summary
Snapshot
- This is a 3-bed/2.0-bath single-family listed at $225k.
Deal economics
- At list price, monthly cash flow is $-66 ($-796/yr) — negative.
- To cash-flow at today's rent, offer at most $213k (5.2% below list).
- To meet the 1% rule (rent ≥ 1% of price), the offer needs to be $172k (23.5% below list).
- Recommended offer: $172k (23.5% below list) — sets the bar for 1% rule.
- Cap rate 5.9% vs local median 4.3% in Prairieville — top-decile yield for the area; either an underpriced asset or a hidden risk that comps aren't pricing in. Stress-test before assuming the spread holds.
Location & tenants
- Location reads 69/100 on livability (#70 in LA) — a middle-class / working-renter tenant base. Strengths: schools A+, employment A+, housing A+; Watch: amenities F, commute F, health & safety F.
- Ascension Parish (suburban): math 48% / reading 58% proficiency, ranked #7 of 98 in LA (top 7%) — acceptable for families but not a draw, mixed tenant base, ~2y average lease.
- Market conditions: Rents rising (+3.5%/yr); 492 active listings in the ZIP; 3 comparable units currently listed for rent nearby; rentals lingering (median 44d on market — plan ~5-8 weeks vacancy on turnover, expect pricing pressure); 100% of comp listings sitting > 30 days — soft ceiling on asking rent; solid renter incomes; 579 units permitted in Ascension Parish in 2024 (0 in 5+ unit buildings).
Forward outlook
- Local home prices are declining (-3.0%/yr); year-one equity from $2k of loan paydown is wiped out by about $7k of value loss. Plan a longer hold.
- Ascension County population projected at +43% by 2050 — long-run rental-demand tailwind backs the buy-and-hold thesis.
Negotiation context
- Only 4 days on market — expect competitive offers; lowballing is unlikely to land.
- 3 sale attempts since 16y ago with the ask held roughly flat each time — persistent listings suggest the price (not the market) is what's stuck; bring a comps-based counter.
Risks & watch-outs
- Climate carrying-cost: severe wind risk, 99% chance of damaging wind over 30y; extreme-heat days projected 7→21/yr by 2055 (HVAC capex compounding) — expect insurance premiums to compound above CPI over the hold.
Questions for the listing agent
- What do current leases actually rent for vs. the listed asking? Can we see a recent rent roll and the last 12 months of T-12 income?
- Is there a deadline driving the sale (1031 exchange, divorce, estate, relocation)? That informs how much negotiation room exists.
- Schools are A-rated — typically a magnet for longer-tenancy family renters. What's the average tenant stay here, and is there a school-zone premium baked into asking?
- The area grade is low — what's the realistic commute time and amenity access for the typical tenant pool here? Any planned neighborhood developments (good or bad) we should know about?
- What's the average days-on-market for RENTAL listings here right now (not sales)? A rising rental-DOM trend means longer vacancies and softer asking-rent achievability than the comps imply.
- What's the recent tenant-quality profile in this submarket — average credit score on applications, eviction rate, late-payment / NSF rate, and stable-employment percentage? A property-management company in the area should have these aggregated.
- How much new for-sale + rental construction is in the pipeline within 1–3 miles? Heavy new supply typically softens prices + rents 12–24 months out; constrained supply supports both.
Investment metrics
- 1% rule
- 0.76% ✗
- Cap rate
- 5.94%
- Cash-on-cash
- -1.26%
- DSCR
- 0.94
- GRM
- 10.9
CMA / ARV
- ARV (on-the-fly)
- $236,742
- Comps found
- 12
Show comp detail 12 sales within ~0.75 mi
| Address | Dist | Beds/Ba | Sqft | Sold | Price | $/sf | Match |
|---|---|---|---|---|---|---|---|
| 39474 Old Cornerstone Ct | 0.09mi | 3/2.0 | 1,311 (+4%) | 8mo | $245,000 | $187 | 83 |
| 17034 Hunters Trace St Trce W | 0.24mi | 3/2.0 | 1,309 (+3%) | 2mo | $254,500 | $194 | 81 |
| 17047 Hunters Trace St Trce W | 0.26mi | 3/2.0 | 1,312 (+4%) | 6mo | $255,000 | $194 | 77 |
| 39507 Rue Royale | 0.30mi | 3/2.0 | 1,443 (+14%) | 4mo | $270,000 | $187 | 60 |
| 17239 Rue Le Norde | 0.29mi | 3/2.0 | 1,443 (+14%) | 4mo | $264,900 | $184 | 60 |
| 17076 Hunters Trace St W | 0.22mi | 3/2.0 | 1,428 (+13%) | 12mo | $259,900 | $182 | 59 |
| 17231 Rue Le Norde | 0.27mi | 3/2.0 | 1,429 (+13%) | 9mo | $275,000 | $192 | 58 |
| 17029 Hunters Trace St E | 0.22mi | 4/2.0 (+1) | 1,420 (+12%) | 10mo | $239,900 | $169 | 56 |
| 40086 Todd Dr | 0.40mi | 3/2.0 | 1,424 (+12%) | 9mo | $319,000 | $224 | 53 |
| 40209 La Rochelle Rd | 0.68mi | 3/2.0 | 1,400 (+11%) | 8mo | $269,000 | $192 | 44 |
| 40192 Hwy 42 Hwy | 0.74mi | 3/2.0 | 1,180 (-7%) | 21mo | $219,900 | $186 | 37 |
| 17264 La Hwy 929 | 0.38mi | 2/1.0 (-1) | 1,091 (-14%) | 23mo | $200,000 | $183 | 31 |
Match score weights: distance 35% · size 25% · config 20% · recency 20%. Top-matched comps best support the ARV.
Projected returns pro-forma
-3.0% appreciation · 3.47% rent growth · sell at horizon
- IRR
- -17.9%
- Equity multiple
- 0.37×
- Total profit
- $-39,919
- Equity at exit
- $33,548
- IRR
- -9.4%
- Equity multiple
- 0.41×
- Total profit
- $-37,029
- Equity at exit
- $19,454
Cash invested: $63,000 (down + closing). Projections, not guarantees.
Landlord ↔ Tenant lean methodology
- Overall (STATE)
- 90 Strongly Landlord-Friendly
- State Louisiana
- 90 Strongly Landlord-Friendly · R+12
- County
- — inherits STATE
- City
- — inherits STATE
ZIP-level market 70769
- Rents YoY
- 3.5%
- Active inventory
- 492
- Price-to-rent
- 10.9×
Monthly cashflow live
- Estimated rent
- $1,721 medium interval (Pro) →
- Mortgage (P&I)
- −$1,180
- Tax from tax record
- −$152 /mo · $1,823/yr
- Insurance
- −$94
- HOA
- −$0
- Vacancy / Maint / Mgmt
- −$361
- Net cashflow
- $-66
Break-even live
UW: 25.0% down · 7.5% · 30yr · 1.5% tax · 5.0% vac · 8.0% maint · 8.0% mgmt
Financing live
Cash to close
- Down payment
- $56,250
- Closing costs
- $6,750
- Reserves months
- —
- Total cash needed
- —
Loan-product check · same deal, 3 products live
Conventional
25% down · 7.5% · 30yr
- Down + closing
- —
- Monthly P&I
- —
- Monthly cashflow
- —
- DSCR
- —
- Eligible?
- —
Personal DTI + credit; lowest rate.
DSCR
20% down · 8.5% · 30yr
- Down + closing
- —
- Monthly P&I
- —
- Monthly cashflow
- —
- DSCR
- —
- Eligible?
- —
No personal income docs; deal must DSCR.
Hard money
10% down · 12.0% · 12mo
- Down + closing
- —
- Monthly P&I
- —
- Monthly cashflow
- —
- DSCR
- —
- Eligible?
- —
Short-term bridge; refi at stabilization.
Rent comps 3 comps
| Address | Beds | Baths | Sqft | Rent | $/sqft | DOM | Units | Dist |
|---|---|---|---|---|---|---|---|---|
| 38294 1494 Unit 7 Prairieville, LA | 2.0 | 2.5 | 1447 | $1,055 | $0.73 | 43d | 1 | 0.60mi |
| 17160 Parker Heights Dr Prairieville, LA | 3.0 | 2.0 | 1274 | $2,100 | $1.65 | 43d | 1 | 1.01mi |
| 40514 1513 Prairieville, LA | 2.0 | 2.0 | 980 | $900 | $0.92 | 43d | 1 | 1.13mi |
Listing history 4 events
-
2026-06-07statusdays on market $225,000 Pending 4 DOM
-
2026-06-05days on market $225,000 Active 2 DOM
-
2026-06-03remarks 429-char remark
-
2026-06-03$225,000 Active 1 DOM
ⓘ Source: listings_history table (triggers on properties + properties_extension) + one-shot
backfill from property_details.listing_events for pre-trigger history.
Tax reassessment forecast LA · Resets to sale price
- Current annual tax
- $1,823 · $152/mo
- Projected year-2 tax
- $1,823 · $152/mo
- Expected delta
- $0/yr ($0/mo · 0.0%)
ⓘ Screening estimate from a state-policy table — verify with the county assessor before closing.
Climate risk First Street
- Flood 1/10 Low FEMA zone X · 0% chance over 30 yrs
- Wildfire 1/10 Low
- Heat 8/10 Severe 7 d/yr ≥108°F today · 21 d/yr by 30 yrs out
- Wind 9/10 Extreme 99% chance of damaging wind over 30 yrs
- Air quality 2/10 Low 2 unhealthy d/yr today · 2 by 30 yrs out
Nearby sold comps map
Loading sold comps map…
Walkable amenities ~0.75 mi
Loading nearby amenities…
Taxation est. · year 1
- Rental income
- $20,648
- − Mortgage interest
- −$12,603
- − Property taxes
- −$1,823
- − Insurance
- −$1,125
- − Repairs & maintenance
- −$1,652
- − Management
- −$1,652
- − Depreciation
- −$6,545
- Taxable loss
- −$4,753
- Est. tax savings @ 24.0%
- +$1,141
- After-tax cash flow
- $345/yr
For passive investors: Depreciation is non-cash, so a rental often shows a tax loss while cash-flowing — sheltering income. Rental losses are passive: they offset passive income freely, and up to $25,000/yr can offset ordinary (W-2) income if you actively participate and your MAGI is under $100k (phasing out to $0 by $150k); unused losses carry forward. On sale, claimed depreciation is recaptured at up to 25%, and gains may owe capital-gains tax (a 1031 exchange can defer both). Figures are a year-1 estimate at your 24.0% rate — not tax advice; consult a CPA.
Schools (NCES district)
- District
- Ascension Parish
- NCES district ID
- 2200090
- Math proficiency
- 48% ▼ -31.00%
- Reading proficiency
- 58% ▼ -25.00%
- Median HH income
- $68,423
- Composite
- 47.0/100
- National rank
- #2347
- State rank
- #7 of 98 in LA
Livability — Prairieville
- Score
- 69/100
- State rank
- #70
- US rank
- #8507
Category grades
Schools grade is shown separately in the Schools card above.
Census & demographics
- Census place
- Prairieville, LA
- County
- Ascension Parish · 98,362 people
- City population
- 49,278
- Metro
- Baton Rouge, LA
- Population (ZIP)
- 49,278
- Household income
- $109,404
- Rent vs Own
- Severe rent burden
- 91.0
Population outlook (Ascension County) Hauer SSP2
- Today (2025)
- 145,480 people
- By 2030
- 158,329 · +8.8%
- By 2040
- 183,741 · +26.3%
- By 2050
- 207,615 · +42.7%
- By 2075
- 260,244 · +78.9%
- By 2100
- 289,576 · +99.0%
Race, ethnicity, and origin ACS 2023
- Neighborhood character
- Predominantly White (73%)
- Race & ethnicity
- White 73% Black 15% Two or more races 6% Hispanic / Latino 6% Asian 1%
- Hispanic origin (detail)
- Mexican 2%
- Common ancestry
- Lithuanian 16% Italian 1% Slovak 1%
- Foreign-born
- 4% · Canada
- Languages at home
- 93% English-only · Spanish 4% Other Indo-European 1%
Political lean MEDSL · Ascension
- 2024 margin
- Solid R (+34.0) · D 32.2% · R 66.1% · Other 1.7%
- 2008→2024 swing
- +1.7pp toward D · 2008: -35.7pp · 2024: -34.0pp
- All cycles
- 2024: R+34.0 2020: R+32.5 2016: R+36.0 2012: R+34.3 2008: R+35.7
Not yet ingested
- Civics
- —
Market trends
- HPI YoY
- ▼ -111.56%
- Current HPI
- 144.2267
- Rent YoY
- ▲ 3.47%
- Metro
- Baton Rouge, LA
- State GDP YoY
- ▲ 3.29%
- F500 in state
- 10
Industry mix (Fortune 500 HQ in LA)
| Industry | F500 HQs | Revenue |
|---|---|---|
| Telecommunications | 2 | $23B |
|
||
| Utilities | 1 | $12B |
|
||
| Wholesale / Distribution | 1 | $5B |
|
||
| Advertising | 1 | $2B |
|
||
Price history
-81.2% since first listed6 events — show timeline
- 2026-06-01 Listed $225,000 AcadianaMLS
- 2026-06-01 Listed $225,000 GBRMLS
- 2021-08-24 Sold (Public Records) $6,080,200 Public Records
- 2010-08-12 Sold (Public Records) $142,500 Public Records
- 2010-02-09 Listed $146,500 AcadianaMLS
- 2006-11-02 Sold (Public Records) $1,200,000 Public Records
Property tax history
+0.4%/yrLatest (2025): $1,823 · -1.5% YoY. Source: county tax records.
Cash-flow waterfall
monthlySold comps — $/sqft
last 12 mo · ≤1 miLoading sold comps…