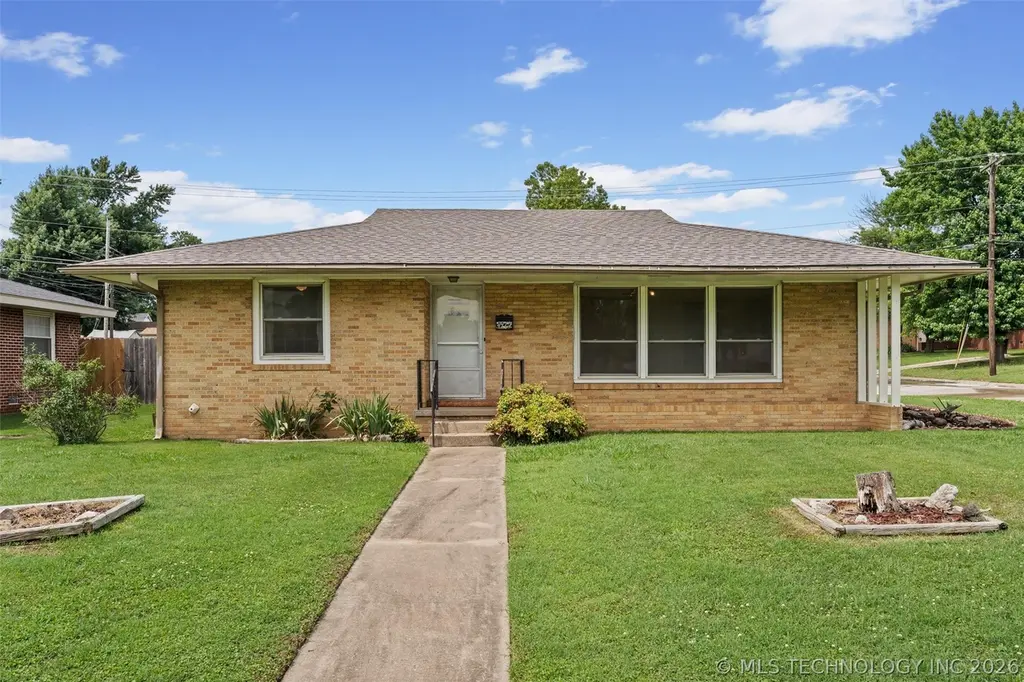
4112 E Frank Phillips Blvd · Bartlesville, OK
Flood risk 1/10 · Minimal
- FEMA flood zone
- X (unshaded)
- Chance of flooding over 30 yrs
- 0.0%
- Est. flood insurance / yr
- $507 – $1,088
Fire risk 6/10 · Moderate
- Est. fire insurance / yr
- $2,463 – $4,575
Heat risk 6/10 · Moderate
- Hot days now (above 112°F)
- 7 days/yr
- Hot days in 30 yrs
- 18 days/yr
Wind risk 2/10 · Minimal
- Chance of severe wind over 30 yrs
- 4.0%
Air-quality risk 2/10 · Minimal
- Unhealthy air days now
- 2 days/yr
- Unhealthy air days in 30 yrs
- 2 days/yr
Risk factors via First Street. Map © Google.
Why this score? — see what drove the C- grade
The composite is a weighted blend of 9 inputs, each scored 0–100. Each bar is that input's sub-score; the figure is the points it added to the 100-point composite (weight × sub-score).
- Cash flow +22.6/30.0
- ARV discount +8.9/15.0
- DSCR +7.3/10.0
- 1% rule +5.1/10.0
- Livability +3.2/5.0
- Schools +2.6/10.0
- Rent growth +2.5/5.0
- Condition / age +2.5/5.0
- Appreciation +0.0/10.0
$145,000
🖨 Deal sheet (PDF) 📄 Offer letter ✓ Due diligence
Listing remarks MLS
WONDERFUL HOME, 2 OR 3 BRS, 2 BATH, 2 C. GARAGE. CORNER LOT, AC, FURNACE & HOT WTR HTR NEW IN 2001. SCREENED PATIO, STORAGE SHED, ROOF 2000. NEWER VINYL TILT WINDOWS. ATTIC FAN NOT USED BY CURRENT SELLERS, BUT WAS WKING WHEN HM WAS PURCHASED, NOT WARRNTD
Key facts
- Vinyl windows
- Brand new roof
- Newer lvp flooring
Tags
Property features AI
Finance
- HOA & community: Gutters noted as a community feature
Exterior
- Parking: Attached garage (2 spaces)
- Security: Smoke detector(s); No safety shelter
- Utilities: Public water; Public sewer; Electricity available; Natural gas available; Cable available; Phone available
- Home design: Single-story; Crawlspace foundation; Brick and wood frame construction; Asphalt/fiberglass roof
- Construction: Built as indicated in public records
- Exterior features: Enclosed patio; Patio; Concrete driveway; Rain gutters; Shed(s); Full chain link fencing; Corner lot; South-facing
Interior
- Kitchen: Built-in oven; Cooktop; Dishwasher; Microwave; Range; Plumbed for ice maker
- Bedrooms: Master bedroom (first level); Bedroom (first level)
- Flooring: Carpet
- Bathrooms: 2 full bathrooms
- Heating & cooling: Central heating (gas); Central air conditioning
- Interior features: Ceiling fan(s); Cable TV; Laminate counters; Insulated doors; Vinyl insulated windows; Electric oven and range connections
- Laundry & utility: Washer hookup; Inside separate utility room; Gas water heater
Neighborhood map
What this means for you Summary
Snapshot
- This is a 3-bed/1.5-bath single-family listed at $145k.
Deal economics
- At list price, monthly cash flow is $248 ($3k/yr) — positive.
- The deal already cash-flows at list — no discount required.
- Meets the 1% rule at list price ($1k rent vs $145k).
- Cap rate 8.3% vs local median 4.7% in Bartlesville — top-decile yield for the area; either an underpriced asset or a hidden risk that comps aren't pricing in. Stress-test before assuming the spread holds.
Location & tenants
- Location reads 64/100 on livability (#175 in OK) — a middle-class / working-renter tenant base. Strengths: cost of living A+, housing A+; Watch: employment C-, schools D+, crime D+.
- Bartlesville (town): math 30% / reading 29% proficiency, ranked #59 of 270 in OK (top 22%) — low school quality limits family demand, transient renter base, plan for 1-2y turnover.
- Market conditions: 231 active listings in the ZIP; 6 comparable units currently listed for rent nearby; rentals at typical pace (median 17d on market — plan ~3-4 weeks tenant-placement turnaround); 46 units permitted in Washington County in 2024 (0 in 5+ unit buildings).
Forward outlook
- Local home prices are declining (-3.0%/yr); year-one equity from $1k of loan paydown is wiped out by about $4k of value loss. Plan a longer hold.
- Washington County population projected at +12% by 2050 — modest demand growth; plan on rents tracking national, not racing it.
Negotiation context
- Only 3 days on market — expect competitive offers; lowballing is unlikely to land.
- 6 sale attempts since 29y ago with the ask held roughly flat each time — persistent listings suggest the price (not the market) is what's stuck; bring a comps-based counter.
- Current owner paid $68k; list at $145k implies a 113% gain — meaningful room to come down on a strong offer.
Risks & watch-outs
- Watch-outs: built in 1953 — expect roof / HVAC / electrical / plumbing capex.
- Climate carrying-cost: major wildfire risk; extreme-heat days projected 7→18/yr by 2055 (HVAC capex compounding) — expect insurance premiums to compound above CPI over the hold.
Questions for the listing agent
- Built in 1953 — when were the roof, HVAC, electrical panel, plumbing, and water heater last replaced?
- Is there a deadline driving the sale (1031 exchange, divorce, estate, relocation)? That informs how much negotiation room exists.
- Schools are D-rated, which usually means shorter tenancies and higher turnover. Who's the typical renter profile here, and what's been the actual vacancy rate?
- Crime grade is D in this area — have there been break-ins, vandalism, or insurance claims at this property in the last 3 years? What carrier currently insures it and at what premium?
- What's the average days-on-market for RENTAL listings here right now (not sales)? A rising rental-DOM trend means longer vacancies and softer asking-rent achievability than the comps imply.
- What's the recent tenant-quality profile in this submarket — average credit score on applications, eviction rate, late-payment / NSF rate, and stable-employment percentage? A property-management company in the area should have these aggregated.
- How much new for-sale + rental construction is in the pipeline within 1–3 miles? Heavy new supply typically softens prices + rents 12–24 months out; constrained supply supports both.
Investment metrics
- 1% rule
- 1.01% ✓
- Cap rate
- 8.34%
- Cash-on-cash
- 7.32%
- DSCR
- 1.33
- GRM
- 8.2
CMA / ARV
- ARV (on-the-fly)
- $149,500
- Comps found
- 12
Show comp detail 12 sales within ~0.75 mi
| Address | Dist | Beds/Ba | Sqft | Sold | Price | $/sf | Match |
|---|---|---|---|---|---|---|---|
| 349 Cara Lee Ln | 0.29mi | 3/2.0 | 1,548 (+4%) | 0mo | $203,000 | $131 | 78 |
| 328 SE Waverly Ave | 0.10mi | 3/1.0 | 1,365 (-9%) | 4mo | $144,000 | $105 | 76 |
| 300 SE Waverly Ave | 0.17mi | 3/1.0 | 1,600 (+7%) | 6mo | $134,000 | $84 | 74 |
| 4600 Cara Lee Ln | 0.26mi | 3/2.0 | 1,585 (+6%) | 6mo | $158,000 | $100 | 71 |
| 4105 Fleetwood Dr | 0.20mi | 3/1.0 | 1,314 (-12%) | 2mo | $113,000 | $86 | 67 |
| 313 S Fenway Pl | 0.25mi | 3/2.0 | 1,671 (+12%) | 3mo | $189,900 | $114 | 64 |
| 4932 Amherst Dr | 0.63mi | 3/1.5 | 1,416 (-5%) | 0mo | $151,650 | $107 | 61 |
| 4513 Tuxedo Blvd | 0.44mi | 4/2.0 (+1) | 1,571 (+5%) | 3mo | $103,000 | $66 | 61 |
| 208 NE Spruce Ave | 0.72mi | 3/2.0 | 1,505 (+1%) | 7mo | $166,000 | $110 | 58 |
| 332 Brookline | 0.51mi | 3/2.0 | 1,627 (+9%) | 4mo | $110,000 | $68 | 56 |
| 4947 Baylor Dr | 0.72mi | 3/2.0 | 1,405 (-6%) | 3mo | $120,000 | $85 | 52 |
| 4944 Cornell Dr | 0.72mi | 3/1.5 | 1,608 (+8%) | 4mo | $152,000 | $95 | 50 |
Match score weights: distance 35% · size 25% · config 20% · recency 20%. Top-matched comps best support the ARV.
Projected returns pro-forma
-3.0% appreciation · 3.0% rent growth · sell at horizon
- IRR
- -5.1%
- Equity multiple
- 0.81×
- Total profit
- $-7,751
- Equity at exit
- $21,620
- IRR
- 4.5%
- Equity multiple
- 1.33×
- Total profit
- $13,429
- Equity at exit
- $12,537
Cash invested: $40,600 (down + closing). Projections, not guarantees.
Landlord ↔ Tenant lean methodology
- Overall (STATE)
- 83 Strongly Landlord-Friendly
- State Oklahoma
- 83 Strongly Landlord-Friendly · R+20
- County
- — inherits STATE
- City
- — inherits STATE
ZIP-level market 74006
- Home prices YoY
- -33.2%
- Active inventory
- 231
- Price-to-rent
- 8.2×
Monthly cashflow live
- Estimated rent
- $1,465 high interval (Pro) →
- Mortgage (P&I)
- −$760
- Tax from tax record
- −$89 /mo · $1,070/yr
- Insurance
- −$60
- HOA
- −$0
- Vacancy / Maint / Mgmt
- −$308
- Net cashflow
- $248
Break-even live
Sensitivity live
| Price | -10% $330 | -5% $289 | +0% $248 | +5% $207 | +10% $166 |
|---|---|---|---|---|---|
| Rent | -10% $132 | -5% $190 | +0% $248 | +5% $306 | +10% $364 |
| Rate | -1.0pp $321 | -0.5pp $285 | base $248 | +0.5pp $210 | +1.0pp $172 |
UW: 25.0% down · 7.5% · 30yr · 1.5% tax · 5.0% vac · 8.0% maint · 8.0% mgmt
Financing live
Cash to close
- Down payment
- $36,250
- Closing costs
- $4,350
- Reserves months
- —
- Total cash needed
- —
Loan-product check · same deal, 3 products live
Conventional
25% down · 7.5% · 30yr
- Down + closing
- —
- Monthly P&I
- —
- Monthly cashflow
- —
- DSCR
- —
- Eligible?
- —
Personal DTI + credit; lowest rate.
DSCR
20% down · 8.5% · 30yr
- Down + closing
- —
- Monthly P&I
- —
- Monthly cashflow
- —
- DSCR
- —
- Eligible?
- —
No personal income docs; deal must DSCR.
Hard money
10% down · 12.0% · 12mo
- Down + closing
- —
- Monthly P&I
- —
- Monthly cashflow
- —
- DSCR
- —
- Eligible?
- —
Short-term bridge; refi at stabilization.
Rent comps 6 comps
| Address | Beds | Baths | Sqft | Rent | $/sqft | DOM | Units | Dist |
|---|---|---|---|---|---|---|---|---|
| 4715 SE Adams Blvd Unit 905D Bartlesville, OK | 2.0 | 2.0 | 953 | $900 | $0.94 | 12d | 1 | 0.73mi |
| 5610 Baylor Dr Bartlesville, OK | 3.0 | 2.0 | 1407 | $1,500 | $1.07 | 3d | 1 | 0.89mi |
| 437 NE Myers Ave Bartlesville, OK | 4.0 | 2.0 | 1405 | $1,500 | $1.07 | 12d | 1 | 0.90mi |
| 5530 Colony Way Bartlesville, OK | 1.0–2.0 | 1.0–2.5 | 1176 | $1,399 | $1.19 | 24d | 4 | 1.03mi |
| 4714 NE Wisconsin St Bartlesville, OK | 3.0 | 2.0 | 1500 | $1,350 | $0.90 | 16d | 1 | 1.20mi |
| 4716 NE Wisconsin St Bartlesville, OK | 3.0 | 2.0 | 1161 | $1,350 | $1.16 | 24d | 1 | 1.20mi |
Listing history 4 events
-
2026-06-09status $145,000 Pending 3 DOM
-
2026-06-08days on market $145,000 Active 3 DOM
-
2026-06-07remarks 699-char remark
-
2026-06-07$145,000 Active 2 DOM
ⓘ Source: listings_history table (triggers on properties + properties_extension) + one-shot
backfill from property_details.listing_events for pre-trigger history.
Tax reassessment forecast OK · Resets to sale price
- Current annual tax
- $1,070 · $89/mo
- Projected year-2 tax
- $1,305 · $109/mo
- Expected delta
- +$235/yr (+$20/mo · 22.0%)
ⓘ Screening estimate from a state-policy table — verify with the county assessor before closing.
Climate risk First Street
- Flood 1/10 Low FEMA zone X (unshaded) · 0% chance over 30 yrs
- Wildfire 6/10 Major
- Heat 6/10 Major 7 d/yr ≥112°F today · 18 d/yr by 30 yrs out
- Wind 2/10 Low 4% chance of damaging wind over 30 yrs
- Air quality 2/10 Low 2 unhealthy d/yr today · 2 by 30 yrs out
Nearby sold comps map
Loading sold comps map…
Walkable amenities ~0.75 mi
Loading nearby amenities…
Taxation est. · year 1
- Rental income
- $17,586
- − Mortgage interest
- −$8,122
- − Property taxes
- −$1,070
- − Insurance
- −$725
- − Repairs & maintenance
- −$1,407
- − Management
- −$1,407
- − Depreciation
- −$4,218
- Taxable income
- $637
- Est. tax owed @ 24.0%
- −$153
- After-tax cash flow
- $2,820/yr
For passive investors: Depreciation is non-cash, so a rental often shows a tax loss while cash-flowing — sheltering income. Rental losses are passive: they offset passive income freely, and up to $25,000/yr can offset ordinary (W-2) income if you actively participate and your MAGI is under $100k (phasing out to $0 by $150k); unused losses carry forward. On sale, claimed depreciation is recaptured at up to 25%, and gains may owe capital-gains tax (a 1031 exchange can defer both). Figures are a year-1 estimate at your 24.0% rate — not tax advice; consult a CPA.
Schools (NCES district)
- District
- Bartlesville
- NCES district ID
- 4003630
- Math proficiency
- 30% ▼ -13.00%
- Reading proficiency
- 29% ▼ -10.00%
- Median HH income
- $48,889
- Composite
- 25.69/100
- National rank
- #7389
- State rank
- #59 of 270 in OK
Livability — Bartlesville
- Score
- 64/100
- State rank
- #175
- US rank
- #13940
Category grades
Schools grade is shown separately in the Schools card above.
Census & demographics
- Census place
- Bartlesville, OK
- County
- Washington County · 41,935 people
- City population
- 41,935
- Metro
- Bartlesville, OK
- Population (ZIP)
- 27,911
- Household income
- $71,796
- Rent vs Own
- Severe rent burden
- 563.0
Population outlook (Washington County) Hauer SSP2
- Today (2025)
- 54,946 people
- By 2030
- 56,249 · +2.4%
- By 2040
- 58,867 · +7.1%
- By 2050
- 61,600 · +12.1%
- By 2075
- 69,355 · +26.2%
- By 2100
- 73,067 · +33.0%
Race, ethnicity, and origin ACS 2023
- Neighborhood character
- Predominantly White (74%)
- Race & ethnicity
- White 74% Two or more races 9% Native American 7% Hispanic / Latino 6% Asian 3% Black 3%
- Hispanic origin (detail)
- Mexican 5%
- Common ancestry
- Lithuanian 3% Slovak 2% Serbian 2%
- Foreign-born
- 5% · Canada, China, Vietnam
- Languages at home
- 93% English-only · Spanish 4% Vietnamese 1% Chinese 1%
Political lean MEDSL · Washington
- 2024 margin
- Solid R (+47.6) · D 25.0% · R 72.7% · Other 2.4%
- 2008→2024 swing
- -3.1pp toward R · 2008: -44.6pp · 2024: -47.6pp
- All cycles
- 2024: R+47.6 2020: R+48.0 2016: R+48.5 2012: R+47.8 2008: R+44.6
Not yet ingested
- Civics
- —
Market trends
- HPI YoY
- ▼ -118.35%
- Current HPI
- 237.9056
- Rent YoY
- —
- Metro
- Bartlesville, OK
- State GDP YoY
- ▲ 1.55%
- F500 in state
- 6
Industry mix (Fortune 500 HQ in OK)
| Industry | F500 HQs | Revenue |
|---|---|---|
| Energy | 3 | $48B |
|
||
Price history
+168.5% since first listed14 events — show timeline
- 2026-06-05 Listed $145,000 MLS Technology, Inc.
- 2005-03-23 Sold (Public Records) $68,000 Public Records
- 2005-03-18 Sold (MLS) $68,000 MLS Technology, Inc.
- 2005-02-15 Listing Removed — MLS Technology, Inc.
- 2005-01-12 Listed $74,900 MLS Technology, Inc.
- 2002-07-11 Sold (Public Records) $62,000 Public Records
- 2002-07-11 Sold (MLS) $62,000 MLS Technology, Inc.
- 2002-06-21 Listing Removed — MLS Technology, Inc.
- 2002-05-16 Listing Removed — MLS Technology, Inc.
- 2002-05-16 Listed $64,900 MLS Technology, Inc.
- 2002-03-26 Listed $66,000 MLS Technology, Inc.
- 1999-08-13 Sold (Public Records) $57,000 Public Records
- 1999-05-10 Listed $59,900 MLS Technology, Inc.
- 1997-03-05 Listed $54,000 MLS Technology, Inc.
Property tax history
+2.3%/yrLatest (2025): $1,070 · -7.6% YoY. Source: county tax records.
Cash-flow waterfall
monthlySold comps — $/sqft
last 12 mo · ≤1 miLoading sold comps…