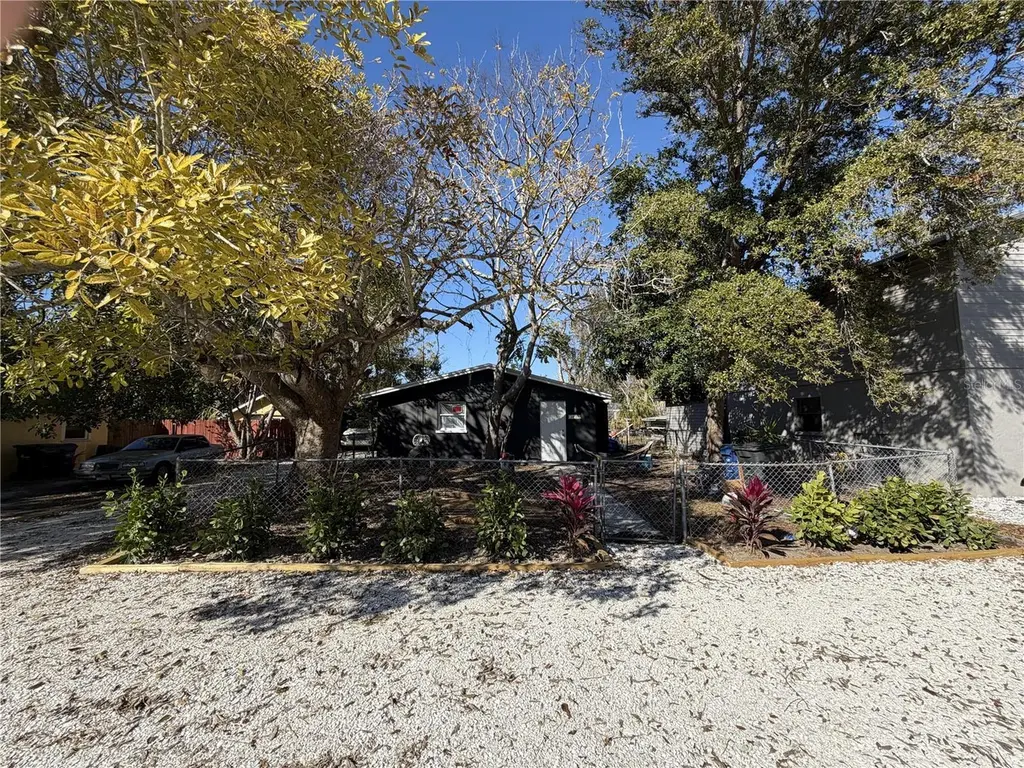
 Duplex
2027 Florinda St · South Sarasota, FL
Flood risk 1/10 · Minimal
- FEMA flood zone
- X (unshaded)
- Chance of flooding over 30 yrs
- 0.0%
- Est. flood insurance / yr
- $507 – $1,088
Fire risk 1/10 · Minimal
- Est. fire insurance / yr
- $947 – $1,759
Heat risk 10/10 · Severe
- Hot days now (above 107°F)
- 7 days/yr
- Hot days in 30 yrs
- 28 days/yr
Wind risk 10/10 · Severe
- Chance of severe wind over 30 yrs
- 99.0%
Air-quality risk 2/10 · Minimal
- Unhealthy air days now
- 1 days/yr
- Unhealthy air days in 30 yrs
- 1 days/yr
Risk factors via First Street. Map © Google.
Why this score? — see what drove the D grade
The composite is a weighted blend of 9 inputs, each scored 0–100. Each bar is that input's sub-score; the figure is the points it added to the 100-point composite (weight × sub-score).
- Cash flow +14.9/30.0
- ARV discount +7.5/15.0
- Schools +5.4/10.0
- DSCR +4.6/10.0
- Livability +3.7/5.0
- 1% rule +3.4/10.0
- Condition / age +2.5/5.0
- Rent growth +2.0/5.0
- Appreciation +0.0/10.0
$450,000
🖨 Deal sheet (PDF) 📄 Offer letter ✓ Due diligence
Multi-family units
County records classify this as Multi-Family (2-4 Unit). Listing-text estimate: 2 units. confirmed
Listing remarks
Excellent investment opportunity with this solid block duplex in a desirable Sarasota location, offering strong in-place income and long-term upside. Two units both 2 bedroom 1 bathroom. One unit has been recently updated with a brand-new kitchen, newer tile flooring, and an updated bathroom, currently rented at $1,800/month. The second unit is in good condition with a long-term tenant in place paying $1,425/month, providing stable cash flow from day one. Tenants pay utilities, helping keep operating expenses lower for ownership. Additional improvements include freshly painted exterior, fully stoned driveway, adding additional parking, fresh landscaping, a 2019 roof and newer HVAC systems,
Key facts
- Solid block duplex
- Brand new kitchen
- Newer tile flooring
Tags
Property features AI
Finance
- Other: Property zoning: RSF3; Total lot size about 0.15 acres (50x128)
- Financial info: Gross income reported at $38,700; Estimated annual market income $43,200; Annual net income $32,200; Annual expenses $6,500; Total monthly expenses approximately $542; Tenants pay electricity, sewer and water
- HOA & community: No HOA
Exterior
- Parking: No parking information provided
- Security: No security features listed
- Utilities: Public water; Public sewer; Cable connected; Electricity connected; Water connected; Sewer connected; Two separate water meters
- Home design: Residential income property (duplex); Single building; Slab foundation
- Construction: Block and stucco construction; Shingle roof
- Exterior features: Asphalt road frontage; Lot dimensions about 50 x 128
Interior
- Kitchen: No appliances or kitchen details provided
- Bedrooms: 4 bedrooms total; Two 2-bedroom units (each unit described under unit types)
- Flooring: No flooring information provided
- Bathrooms: Each unit has 1 bathroom
- Heating & cooling: Central heating; Central air conditioning
- Interior features: No notable interior features listed
- Laundry & utility: Laundry located outside
Neighborhood map
What this means for you Summary
Snapshot
- This is a 2 × 2-bed/1-bath units multifamily listed at $450k.
Deal economics
- At list price, monthly cash flow is $136 ($2k/yr) — positive. Per door: $68/mo.
- The deal already cash-flows at list — no discount required.
- To meet the 1% rule (rent ≥ 1% of price), the offer needs to be $378k (16.0% below list).
- Recommended offer: $378k (16.0% below list) — sets the bar for 1% rule.
Location & tenants
- Location reads 74/100 on livability (#278 in FL, #4,455 nationally) — a middle-class / working-renter tenant base. Strengths: crime A+, employment A+, health & safety A+; Watch: amenities F, commute F, cost of living F.
- Sarasota (urban): math 63% / reading 63% proficiency, ranked #7 of 73 in FL (top 10%) — acceptable for families but not a draw, mixed tenant base, ~2y average lease.
- Zoned schools: Phillippi Shores Elementary School (math 77% / reading 79%, grade A, #149 of 2,144 statewide, top 8%, 731 students, 38% FRL); Brookside Middle School (math 62% / reading 55%, grade B, #148 of 571 statewide, top 26%, 745 students, 66% FRL); Riverview High School (math 61% / reading 65%, grade B-, #89 of 667 statewide, top 14%, 2,597 students, 35% FRL) — zoned schools at 47% FRL track the district average.
- Market conditions: Rents soft (-2.1%/yr); 566 active listings in the ZIP; 7,466 units permitted in Sarasota County in 2024 (2,138 in 5+ unit buildings).
- At $3,782/mo this rent would consume 65% of the median local household income ($70k/yr) (locally 1983% of renters already pay >50% of income on rent) — very limited rent-growth headroom before tenants either downsize or default.
Forward outlook
- Local home prices are declining (-3.0%/yr); year-one equity from $3k of loan paydown is wiped out by about $14k of value loss. Plan a longer hold.
- Sarasota County population projected at +20% by 2050 — long-run rental-demand tailwind backs the buy-and-hold thesis.
Negotiation context
- It's been on market 33 days — a 3% lower offer ($436k) is reasonable based on typical stale-listing flexibility.
- 8 sale attempts since 18y ago with the ask held roughly flat each time — persistent listings suggest the price (not the market) is what's stuck; bring a comps-based counter.
- Current owner paid $350k; 29% above their basis — modest negotiation headroom, anchor on the comps not their cost.
Risks & watch-outs
- Climate carrying-cost: severe wind risk, 99% chance of damaging wind over 30y; extreme-heat days projected 7→28/yr by 2055 (HVAC capex compounding) — expect insurance premiums to compound above CPI over the hold.
Questions for the listing agent
- It's been on market 33 days. Have you received any prior offers? Is the seller open to a 16% concession, seller financing, or rate buy-down credit?
- Can we see the unit-by-unit rent roll, current vacancy, and any below-market leases? What's the average tenancy length?
- What capital expenditures (roof, boiler, parking lot, exteriors) have been made in the last 5 years, and what's planned in the next 2?
- Built in 1971 — when were the roof, HVAC, electrical panel, plumbing, and water heater last replaced?
- Is there a deadline driving the sale (1031 exchange, divorce, estate, relocation)? That informs how much negotiation room exists.
- Schools are A-rated — typically a magnet for longer-tenancy family renters. What's the average tenant stay here, and is there a school-zone premium baked into asking?
- The area grade is low — what's the realistic commute time and amenity access for the typical tenant pool here? Any planned neighborhood developments (good or bad) we should know about?
- What's the average days-on-market for RENTAL listings here right now (not sales)? A rising rental-DOM trend means longer vacancies and softer asking-rent achievability than the comps imply.
- What's the recent tenant-quality profile in this submarket — average credit score on applications, eviction rate, late-payment / NSF rate, and stable-employment percentage? A property-management company in the area should have these aggregated.
- How much new apartment / multifamily construction is in the pipeline within 1–3 miles? Heavy new supply (>2% of stock underway) typically softens rents 12–24 months out; light construction supports rent growth.
Investment metrics
- 1% rule
- 0.84% ✗
- Cap rate
- 6.65%
- Cash-on-cash
- 1.29%
- DSCR
- 1.06
- GRM
- 9.9
CMA / ARV
No comps found within radius.
Projected returns pro-forma
-3.0% appreciation · 0.0% rent growth · sell at horizon
- IRR
- -17.4%
- Equity multiple
- 0.40×
- Total profit
- $-75,464
- Equity at exit
- $67,096
- IRR
- -15.8%
- Equity multiple
- 0.22×
- Total profit
- $-97,833
- Equity at exit
- $38,908
Cash invested: $126,000 (down + closing). Projections, not guarantees.
Landlord ↔ Tenant lean methodology
- Overall (STATE)
- 87 Strongly Landlord-Friendly
- State Florida
- 87 Strongly Landlord-Friendly · R+3
- County
- — inherits STATE
- City
- — inherits STATE
ZIP-level market 34231
- Rents YoY
- -2.1%
- Active inventory
- 566
- Price-to-rent
- 19.8×
Monthly cashflow live
- Estimated rent
- $3,782 medium interval (Pro) →
- Mortgage (P&I)
- −$2,360
- Tax from tax record
- −$305 /mo · $3,657/yr
- Insurance
- −$188
- HOA
- −$0
- Vacancy / Maint / Mgmt
- −$794
- Net cashflow
- $136
Break-even live
Sensitivity live
| Price | -10% $390 | -5% $263 | +0% $136 | +5% $8 | +10% $-119 |
|---|---|---|---|---|---|
| Rent | -10% $-163 | -5% $-14 | +0% $136 | +5% $285 | +10% $434 |
| Rate | -1.0pp $362 | -0.5pp $250 | base $136 | +0.5pp $19 | +1.0pp $-100 |
2-unit breakdown (identical units grouped — click to expand)
| Units | Beds | Baths | Est. rent |
|---|---|---|---|
| 2× units | 2 | 1 | $3,782 |
| #1 | 2 | 1 | $1,891 |
| #2 | 2 | 1 | $1,891 |
| Total (2 units) | $3,782 | ||
UW: 25.0% down · 7.5% · 30yr · 1.5% tax · 5.0% vac · 8.0% maint · 8.0% mgmt
Financing live
Cash to close
- Down payment
- $112,500
- Closing costs
- $13,500
- Reserves months
- —
- Total cash needed
- —
Loan-product check · same deal, 3 products live
Conventional
25% down · 7.5% · 30yr
- Down + closing
- —
- Monthly P&I
- —
- Monthly cashflow
- —
- DSCR
- —
- Eligible?
- —
Personal DTI + credit; lowest rate.
DSCR
20% down · 8.5% · 30yr
- Down + closing
- —
- Monthly P&I
- —
- Monthly cashflow
- —
- DSCR
- —
- Eligible?
- —
No personal income docs; deal must DSCR.
Hard money
10% down · 12.0% · 12mo
- Down + closing
- —
- Monthly P&I
- —
- Monthly cashflow
- —
- DSCR
- —
- Eligible?
- —
Short-term bridge; refi at stabilization.
Listing history 37 events
-
2026-06-21days on market $450,000 Active 33 DOM
-
2026-06-18days on market $450,000 Active 30 DOM
-
2026-06-17days on market $450,000 Active 29 DOM
-
2026-06-16days on market $450,000 Active 28 DOM
-
2026-06-15days on market $450,000 Active 27 DOM
-
2026-06-13days on market $450,000 Active 25 DOM
-
2026-06-13days on market $450,000 Active 24 DOM
-
2026-06-10days on market $450,000 Active 22 DOM
-
2026-06-09days on market $450,000 Active 21 DOM
-
2026-06-08days on market $450,000 Active 20 DOM
-
2026-06-08days on market $450,000 Active 19 DOM
-
2026-06-05days on market $450,000 Active 16 DOM
-
2026-06-03days on market $450,000 Active 15 DOM
-
2026-06-02days on market $450,000 Active 14 DOM
-
2026-06-01days on market $450,000 Active 13 DOM
-
2026-05-31days on market $450,000 Active 12 DOM
-
2026-05-19$450,000 Active
-
2025-12-19soldstatus $350,000
-
2014-08-05historical
-
2014-08-05historical
-
2014-06-10historical
-
2014-06-10historical
-
2014-04-07price $141,111 Active
-
2014-04-07status Active
-
2014-03-29historical
-
2014-03-29price $141,111
-
2014-03-28status Active
-
2014-03-28status Active
-
2014-02-04$142,000 Active
-
2014-02-04$142,000 Active
-
2009-05-13historical
-
2009-05-11soldstatus $102,000
-
2009-05-07soldstatus $102,000
-
2009-04-03$104,900
-
2008-12-11$104,900
-
2002-05-13soldstatus $130,000
-
1992-10-26soldstatus $72,000
ⓘ Source: listings_history table (triggers on properties + properties_extension) + one-shot
backfill from property_details.listing_events for pre-trigger history.
Tax reassessment forecast FL · Resets to sale price
- Current annual tax
- $3,657 · $305/mo
- Projected year-2 tax
- $3,735 · $311/mo
- Expected delta
- +$78/yr (+$6/mo · 2.1%)
ⓘ Screening estimate from a state-policy table — verify with the county assessor before closing.
Climate risk First Street
- Flood 1/10 Low FEMA zone X (unshaded) · 0% chance over 30 yrs
- Wildfire 1/10 Low
- Heat 10/10 Extreme 7 d/yr ≥107°F today · 28 d/yr by 30 yrs out
- Wind 10/10 Extreme 99% chance of damaging wind over 30 yrs
- Air quality 2/10 Low 1 unhealthy d/yr today · 1 by 30 yrs out
Nearby sold comps map
Loading sold comps map…
Walkable amenities ~0.75 mi
Loading nearby amenities…
Taxation est. · year 1
- Rental income
- $45,384
- − Mortgage interest
- −$25,207
- − Property taxes
- −$3,657
- − Insurance
- −$2,250
- − Repairs & maintenance
- −$3,631
- − Management
- −$3,631
- − Depreciation
- −$13,091
- Taxable loss
- −$6,083
- Est. tax savings @ 24.0%
- +$1,460
- After-tax cash flow
- $3,088/yr
For passive investors: Depreciation is non-cash, so a rental often shows a tax loss while cash-flowing — sheltering income. Rental losses are passive: they offset passive income freely, and up to $25,000/yr can offset ordinary (W-2) income if you actively participate and your MAGI is under $100k (phasing out to $0 by $150k); unused losses carry forward. On sale, claimed depreciation is recaptured at up to 25%, and gains may owe capital-gains tax (a 1031 exchange can defer both). Figures are a year-1 estimate at your 24.0% rate — not tax advice; consult a CPA.
Schools (NCES district)
- District
- Sarasota
- NCES district ID
- 1201680
- Math proficiency
- 63% ▼ -8.00%
- Reading proficiency
- 63% ▼ -3.00%
- Median HH income
- $51,167
- Composite
- 53.68/100
- National rank
- #1428
- State rank
- #7 of 73 in FL
Livability — South Sarasota
- Score
- 74/100
- State rank
- #278
- US rank
- #4455
Category grades
Schools grade is shown separately in the Schools card above.
Census & demographics
- Census place
- South Sarasota, FL
- County
- Sarasota County · 448,376 people
- Metro
- North Port-Sarasota-Bradenton, FL
- Population (ZIP)
- 32,404
- Household income
- $69,925
- Rent vs Own
- Severe rent burden
- 1983.0
Population outlook (Sarasota County) Hauer SSP2
- Today (2025)
- 452,380 people
- By 2030
- 474,175 · +4.8%
- By 2040
- 511,577 · +13.1%
- By 2050
- 541,467 · +19.7%
- By 2075
- 604,947 · +33.7%
- By 2100
- 621,965 · +37.5%
Race, ethnicity, and origin ACS 2023
- Neighborhood character
- Predominantly White (86%)
- Race & ethnicity
- White 86% Hispanic / Latino 10% Two or more races 7% Black 2%
- Hispanic origin (detail)
- Mexican 2%
- Common ancestry
- Romanian 4% Slovak 3% Lithuanian 3%
- Foreign-born
- 11% · Canada, Jamaica, China
- Languages at home
- 88% English-only · Spanish 6% Russian/Polish/Slavic 2% German/W. Germanic 1%
Political lean MEDSL · Sarasota
- 2024 margin
- R (+18.2) · D 40.5% · R 58.7%
- 2008→2024 swing
- -18.1pp toward R · 2008: -0.1pp · 2024: -18.2pp
- All cycles
- 2024: R+18.2 2020: R+10.4 2016: R+11.6 2012: R+7.4 2008: R+0.1
Not yet ingested
- Civics
- —
Market trends
- HPI YoY
- ▼ -448.92%
- Current HPI
- 292.9055
- Rent YoY
- ▼ -2.13%
- Metro
- North Port-Sarasota-Bradenton, FL
- State GDP YoY
- ▲ 3.28%
- F500 in state
- 36
Industry mix (Fortune 500 HQ in FL)
| Industry | F500 HQs | Revenue |
|---|---|---|
| Industrial Technology | 2 | $29B |
|
||
| Insurance | 2 | $17B |
|
||
| Retail | 1 | $60B |
|
||
| Technology Distribution | 1 | $58B |
|
||
| Homebuilding | 1 | $35B |
|
||
| Technology Manufacturing | 1 | $35B |
|
||
Price history
+525.0% since first listed21 events — show timeline
- 2026-05-19 Listed $450,000 Stellar MLS as Distributed by MLS Grid
- 2025-12-19 Sold (Public Records) $350,000 Public Records
- 2014-08-05 Listing Removed — Stellar MLS as Distributed by MLS Grid
- 2014-08-05 Listing Removed — Stellar MLS as Distributed by MLS Grid
- 2014-06-10 Listing Removed — Stellar MLS as Distributed by MLS Grid
- 2014-06-10 Listing Removed — Stellar MLS as Distributed by MLS Grid
- 2014-04-07 Relisted — Stellar MLS as Distributed by MLS Grid
- 2014-04-07 Price Changed $141,111 Stellar MLS as Distributed by MLS Grid
- 2014-03-29 Listing Removed — Stellar MLS as Distributed by MLS Grid
- 2014-03-29 Price Changed $141,111 Stellar MLS as Distributed by MLS Grid
- 2014-03-28 Relisted — Stellar MLS as Distributed by MLS Grid
- 2014-03-28 Relisted — Stellar MLS as Distributed by MLS Grid
- 2014-02-04 Listed $142,000 Stellar MLS as Distributed by MLS Grid
- 2014-02-04 Listed $142,000 Stellar MLS as Distributed by MLS Grid
- 2009-05-13 Listing Removed — Stellar MLS as Distributed by MLS Grid
- 2009-05-11 Sold (MLS) $102,000 Stellar MLS as Distributed by MLS Grid
- 2009-05-07 Sold (Public Records) $102,000 Public Records
- 2009-04-03 Listed $104,900 Stellar MLS as Distributed by MLS Grid
- 2008-12-11 Listed $104,900 Stellar MLS as Distributed by MLS Grid
- 2002-05-13 Sold (Public Records) $130,000 Public Records
- 1992-10-26 Sold (Public Records) $72,000 Public Records
Property tax history
+6.3%/yrLatest (2025): $3,657 · +4.3% YoY. Source: county tax records.
Cash-flow waterfall
monthlySold comps — $/sqft
last 12 mo · ≤1 miLoading sold comps…