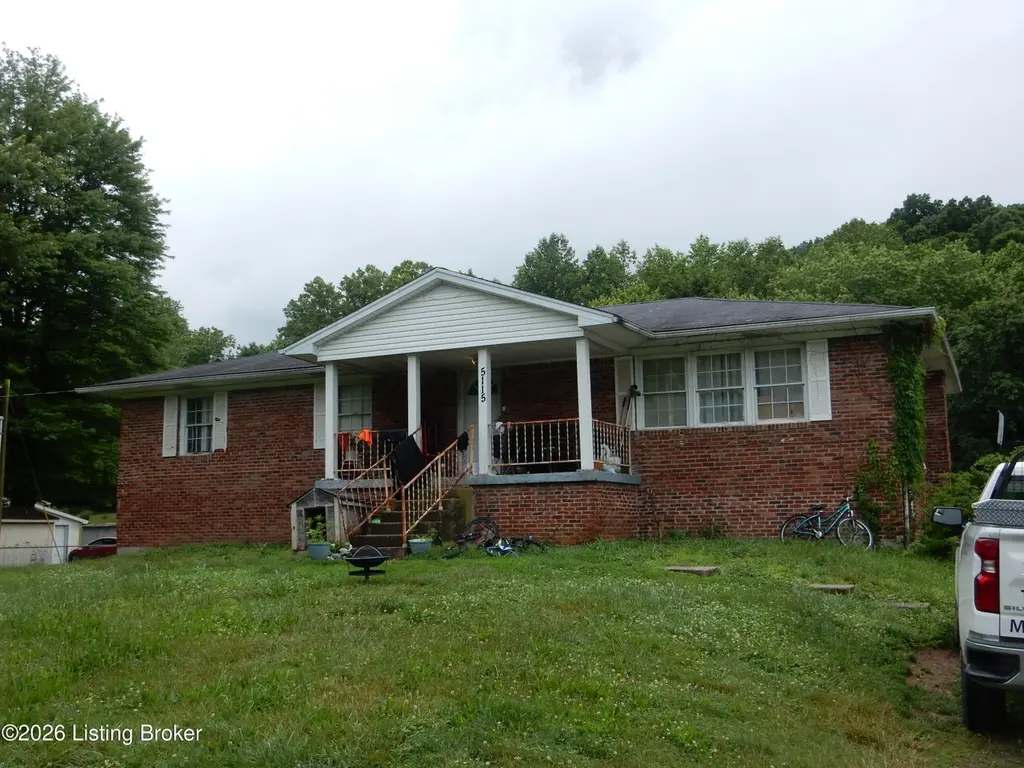
5115 Knob Creek Rd · Louisville/Jefferson County metro government (balance), KY
Flood risk 1/10 · Minimal
- FEMA flood zone
- X (unshaded)
- Chance of flooding over 30 yrs
- 0.0%
- Est. flood insurance / yr
- $473 – $860
Fire risk 5/10 · Moderate
- Est. fire insurance / yr
- $839 – $1,559
Heat risk 5/10 · Moderate
- Hot days now (above 105°F)
- 7 days/yr
- Hot days in 30 yrs
- 20 days/yr
Wind risk 2/10 · Minimal
- Chance of severe wind over 30 yrs
- 3.0%
Air-quality risk 3/10 · Minor
- Unhealthy air days now
- 2 days/yr
- Unhealthy air days in 30 yrs
- 5 days/yr
Risk factors via First Street. Map © Google.
Why this score? — see what drove the D grade
The composite is a weighted blend of 9 inputs, each scored 0–100. Each bar is that input's sub-score; the figure is the points it added to the 100-point composite (weight × sub-score).
- Cash flow +16.2/30.0
- ARV discount +7.5/15.0
- DSCR +5.0/10.0
- 1% rule +3.1/10.0
- Schools +3.1/10.0
- Rent growth +2.5/5.0
- Livability +2.5/5.0
- Condition / age +2.5/5.0
- Appreciation +0.0/10.0
$158,000
🖨 Deal sheet (PDF) 📄 Offer letter ✓ Due diligence
Listing remarks MLS
5 BR, 3 BA home has walk-out full basement with Family Room, Rec Room, 2 BR, full BA & E-I kitchen. All rooms are large. Laundry on both floors. 2 car det garage. All on 1 acre. Approx 15 minutes to UPS & Ford Plant on Fern Valley Rd.
Key facts
- Rural feel
- Walkout ranch
- All brick
Tags
Property features AI
Finance
- Other: Approximately 1.03-acre lot
- HOA & community: No association fee
Exterior
- Parking: Detached 2-car garage
- Utilities: Electricity connected; Propane service available
- Home design: Single-family ranch home; Single-story (1 story); Primary entries and main living on the first floor
- Construction: Built in 1985; Shingle roof; Poured concrete foundation
- Exterior features: Irregular lot; No fencing; Lot dimensions approximately 104 x 432
Interior
- Kitchen: Eat-in kitchen on the first floor
- Bedrooms: Three bedrooms, all on the first floor; Primary bedroom on the first floor with primary bathroom on the first floor
- Bathrooms: Two full bathrooms, both on the first floor; Primary full bathroom on the first floor
- Heating & cooling: Forced air heating (propane); Central air conditioning
- Interior features: Unfinished walkout basement; One fireplace (located in the basement); Seven closets; Seven total rooms; Utility room in main level; Other finished/usable space in basement
- Laundry & utility: First-floor laundry; Main-level utility room
Neighborhood map
What this means for you Summary
Snapshot
- This is a 3-bed/2.0-bath other listed at $158k.
Deal economics
- At list price, monthly cash flow is $84 ($1k/yr) — positive.
- The deal already cash-flows at list — no discount required.
- To meet the 1% rule (rent ≥ 1% of price), the offer needs to be $128k (19.3% below list).
- Recommended offer: $128k (19.3% below list) — sets the bar for 1% rule.
- Cap rate 6.9% vs local median 4.0% in Louisville/Jefferson County metro government (balance) — top-decile yield for the area; either an underpriced asset or a hidden risk that comps aren't pricing in. Stress-test before assuming the spread holds.
Location & tenants
- Location reads: area grade D — affects rentability + tenant quality, not the cash-flow math above.
- Bullitt County (suburban): math 29% / reading 41% proficiency, ranked #55 of 165 in KY (top 33%) — families likely to look elsewhere, expect single-tenant / working-renter base with shorter leases.
- Zoned schools: Nichols Elementary (math 15% / reading 34%, grade F, #487 of 676 statewide, top 72%, 106 students, 62% FRL); Bullitt Lick Middle School (math 17% / reading 32%, grade F, #189 of 217 statewide, top 89%, 461 students, 67% FRL); Bullitt Central High School (math 28% / reading 25%, grade F, #174 of 254 statewide, top 69%, 1,363 students, 53% FRL) — zoned schools average 61% FRL vs 41% district-wide (20 pts higher); higher-poverty schools than district average — tighter screening recommended.
- Market conditions: 31 active listings in the ZIP; 380 units permitted in Bullitt County in 2024 (8 in 5+ unit buildings).
Forward outlook
- Local home prices are declining (-3.0%/yr); year-one equity from $1k of loan paydown is wiped out by about $5k of value loss. Plan a longer hold.
- Bullitt County population projected at +22% by 2050 — long-run rental-demand tailwind backs the buy-and-hold thesis.
Negotiation context
- Only 5 days on market — expect competitive offers; lowballing is unlikely to land.
- 3 sale attempts since 17y ago with the ask held roughly flat each time — persistent listings suggest the price (not the market) is what's stuck; bring a comps-based counter.
- Current owner paid $131k; 21% above their basis — modest negotiation headroom, anchor on the comps not their cost.
Risks & watch-outs
- Climate carrying-cost: moderate wildfire risk; extreme-heat days projected 7→20/yr by 2055 (HVAC capex compounding) — expect insurance premiums to compound above CPI over the hold.
Questions for the listing agent
- Is there a deadline driving the sale (1031 exchange, divorce, estate, relocation)? That informs how much negotiation room exists.
- The area grade is low — what's the realistic commute time and amenity access for the typical tenant pool here? Any planned neighborhood developments (good or bad) we should know about?
- What's the average days-on-market for RENTAL listings here right now (not sales)? A rising rental-DOM trend means longer vacancies and softer asking-rent achievability than the comps imply.
- What's the recent tenant-quality profile in this submarket — average credit score on applications, eviction rate, late-payment / NSF rate, and stable-employment percentage? A property-management company in the area should have these aggregated.
- How much new for-sale + rental construction is in the pipeline within 1–3 miles? Heavy new supply typically softens prices + rents 12–24 months out; constrained supply supports both.
Investment metrics
- 1% rule
- 0.81% ✗
- Cap rate
- 6.93%
- Cash-on-cash
- 2.29%
- DSCR
- 1.10
- GRM
- 10.3
CMA / ARV
No comps found within radius.
Projected returns pro-forma
-3.0% appreciation · 3.0% rent growth · sell at horizon
- IRR
- -12.7%
- Equity multiple
- 0.54×
- Total profit
- $-20,307
- Equity at exit
- $23,558
- IRR
- -3.8%
- Equity multiple
- 0.75×
- Total profit
- $-11,099
- Equity at exit
- $13,661
Cash invested: $44,240 (down + closing). Projections, not guarantees.
Landlord ↔ Tenant lean methodology
- Overall (STATE)
- 83 Strongly Landlord-Friendly
- State Kentucky
- 83 Strongly Landlord-Friendly · R+16
- County
- — inherits STATE
- City
- — inherits STATE
ZIP-level market 40109
- Home prices YoY
- -18.5%
- Active inventory
- 31
- Price-to-rent
- 10.3×
Monthly cashflow live
- Estimated rent
- $1,275 medium interval (Pro) →
- Mortgage (P&I)
- −$829
- Tax from tax record
- −$28 /mo · $341/yr
- Insurance
- −$66
- HOA
- −$0
- Vacancy / Maint / Mgmt
- −$268
- Net cashflow
- $84
Break-even live
Sensitivity live
| Price | -10% $174 | -5% $129 | +0% $84 | +5% $40 | +10% $-194 |
|---|---|---|---|---|---|
| Rent | -10% $-16 | -5% $34 | +0% $84 | +5% $135 | +10% $185 |
| Rate | -1.0pp $164 | -0.5pp $125 | base $84 | +0.5pp $44 | +1.0pp $2 |
UW: 25.0% down · 7.5% · 30yr · 1.5% tax · 5.0% vac · 8.0% maint · 8.0% mgmt
Financing live
Cash to close
- Down payment
- $39,500
- Closing costs
- $4,740
- Reserves months
- —
- Total cash needed
- —
Loan-product check · same deal, 3 products live
Conventional
25% down · 7.5% · 30yr
- Down + closing
- —
- Monthly P&I
- —
- Monthly cashflow
- —
- DSCR
- —
- Eligible?
- —
Personal DTI + credit; lowest rate.
DSCR
20% down · 8.5% · 30yr
- Down + closing
- —
- Monthly P&I
- —
- Monthly cashflow
- —
- DSCR
- —
- Eligible?
- —
No personal income docs; deal must DSCR.
Hard money
10% down · 12.0% · 12mo
- Down + closing
- —
- Monthly P&I
- —
- Monthly cashflow
- —
- DSCR
- —
- Eligible?
- —
Short-term bridge; refi at stabilization.
Listing history 9 events
-
2026-06-02status $158,000 Pending 5 DOM
-
2026-06-01days on market $158,000 Active 5 DOM
-
2026-05-31days on market $158,000 Active 4 DOM
-
2026-05-27$158,000 Active
-
2011-09-22soldstatus $130,800 242-char remark
Show marketing remark (242 chars)
5 BR, 3 BA home has walk-out full basement with Family Room, Rec Room, 2 BR, full BA & E-I kitchen. All rooms are large. Laundry on both floors. 2 car det garage. All on 1 acre. Approx 15 minutes to UPS & Ford Plant on Fern Valley Rd.
-
2011-07-02$139,000 242-char remark
Show marketing remark (242 chars)
5 BR, 3 BA home has walk-out full basement with Family Room, Rec Room, 2 BR, full BA & E-I kitchen. All rooms are large. Laundry on both floors. 2 car det garage. All on 1 acre. Approx 15 minutes to UPS & Ford Plant on Fern Valley Rd.
-
2010-12-01historical
-
2009-12-01$149,900
-
1998-08-04soldstatus $6,000
ⓘ Source: listings_history table (triggers on properties + properties_extension) + one-shot
backfill from property_details.listing_events for pre-trigger history.
Tax reassessment forecast KY · Resets to sale price
- Current annual tax
- $341 · $28/mo
- Projected year-2 tax
- $1,359 · $113/mo
- Expected delta
- +$1,017/yr (+$85/mo · 298.0%)
ⓘ Screening estimate from a state-policy table — verify with the county assessor before closing.
Climate risk First Street
- Flood 1/10 Low FEMA zone X (unshaded) · 0% chance over 30 yrs
- Wildfire 5/10 Major
- Heat 5/10 Major 7 d/yr ≥105°F today · 20 d/yr by 30 yrs out
- Wind 2/10 Low 3% chance of damaging wind over 30 yrs
- Air quality 3/10 Moderate 2 unhealthy d/yr today · 5 by 30 yrs out
Nearby sold comps map
Loading sold comps map…
Walkable amenities ~0.75 mi
Loading nearby amenities…
Taxation est. · year 1
- Rental income
- $15,301
- − Mortgage interest
- −$8,850
- − Property taxes
- −$341
- − Insurance
- −$790
- − Repairs & maintenance
- −$1,224
- − Management
- −$1,224
- − Depreciation
- −$4,596
- Taxable loss
- −$1,725
- Est. tax savings @ 24.0%
- +$414
- After-tax cash flow
- $1,428/yr
For passive investors: Depreciation is non-cash, so a rental often shows a tax loss while cash-flowing — sheltering income. Rental losses are passive: they offset passive income freely, and up to $25,000/yr can offset ordinary (W-2) income if you actively participate and your MAGI is under $100k (phasing out to $0 by $150k); unused losses carry forward. On sale, claimed depreciation is recaptured at up to 25%, and gains may owe capital-gains tax (a 1031 exchange can defer both). Figures are a year-1 estimate at your 24.0% rate — not tax advice; consult a CPA.
Schools (NCES district)
- District
- Bullitt County
- NCES district ID
- 2100750
- Math proficiency
- 29% ▼ -15.00%
- Reading proficiency
- 41% ▼ -14.00%
- Median HH income
- $55,009
- Composite
- 30.78/100
- National rank
- #6151
- State rank
- #55 of 165 in KY
Livability — Louisville/Jefferson County metro government (balance)
No livability data for this city. (Only ~50 U.S. cities are tracked.)
Census & demographics
- City population
- 419,741
- Population (ZIP)
- 2,363
Population outlook (Bullitt County) Hauer SSP2
- Today (2025)
- 89,555 people
- By 2030
- 94,389 · +5.4%
- By 2040
- 102,759 · +14.7%
- By 2050
- 108,955 · +21.7%
- By 2075
- 121,898 · +36.1%
- By 2100
- 126,383 · +41.1%
Race, ethnicity, and origin ACS 2023
- Neighborhood character
- Predominantly White (97%)
- Race & ethnicity
- White 97% Two or more races 2%
- Common ancestry
- Italian 4% Iranian 2% Romanian 1%
- Languages at home
- 99% English-only · French/Haitian/Cajun 1% Other Asian/Pacific 1%
Political lean MEDSL · Bullitt
- 2024 margin
- Solid R (+51.0) · D 23.8% · R 74.8% · Other 1.4%
- 2008→2024 swing
- -18.7pp toward R · 2008: -32.3pp · 2024: -51.0pp
- All cycles
- 2024: R+51.0 2020: R+48.0 2016: R+49.8 2012: R+35.7 2008: R+32.3
Not yet ingested
- Civics
- —
Market trends
- HPI YoY
- ▼ -59.41%
- Current HPI
- 261.2976
- Rent YoY
- —
- Metro
- —
- State GDP YoY
- ▲ 1.81%
- F500 in state
- 4
Industry mix (Fortune 500 HQ in KY)
| Industry | F500 HQs | Revenue |
|---|---|---|
| Healthcare | 1 | $118B |
|
||
| Food / Beverage | 1 | $7B |
|
||
Price history
+2533.3% since first listed6 events — show timeline
- 2026-05-27 Listed $158,000 Metro Search MLS
- 2011-09-22 Sold (MLS) $130,800 Metro Search MLS
- 2011-07-02 Listed $139,000 Metro Search MLS
- 2010-12-01 Listing Removed — Metro Search MLS
- 2009-12-01 Listed $149,900 Metro Search MLS
- 1998-08-04 Sold (Public Records) $6,000 Public Records
Property tax history
+10.4%/yrLatest (2025): $341 · +158.6% YoY. Source: county tax records.
Cash-flow waterfall
monthlySold comps — $/sqft
last 12 mo · ≤1 miLoading sold comps…