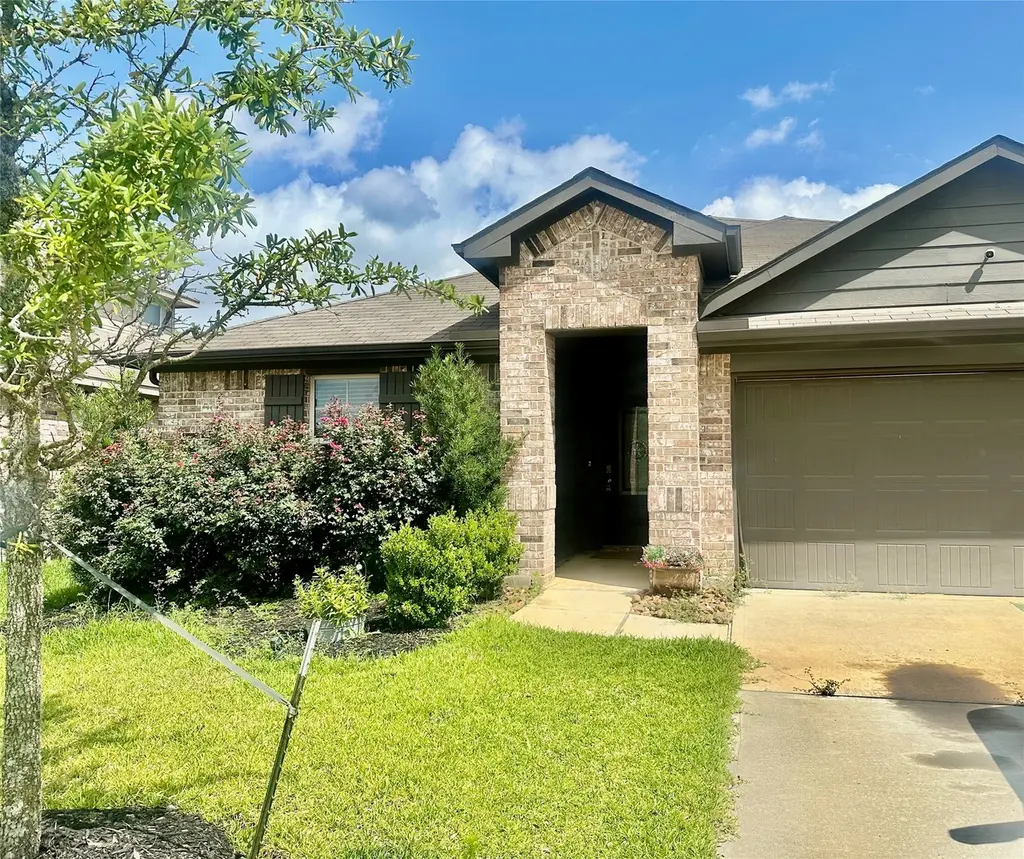
14884 Prickly Pear Cv · Magnolia, TX
Flood risk 1/10 · Minimal
- FEMA flood zone
- X (unshaded)
- Chance of flooding over 30 yrs
- 0.0%
- Est. flood insurance / yr
- $507 – $1,088
Fire risk 5/10 · Moderate
- Est. fire insurance / yr
- $1,222 – $2,270
Heat risk 8/10 · Major
- Hot days now (above 111°F)
- 7 days/yr
- Hot days in 30 yrs
- 24 days/yr
Wind risk 8/10 · Major
- Chance of severe wind over 30 yrs
- 99.0%
Air-quality risk 2/10 · Minimal
- Unhealthy air days now
- 2 days/yr
- Unhealthy air days in 30 yrs
- 2 days/yr
Risk factors via First Street. Map © Google.
Why this score? — see what drove the C- grade
The composite is a weighted blend of 9 inputs, each scored 0–100. Each bar is that input's sub-score; the figure is the points it added to the 100-point composite (weight × sub-score).
- ARV discount +13.7/15.0
- Appreciation +10.0/10.0
- Cash flow +9.7/30.0
- 1% rule +5.2/10.0
- Schools +3.9/10.0
- Livability +3.7/5.0
- DSCR +2.8/10.0
- Rent growth +2.6/5.0
- Condition / age +2.5/5.0
$247,900
🖨 Deal sheet 📄 Offer letter ✓ Due diligence
Listing remarks MLS
FANTASTIC NEW Express Homes BUILT 1 STORY! Sought-After Split Plan Interior Layout! Beautiful Elevation with Covered Front Porch! Impressive Foyer Opens Onto Gourmet Island Kitchen + Spacious Dining Area & Supersized Living Area! Privately Located Primary Suite with Lovely Bath & Big Walk-In Closet! Convenient Indoor Utility Room! Covered Patio Accents Backyard! Great Community with SplashPad, Trails, & Park! Walking Distance to Magnolia High School! Easy Access to Hwy 249 & FM 1488! Estimated Completion - December 2021.
Key facts
- Island kitchen
- Walk-in closet
- Splash pad
Tags
Property features AI
Finance
- Other: Builder: DR HORTON
- HOA & community: Homeowners association (Inframark); Annual association fee of $760
Exterior
- Parking: Attached 2-car garage
- Utilities: Public water; Public sewer
- Home design: Residential property; Built in 2021; Single-story (all main rooms listed on first floor); Slab foundation
- Construction: Brick construction; Composition roof
- Exterior features: Subdivision lot
Interior
- Kitchen: Dishwasher; Gas oven; Gas range; Microwave
- Bedrooms: Primary bedroom on the first floor; Three additional bedrooms on the first floor
- Bathrooms: 2 full bathrooms
- Heating & cooling: Central heating (gas); Central electric air conditioning
- Interior features: Granite counters; 4 total rooms
Neighborhood map
What this means for you Summary
Snapshot
- This is a 4-bed/2.0-bath single-family listed at $248k.
Deal economics
- At list price, monthly cash flow is $-161 ($-2k/yr) — negative.
- To cash-flow at today's rent, offer at most $219k (11.5% below list).
- Meets the 1% rule at list price ($3k rent vs $248k).
- Recommended offer: $219k (11.5% below list) — sets the bar for cash-flow.
- Cap rate 5.5% vs local median 3.4% in Magnolia — top-decile yield for the area; either an underpriced asset or a hidden risk that comps aren't pricing in. Stress-test before assuming the spread holds.
Location & tenants
- Location reads 73/100 on livability (#222 in TX) — a middle-class / working-renter tenant base. Strengths: crime A+, cost of living A+, housing A+; Watch: amenities F, commute F.
- Magnolia ISD (rural): math 42% / reading 45% proficiency, ranked #247 of 826 in TX (top 30%) — families likely to look elsewhere, expect single-tenant / working-renter base with shorter leases.
- Zoned schools: Magnolia H S (math 47% / reading 62%, grade C-, #379 of 1,632 statewide, top 26%, 2,248 students, 31% FRL).
- Market conditions: Rents flat; 1604 active listings in the ZIP; 6 comparable units currently listed for rent nearby; rentals lingering (median 44d on market — plan ~5-8 weeks vacancy on turnover, expect pricing pressure); 50% of comp listings sitting > 30 days — soft ceiling on asking rent; high-income renter base; 13,259 units permitted in Montgomery County in 2024 (1,402 in 5+ unit buildings).
Forward outlook
- In year one you build about $27k of equity ($2k loan paydown + $25k appreciation (10.0% local appreciation)).
- Montgomery County population projected at +65% by 2050 — long-run rental-demand tailwind backs the buy-and-hold thesis.
- By year 2, paydown + projected appreciation supports a ~$43k cash-out refi (75% LTV) — recoverable capital for the next deal without selling this one.
Negotiation context
- Only 6 days on market — expect competitive offers; lowballing is unlikely to land.
- 3 sale attempts since 5y ago with the ask held roughly flat each time — persistent listings suggest the price (not the market) is what's stuck; bring a comps-based counter.
Risks & watch-outs
- Watch-outs: property tax is 3.4% of price.
- Climate carrying-cost: severe wind risk, 99% chance of damaging wind over 30y; moderate wildfire risk; extreme-heat days projected 7→24/yr by 2055 (HVAC capex compounding) — expect insurance premiums to compound above CPI over the hold.
Questions for the listing agent
- What do current leases actually rent for vs. the listed asking? Can we see a recent rent roll and the last 12 months of T-12 income?
- Property tax is high relative to price — has the assessment been appealed recently, and will the sale trigger a re-assessment?
- What does the HOA fee cover, when was the last increase, and are there any pending special assessments or reserve-fund shortfalls?
- Is there a deadline driving the sale (1031 exchange, divorce, estate, relocation)? That informs how much negotiation room exists.
- Schools are D-rated, which usually means shorter tenancies and higher turnover. Who's the typical renter profile here, and what's been the actual vacancy rate?
- What's the average days-on-market for RENTAL listings here right now (not sales)? A rising rental-DOM trend means longer vacancies and softer asking-rent achievability than the comps imply.
- What's the recent tenant-quality profile in this submarket — average credit score on applications, eviction rate, late-payment / NSF rate, and stable-employment percentage? A property-management company in the area should have these aggregated.
- How much new for-sale + rental construction is in the pipeline within 1–3 miles? Heavy new supply typically softens prices + rents 12–24 months out; constrained supply supports both.
Investment metrics
- 1% rule
- 1.02% ✓
- Cap rate
- 5.51%
- Cash-on-cash
- -2.79%
- DSCR
- 0.88
- GRM
- 8.2
CMA / ARV
- ARV (on-the-fly)
- $287,560
- Comps found
- 12
Show comp detail 12 sales within ~0.75 mi
| Address | Dist | Beds/Ba | Sqft | Sold | Price | $/sf | Match |
|---|---|---|---|---|---|---|---|
| 40814 Hawthorne Glades St | 0.28mi | 5/2.0 (+1) | 1,882 (+3%) | 0mo | $279,990 | $149 | 76 |
| 40807 Hawthorne Glades | 0.27mi | 5/2.5 (+1) | 1,892 (+4%) | 2mo | $259,990 | $137 | 72 |
| 15106 Rose Willow Ln | 0.50mi | 5/2.0 (+1) | 1,818 (-0%) | 2mo | $281,990 | $155 | 70 |
| 15019 Baikal Teal Ter | 0.33mi | 3/2.0 (-1) | 1,931 (+6%) | 0mo | $317,900 | $165 | 69 |
| 40603 Balsam Run Ln | 0.27mi | 4/3.0 | 2,041 (+12%) | 1mo | $321,990 | $158 | 63 |
| 15315 Mountain Plover Pl | 0.50mi | 4/2.5 | 1,689 (-7%) | 1mo | $299,990 | $178 | 62 |
| 40742 Barley Straw Dr | 0.28mi | 3/2.0 (-1) | 1,575 (-14%) | 2mo | $279,990 | $178 | 58 |
| 40654 Balsam Run Ln | 0.39mi | 3/2.0 (-1) | 1,575 (-14%) | 0mo | $287,490 | $183 | 54 |
| 40734 Barley Straw Dr | 0.50mi | 4/3.0 | 2,041 (+12%) | 0mo | $314,990 | $154 | 52 |
| 15307 Mountain Plover Pl | 0.50mi | 4/2.5 | 2,064 (+13%) | 1mo | $314,900 | $153 | 52 |
| 15459 Park Perch Pl | 0.56mi | 4/2.5 | 2,061 (+13%) | 2mo | $309,990 | $150 | 49 |
| 15443 Park Perch Pl | 0.55mi | 4/2.5 | 2,064 (+13%) | 2mo | $327,900 | $159 | 48 |
Match score weights: distance 35% · size 25% · config 20% · recency 20%. Top-matched comps best support the ARV.
Projected returns pro-forma
10.0% appreciation · 0.32% rent growth · sell at horizon
- IRR
- 21.3%
- Equity multiple
- 2.71×
- Total profit
- $118,390
- Equity at exit
- $223,328
- IRR
- 18.6%
- Equity multiple
- 5.97×
- Total profit
- $345,279
- Equity at exit
- $481,615
Cash invested: $69,412 (down + closing). Projections, not guarantees.
Landlord ↔ Tenant lean methodology
- Overall (STATE)
- 87 Strongly Landlord-Friendly
- State Texas
- 87 Strongly Landlord-Friendly · R+5
- County
- — inherits STATE
- City
- — inherits STATE
ZIP-level market 77354
- Home prices YoY
- 2.4%
- Rents YoY
- 0.3%
- Active inventory
- 1604
- Price-to-rent
- 8.2×
Monthly cashflow live
- Estimated rent
- $2,533 high interval (Pro) →
- Mortgage (P&I)
- −$1,300
- Tax from tax record
- −$696 /mo · $8,353/yr
- Insurance
- −$103
- HOA
- −$63
- Vacancy / Maint / Mgmt
- −$532
- Net cashflow
- $-161
Break-even live
UW: 25.0% down · 7.5% · 30yr · 1.5% tax · 5.0% vac · 8.0% maint · 8.0% mgmt
Financing live
Cash to close
- Down payment
- $61,975
- Closing costs
- $7,437
- Reserves months
- —
- Total cash needed
- —
Loan-product check · same deal, 3 products live
Conventional
25% down · 7.5% · 30yr
- Down + closing
- —
- Monthly P&I
- —
- Monthly cashflow
- —
- DSCR
- —
- Eligible?
- —
Personal DTI + credit; lowest rate.
DSCR
20% down · 8.5% · 30yr
- Down + closing
- —
- Monthly P&I
- —
- Monthly cashflow
- —
- DSCR
- —
- Eligible?
- —
No personal income docs; deal must DSCR.
Hard money
10% down · 12.0% · 12mo
- Down + closing
- —
- Monthly P&I
- —
- Monthly cashflow
- —
- DSCR
- —
- Eligible?
- —
Short-term bridge; refi at stabilization.
Rent comps 6 comps
| Address | Beds | Baths | Sqft | Rent | $/sqft | DOM | Units | Dist |
|---|---|---|---|---|---|---|---|---|
| 14983 Clay Harvest Rdg Magnolia, TX | 4.0 | 3.0 | 2173 | $2,375 | $1.09 | 43d | 1 | 0.04mi |
| 15128 Lavender Mist Ct Magnolia, TX | 4.0 | 3.0 | 2561 | $2,800 | $1.09 | 19d | 1 | 0.21mi |
| 14727 Band Tailed Pigeon Ct Magnolia, TX | 4.0 | 3.0 | 1942 | $2,700 | $1.39 | 43d | 1 | 0.52mi |
| 39899 Mill Creek Rd Magnolia, TX | 1.0–3.0 | 1.0–2.0 | 1104 | $2,726 | $2.47 | 1d | 40 | 0.77mi |
| 40547 Berylline Ln Magnolia, TX | 4.0 | 2.0 | 1753 | $2,300 | $1.31 | 43d | 1 | 0.97mi |
| 40558 Berylline Ln Unit NA Magnolia, TX | 3.0 | 2.0 | 1499 | $2,150 | $1.43 | 24d | 1 | 0.99mi |
HOA detail
- Monthly dues
- $63 · $756/yr
Listing history 6 events
-
2026-06-18days on market $247,900 Active 6 DOM
-
2026-06-17days on market $247,900 Active 5 DOM
-
2026-06-16days on market $247,900 Active 4 DOM
-
2026-06-15days on market $247,900 Active 3 DOM
-
2026-06-13remarks 657-char remark
-
2026-06-13$247,900 Active 1 DOM
ⓘ Source: listings_history table (triggers on properties + properties_extension) + one-shot
backfill from property_details.listing_events for pre-trigger history.
Tax reassessment forecast TX · Resets to sale price
- Current annual tax
- $8,353 · $696/mo
- Projected year-2 tax
- $8,353 · $696/mo
- Expected delta
- $0/yr ($0/mo · 0.0%)
ⓘ Screening estimate from a state-policy table — verify with the county assessor before closing.
Climate risk First Street
- Flood 1/10 Low FEMA zone X (unshaded) · 0% chance over 30 yrs
- Wildfire 5/10 Major
- Heat 8/10 Severe 7 d/yr ≥111°F today · 24 d/yr by 30 yrs out
- Wind 8/10 Severe 99% chance of damaging wind over 30 yrs
- Air quality 2/10 Low 2 unhealthy d/yr today · 2 by 30 yrs out
Nearby sold comps map
Loading sold comps map…
Walkable amenities ~0.75 mi
Loading nearby amenities…
Taxation est. · year 1
- Rental income
- $30,394
- − Mortgage interest
- −$13,886
- − Property taxes
- −$8,353
- − Insurance
- −$1,240
- − Repairs & maintenance
- −$2,431
- − Management
- −$2,431
- − HOA
- −$756
- − Depreciation
- −$7,212
- Taxable loss
- −$5,916
- Est. tax savings @ 24.0%
- +$1,420
- After-tax cash flow
- $-518/yr
For passive investors: Depreciation is non-cash, so a rental often shows a tax loss while cash-flowing — sheltering income. Rental losses are passive: they offset passive income freely, and up to $25,000/yr can offset ordinary (W-2) income if you actively participate and your MAGI is under $100k (phasing out to $0 by $150k); unused losses carry forward. On sale, claimed depreciation is recaptured at up to 25%, and gains may owe capital-gains tax (a 1031 exchange can defer both). Figures are a year-1 estimate at your 24.0% rate — not tax advice; consult a CPA.
Schools (NCES district)
- District
- Magnolia ISD
- NCES district ID
- 4828740
- Math proficiency
- 42% ▼ -7.00%
- Reading proficiency
- 45% ▼ -4.00%
- Median HH income
- $71,692
- Composite
- 39.46/100
- National rank
- #3958
- State rank
- #247 of 826 in TX
Livability — Magnolia
- Score
- 73/100
- State rank
- #222
- US rank
- #5442
Category grades
Schools grade is shown separately in the Schools card above.
Census & demographics
- County
- Montgomery County · 663,713 people
- City population
- 32,847
- Metro
- Houston-The Woodlands-Sugar Land, TX
- Population (ZIP)
- 44,900
- Household income
- $112,504
- Rent vs Own
- Severe rent burden
- 586.0
Population outlook (Montgomery County) Hauer SSP2
- Today (2025)
- 713,896 people
- By 2030
- 805,263 · +12.8%
- By 2040
- 992,708 · +39.1%
- By 2050
- 1,179,590 · +65.2%
- By 2075
- 1,628,084 · +128.1%
- By 2100
- 1,937,880 · +171.5%
Race, ethnicity, and origin ACS 2023
- Neighborhood character
- Predominantly White (66%)
- Race & ethnicity
- White 66% Hispanic / Latino 25% Two or more races 18% Black 3% Asian 1%
- Hispanic origin (detail)
- Mexican 14% Puerto Rican 1%
- Common ancestry
- Lithuanian 4% Slovak 2% Italian 2%
- Foreign-born
- 11% · Canada, Vietnam
- Languages at home
- 83% English-only · Spanish 15% Other Indo-European 1% German/W. Germanic 1%
Political lean MEDSL · Montgomery
- 2024 margin
- Solid R (+45.5) · D 26.8% · R 72.3%
- 2008→2024 swing
- +7.2pp toward D · 2008: -52.7pp · 2024: -45.5pp
- All cycles
- 2024: R+45.5 2020: R+43.8 2016: R+51.4 2012: R+60.7 2008: R+52.7
Not yet ingested
- Civics
- —
Market trends
- HPI YoY
- ▲ 12.09%
- Current HPI
- 512.87
- Rent YoY
- ▲ 0.32%
- Metro
- Houston-The Woodlands-Sugar Land, TX
- State GDP YoY
- ▲ 3.95%
- F500 in state
- 110
Industry mix (Fortune 500 HQ in TX)
| Industry | F500 HQs | Revenue |
|---|---|---|
| Energy | 16 | $1,198B |
|
||
| Technology | 5 | $198B |
|
||
| Engineering / Construction | 4 | $72B |
|
||
| Energy Services | 3 | $60B |
|
||
| Utilities | 3 | $41B |
|
||
| Healthcare | 2 | $330B |
|
||
Price history
-11.5% since first listed8 events — show timeline
- 2026-06-12 Listed $247,900 HARMLS
- 2022-02-22 Sold (MLS) — HARMLS
- 2021-12-28 Pending — HARMLS
- 2021-12-23 Price Changed $287,990 HARMLS
- 2021-12-23 Relisted — HARMLS
- 2021-10-18 Pending — HARMLS
- 2021-09-11 Price Changed $280,490 HARMLS
- 2021-08-13 Listed $279,990 HARMLS
Property tax history
+19.1%/yrLatest (2025): $8,353 · +0.8% YoY. Source: county tax records.
Cash-flow waterfall
monthlySold comps — $/sqft
last 12 mo · ≤1 miLoading sold comps…