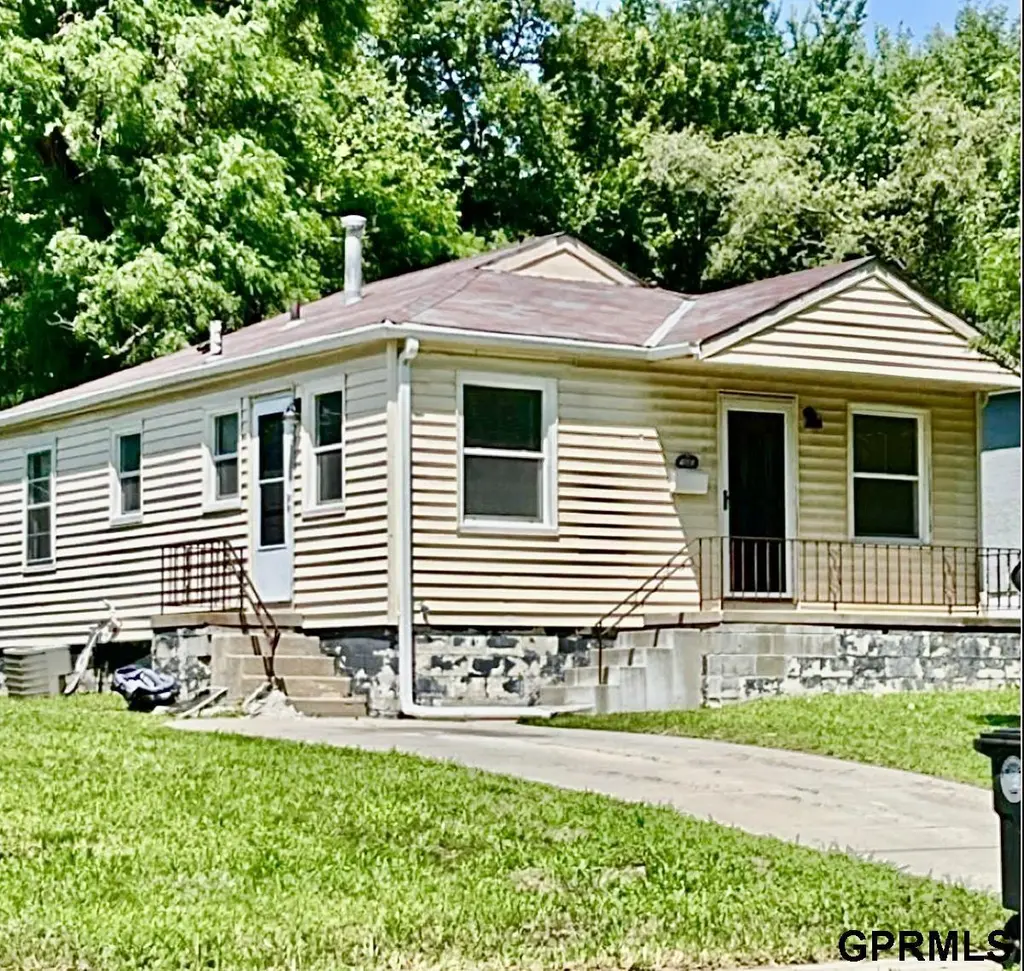
4018 N 42 St · Omaha, NE
Flood risk 1/10 · Minimal
- FEMA flood zone
- X (unshaded)
- Chance of flooding over 30 yrs
- 0.0%
- Est. flood insurance / yr
- $473 – $860
Fire risk 1/10 · Minimal
- Est. fire insurance / yr
- $1,161 – $2,155
Heat risk 3/10 · Minor
- Hot days now (above 104°F)
- 7 days/yr
- Hot days in 30 yrs
- 15 days/yr
Wind risk 2/10 · Minimal
- Chance of severe wind over 30 yrs
- —
Air-quality risk 2/10 · Minimal
- Unhealthy air days now
- 0 days/yr
- Unhealthy air days in 30 yrs
- 1 days/yr
Risk factors via First Street. Map © Google.
Why this score? — see what drove the D+ grade
The composite is a weighted blend of 9 inputs, each scored 0–100. Each bar is that input's sub-score; the figure is the points it added to the 100-point composite (weight × sub-score).
- Cash flow +14.4/30.0
- Appreciation +10.0/10.0
- DSCR +4.4/10.0
- Livability +4.2/5.0
- ARV discount +3.8/15.0
- 1% rule +3.7/10.0
- Rent growth +3.3/5.0
- Condition / age +2.5/5.0
- Schools +2.1/10.0
$129,900
🖨 Deal sheet 📄 Offer letter ✓ Due diligence
Listing remarks MLS
Needs lots of work, but would be an excellent investment property!AMA.
Key facts
- Off street parking
- Unfinished basement
- Functional layout
Tags
Property features AI
Exterior
- Parking: Off-street parking
- Utilities: Public water; Public sewer
- Home design: Single-family residence; Residential property; Built in 1951; One-story (main floor living shown)
- Construction: Block foundation
- Exterior features: Lot up to 1/4 acre (approx. 0.11 acre); Lot dimensions approximately 130 x 40
Interior
- Bedrooms: Master bedroom on main floor; Additional bedroom on main floor
- Bathrooms: One full bathroom on main floor
- Heating & cooling: Natural gas forced-air heating; Central air conditioning
- Interior features: Unfinished basement; No fireplaces
Neighborhood map
What this means for you Summary
Snapshot
- This is a 2-bed/1.0-bath single-family listed at $130k.
Deal economics
- At list price, monthly cash flow is $26 ($306/yr) — positive.
- The deal already cash-flows at list — no discount required.
- To meet the 1% rule (rent ≥ 1% of price), the offer needs to be $114k (12.6% below list).
- Recommended offer: $114k (12.6% below list) — sets the bar for 1% rule.
- Cap rate 6.5% vs local median 3.6% in Omaha — top-decile yield for the area; either an underpriced asset or a hidden risk that comps aren't pricing in. Stress-test before assuming the spread holds.
Location & tenants
- Location reads 84/100 on livability (#7 in NE, #663 nationally) — a professional / high-income tenant draw. Strengths: amenities A+, commute A+, cost of living A+; Watch: crime F.
- Omaha Public Schools (urban): math 20% / reading 28% proficiency, ranked #110 of 111 in NE (top 99%) — low school quality limits family demand, transient renter base, plan for 1-2y turnover; 62% free/reduced lunch — lower-income household profile, screen leases tightly.
- Zoned schools: Druid Hill Elementary School (math 12% / reading 12%, grade F, #489 of 502 statewide, top 98%, 279 students, 0% FRL); Monroe Middle School (math 8% / reading 15%, grade F, #127 of 128 statewide, top 99%, 769 students, 0% FRL); North High School (math 21% / reading 25%, grade F, #247 of 261 statewide, top 95%, 1,796 students, 0% FRL) — zoned schools average 0% FRL vs 62% district-wide (62 pts lower); this property's tenant base skews higher-income than the district average.
- Market conditions: Rents rising (+3.2%/yr); 139 active listings in the ZIP; 28 comparable units currently listed for rent nearby; rentals at typical pace (median 24d on market — plan ~3-4 weeks tenant-placement turnaround); lower-income renter base — watch delinquency; 4,539 units permitted in Douglas County in 2024 (2,583 in 5+ unit buildings).
Forward outlook
- In year one you build about $14k of equity ($898 loan paydown + $13k appreciation (10.0% local appreciation)).
- Douglas County population projected at +28% by 2050 — long-run rental-demand tailwind backs the buy-and-hold thesis.
- At projected returns (10.0% appreciation + 3.2% rent growth), your $36k cash investment doubles in ~3 years — after that, you're playing with house money.
- By year 3, paydown + projected appreciation supports a ~$35k cash-out refi (75% LTV) — recoverable capital for the next deal without selling this one.
Negotiation context
- Only 7 days on market — expect competitive offers; lowballing is unlikely to land.
- 2 sale attempts since 15y ago with the ask held roughly flat each time — persistent listings suggest the price (not the market) is what's stuck; bring a comps-based counter.
- Current owner paid $60k; list at $130k implies a 116% gain — meaningful room to come down on a strong offer.
Risks & watch-outs
- Watch-outs: built in 1951 — expect roof / HVAC / electrical / plumbing capex.
Questions for the listing agent
- Built in 1951 — when were the roof, HVAC, electrical panel, plumbing, and water heater last replaced?
- Is there a deadline driving the sale (1031 exchange, divorce, estate, relocation)? That informs how much negotiation room exists.
- Crime grade is F in this area — have there been break-ins, vandalism, or insurance claims at this property in the last 3 years? What carrier currently insures it and at what premium?
- The area grade is low — what's the realistic commute time and amenity access for the typical tenant pool here? Any planned neighborhood developments (good or bad) we should know about?
- What's the average days-on-market for RENTAL listings here right now (not sales)? A rising rental-DOM trend means longer vacancies and softer asking-rent achievability than the comps imply.
- What's the recent tenant-quality profile in this submarket — average credit score on applications, eviction rate, late-payment / NSF rate, and stable-employment percentage? A property-management company in the area should have these aggregated.
- How much new for-sale + rental construction is in the pipeline within 1–3 miles? Heavy new supply typically softens prices + rents 12–24 months out; constrained supply supports both.
Investment metrics
- 1% rule
- 0.87% ✗
- Cap rate
- 6.53%
- Cash-on-cash
- 0.84%
- DSCR
- 1.04
- GRM
- 9.5
CMA / ARV
- ARV (median comp)
- $120,001
- List price
- $129,900
- Delta
- 8.25%
- Verdict
- FAIR
- Comps
- 20 within 1.0 mi
Show comp detail 12 sales within ~0.75 mi
| Address | Dist | Beds/Ba | Sqft | Sold | Price | $/sf | Match |
|---|---|---|---|---|---|---|---|
| 3936 N 40th St | 0.19mi | 2/1.0 | 768 (0%) | 2mo | $110,000 | $143 | 90 |
| 3940 N 38 St | 0.32mi | 2/1.0 | 780 (+2%) | 1mo | $123,000 | $158 | 82 |
| 3715 N 44th Ave | 0.25mi | 2/1.0 | 810 (+6%) | 3mo | $130,000 | $160 | 76 |
| 4602 N 47th St | 0.51mi | 2/1.0 | 750 (-2%) | 0mo | $168,900 | $225 | 72 |
| 4542 N 41 St | 0.37mi | 2/1.0 | 814 (+6%) | 5mo | $122,000 | $150 | 68 |
| 3959 N 40th St | 0.22mi | 2/1.0 | 870 (+13%) | 0mo | $108,000 | $124 | 68 |
| 4540 Fowler Ave | 0.52mi | 3/1.0 (+1) | 759 (-1%) | 4mo | $162,000 | $213 | 66 |
| 4712 Fontenelle Blvd | 0.44mi | 2/1.0 | 822 (+7%) | 4mo | $109,500 | $133 | 64 |
| 4643 Larimore Ave | 0.61mi | 3/1.0 (+1) | 793 (+3%) | 3mo | $150,000 | $189 | 59 |
| 4123 Wirt St | 0.65mi | 2/1.0 | 714 (-7%) | 1mo | $80,000 | $112 | 57 |
| 4204 Bedford Ave | 0.46mi | 2/1.0 | 874 (+14%) | 2mo | $140,000 | $160 | 54 |
| 3701 Bedford Ave | 0.62mi | 2/2.0 | 675 (-12%) | 6mo | $110,000 | $163 | 42 |
Match score weights: distance 35% · size 25% · config 20% · recency 20%. Top-matched comps best support the ARV.
Projected returns pro-forma
10.0% appreciation · 3.22% rent growth · sell at horizon
- IRR
- 25.0%
- Equity multiple
- 3.00×
- Total profit
- $72,625
- Equity at exit
- $117,024
- IRR
- 22.1%
- Equity multiple
- 6.86×
- Total profit
- $213,107
- Equity at exit
- $252,367
Cash invested: $36,372 (down + closing). Projections, not guarantees.
Landlord ↔ Tenant lean methodology
- Overall (STATE)
- 83 Strongly Landlord-Friendly
- State Nebraska
- 83 Strongly Landlord-Friendly · R+13
- County
- — inherits STATE
- City
- — inherits STATE
ZIP-level market 68111
- Home prices YoY
- 4.0%
- Rents YoY
- 3.2%
- Active inventory
- 139
- Price-to-rent
- 9.5×
Monthly cashflow live
- Estimated rent
- $1,135 high interval (Pro) →
- Mortgage (P&I)
- −$681
- Tax from tax record
- −$136 /mo · $1,632/yr
- Insurance
- −$54
- HOA
- −$0
- Vacancy / Maint / Mgmt
- −$238
- Net cashflow
- $26
Break-even live
UW: 25.0% down · 7.5% · 30yr · 1.5% tax · 5.0% vac · 8.0% maint · 8.0% mgmt
Financing live
Cash to close
- Down payment
- $32,475
- Closing costs
- $3,897
- Reserves months
- —
- Total cash needed
- —
Loan-product check · same deal, 3 products live
Conventional
25% down · 7.5% · 30yr
- Down + closing
- —
- Monthly P&I
- —
- Monthly cashflow
- —
- DSCR
- —
- Eligible?
- —
Personal DTI + credit; lowest rate.
DSCR
20% down · 8.5% · 30yr
- Down + closing
- —
- Monthly P&I
- —
- Monthly cashflow
- —
- DSCR
- —
- Eligible?
- —
No personal income docs; deal must DSCR.
Hard money
10% down · 12.0% · 12mo
- Down + closing
- —
- Monthly P&I
- —
- Monthly cashflow
- —
- DSCR
- —
- Eligible?
- —
Short-term bridge; refi at stabilization.
Rent comps 28 comps
| Address | Beds | Baths | Sqft | Rent | $/sqft | DOM | Units | Dist |
|---|---|---|---|---|---|---|---|---|
| 3356 N 41st St Omaha, NE | 2.0 | 1.0 | 720 | $1,295 | $1.80 | 23d | 1 | 0.40mi |
| 3425 N 45th St Omaha, NE | 2.0 | 1.0 | 872 | $1,500 | $1.72 | 14d | 1 | 0.45mi |
| 3323 N 40th St Omaha, NE | 2.0 | 1.0 | 1000 | $1,575 | $1.57 | 3d | 1 | 0.51mi |
| 4112 N 48th St Omaha, NE | 2.0 | 1.0 | 825 | $899 | $1.09 | 10d | 2 | 0.51mi |
| 4112 N 48th St Unit 3 Omaha, NE | 2.0 | 1.0 | 800 | $850 | $1.06 | 23d | 1 | 0.51mi |
| 4112 N 48th St Unit 2 Omaha, NE | 2.0 | 1.0 | 800 | $899 | $1.12 | 23d | 1 | 0.51mi |
| 4822 Sahler St Unit 48268 Omaha, NE | 1.0 | 1.0 | 600 | $700 | $1.17 | 44d | 1 | 0.56mi |
| 4844 Taylor St Apt 4 Omaha, NE | 2.0 | 1.0 | 750 | $925 | $1.23 | 23d | 1 | 0.62mi |
| 4844 Taylor St Apt 1 Omaha, NE | 1.0 | 1.0 | 700 | $795 | $1.14 | 3d | 1 | 0.62mi |
| 4852 Boyd St Omaha, NE | 2.0 | 2.0 | 912 | $1,500 | $1.64 | 44d | 1 | 0.63mi |
| 3674 Bedford Ave Omaha, NE | 3.0 | 1.0 | 864 | $1,275 | $1.48 | 23d | 1 | 0.63mi |
| 3212 N 39th St Omaha, NE | 1.0 | 1.0 | 1025 | $785 | $0.77 | 23d | 1 | 0.64mi |
| 4918 Ames Ave Unit 17 Omaha, NE | 2.0 | 1.5 | 1074 | $850 | $0.79 | 23d | 1 | 0.70mi |
| 4918 Ames Ave Apt 13 Omaha, NE | 1.0 | 1.0 | 974 | $750 | $0.77 | 44d | 1 | 0.70mi |
| 5119 Pratt St Omaha, NE | 3.0 | 1.0 | 1008 | $1,900 | $1.88 | 44d | 1 | 0.96mi |
| 4874 Maple St Omaha, NE | 3.0 | 1.0 | 1098 | $1,545 | $1.41 | 44d | 1 | 0.96mi |
| 3911 N 52nd St Apt 5 Omaha, NE | 1.0 | 1.0 | 850 | $799 | $0.94 | 14d | 1 | 0.98mi |
| 4314 N 52nd St Omaha, NE | 3.0 | 1.0 | 780 | $945 | $1.21 | 14d | 1 | 1.02mi |
| 3941 Himebaugh Ave Omaha, NE | 2.0 | 1.0 | 720 | $1,350 | $1.88 | 23d | 1 | 1.05mi |
| 4460 Redman Ave Omaha, NE | 3.0 | 1.0 | 750 | $950 | $1.27 | 44d | 1 | 1.07mi |
| 4470 Redman Ave Unit 4470A Omaha, NE | 2.0 | 1.5 | 980 | $1,050 | $1.07 | 10d | 1 | 1.07mi |
| 3502 Lake St Omaha, NE | 2.0 | 1.0 | 974 | $995 | $1.02 | 2d | 1 | 1.13mi |
| 2305 John a Creighton Blvd Omaha, NE | 2.0 | 1.0 | 672 | $1,200 | $1.79 | 21d | 1 | 1.18mi |
| 4623 N 56th St Unit 15 Omaha, NE | 1.0 | 1.0 | 550 | $735 | $1.34 | 3d | 1 | 1.26mi |
| 4625 N 56th St Apt 18 Omaha, NE | 2.0 | 1.0 | 700 | $875 | $1.25 | 44d | 1 | 1.27mi |
| 4625 N 56th St Unit 21 Omaha, NE | 1.0 | 1.0 | 550 | $750 | $1.36 | 44d | 1 | 1.27mi |
| 1825 NW Radial Hwy Omaha, NE | 1.0 | 1.0 | 650 | $775 | $1.19 | 44d | 1 | 1.35mi |
| 4414 Curtis Ave Unit CRAWFORD 4414/B Omaha, NE | 1.0 | 1.0 | 765 | $745 | $0.97 | 23d | 1 | 1.39mi |
Listing history 6 events
-
2026-05-18status Pending 770-char remark
-
2026-05-11$129,900 New 770-char remark
-
2018-10-30soldstatus $60,000
-
2011-04-04soldstatus $7,000 70-char remark
Show marketing remark (70 chars)
Needs lots of work, but would be an excellent investment property!AMA.
-
2011-03-24historical 70-char remark
Show marketing remark (70 chars)
Needs lots of work, but would be an excellent investment property!AMA.
-
2011-02-09$9,900 70-char remark
Show marketing remark (70 chars)
Needs lots of work, but would be an excellent investment property!AMA.
ⓘ Source: listings_history table (triggers on properties + properties_extension) + one-shot
backfill from property_details.listing_events for pre-trigger history.
Tax reassessment forecast NE · Resets to sale price
- Current annual tax
- $1,632 · $136/mo
- Projected year-2 tax
- $2,247 · $187/mo
- Expected delta
- +$615/yr (+$51/mo · 37.7%)
ⓘ Screening estimate from a state-policy table — verify with the county assessor before closing.
Climate risk First Street
- Flood 1/10 Low FEMA zone X (unshaded) · 0% chance over 30 yrs
- Wildfire 1/10 Low
- Heat 3/10 Moderate 7 d/yr ≥104°F today · 15 d/yr by 30 yrs out
- Wind 2/10 Low
- Air quality 2/10 Low 0 unhealthy d/yr today · 1 by 30 yrs out
Nearby sold comps map
Loading sold comps map…
Walkable amenities ~0.75 mi
Loading nearby amenities…
Taxation est. · year 1
- Rental income
- $13,623
- − Mortgage interest
- −$7,276
- − Property taxes
- −$1,632
- − Insurance
- −$650
- − Repairs & maintenance
- −$1,090
- − Management
- −$1,090
- − Depreciation
- −$3,779
- Taxable loss
- −$1,894
- Est. tax savings @ 24.0%
- +$454
- After-tax cash flow
- $761/yr
For passive investors: Depreciation is non-cash, so a rental often shows a tax loss while cash-flowing — sheltering income. Rental losses are passive: they offset passive income freely, and up to $25,000/yr can offset ordinary (W-2) income if you actively participate and your MAGI is under $100k (phasing out to $0 by $150k); unused losses carry forward. On sale, claimed depreciation is recaptured at up to 25%, and gains may owe capital-gains tax (a 1031 exchange can defer both). Figures are a year-1 estimate at your 24.0% rate — not tax advice; consult a CPA.
Schools (NCES district)
- District
- Omaha Public Schools
- NCES district ID
- 3174820
- Math proficiency
- 20% ▼ -10.00%
- Reading proficiency
- 28% ▼ -5.00%
- Median HH income
- $46,039
- Composite
- 20.83/100
- National rank
- #8502
- State rank
- #110 of 111 in NE
Livability — Omaha
- Score
- 84/100
- State rank
- #7
- US rank
- #663
Category grades
Schools grade is shown separately in the Schools card above.
Census & demographics
- Census place
- Omaha, NE
- County
- Douglas County · 538,646 people
- City population
- 552,986
- Metro
- Omaha-Council Bluffs, NE-IA
- Population (ZIP)
- 24,210
- Household income
- $42,185
- Rent vs Own
- Severe rent burden
- 1913.0
Population outlook (Douglas County) Hauer SSP2
- Today (2025)
- 625,245 people
- By 2030
- 661,613 · +5.8%
- By 2040
- 732,395 · +17.1%
- By 2050
- 801,988 · +28.3%
- By 2075
- 968,637 · +54.9%
- By 2100
- 1,101,871 · +76.2%
Race, ethnicity, and origin ACS 2023
- Neighborhood character
- Diverse neighborhood (Simpson 0.65)
- Race & ethnicity
- Black 52% Hispanic / Latino 21% White 17% Two or more races 15% Asian 3% Native American 1%
- Hispanic origin (detail)
- Mexican 14%
- Common ancestry
- Ukrainian 3% Lithuanian 0%
- Foreign-born
- 14% · Canada, Philippines
- Languages at home
- 75% English-only · Spanish 16% Other Asian/Pacific 3% French/Haitian/Cajun 1%
Political lean MEDSL · Douglas
- 2024 margin
- D (+10.2) · D 54.4% · R 44.2% · Other 1.4%
- 2008→2024 swing
- +5.5pp toward D · 2008: 4.6pp · 2024: 10.2pp
- All cycles
- 2024: D+10.2 2020: D+11.3 2016: D+1.4 2012: R+4.3 2008: D+4.6
Not yet ingested
- Civics
- —
Market trends
- HPI YoY
- ▲ 13.82%
- Current HPI
- 358.7174
- Rent YoY
- ▲ 3.22%
- Metro
- Omaha-Council Bluffs, NE-IA
- State GDP YoY
- ▲ 0.68%
- F500 in state
- 2
Industry mix (Fortune 500 HQ in NE)
| Industry | F500 HQs | Revenue |
|---|---|---|
| Conglomerate | 1 | $371B |
|
||
Price history
+1212.1% since first listed6 events — show timeline
- 2026-05-18 Pending — GPRMLS
- 2026-05-11 Listed $129,900 GPRMLS
- 2018-10-30 Sold (Public Records) $60,000 Public Records
- 2011-04-04 Sold (MLS) $7,000 GPRMLS
- 2011-03-24 Listing Removed — GPRMLS
- 2011-02-09 Listed $9,900 GPRMLS
Property tax history
+14.9%/yrLatest (2025): $1,632 · +0.1% YoY. Source: county tax records.
Cash-flow waterfall
monthlySold comps — $/sqft
last 12 mo · ≤1 miLoading sold comps…