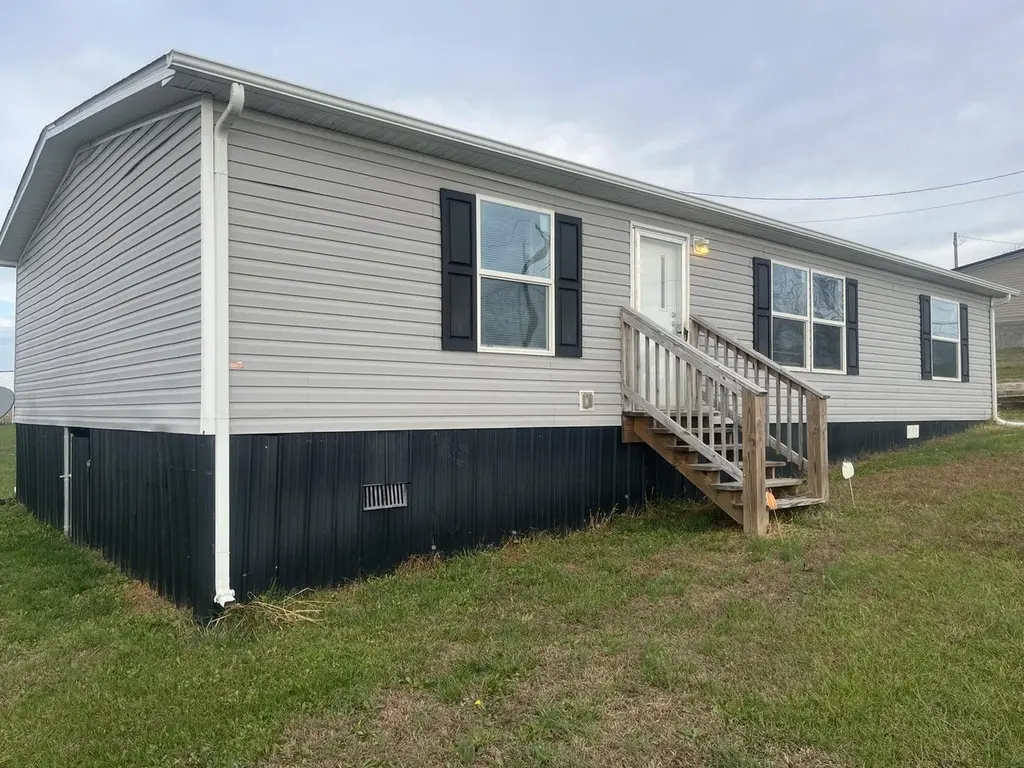
2420 Old Bull Rd · Eubank, KY
Flood risk 1/10 · Minimal
- FEMA flood zone
- X (unshaded)
- Chance of flooding over 30 yrs
- 0.0%
- Est. flood insurance / yr
- $507 – $1,088
Fire risk 5/10 · Moderate
- Est. fire insurance / yr
- $839 – $1,559
Heat risk 4/10 · Minor
- Hot days now (above 101°F)
- 7 days/yr
- Hot days in 30 yrs
- 20 days/yr
Wind risk 3/10 · Minor
- Chance of severe wind over 30 yrs
- 7.0%
Air-quality risk 1/10 · Minimal
- Unhealthy air days now
- 0 days/yr
- Unhealthy air days in 30 yrs
- 0 days/yr
Risk factors via First Street. Map © Google.
Why this score? — see what drove the C grade
The composite is a weighted blend of 9 inputs, each scored 0–100. Each bar is that input's sub-score; the figure is the points it added to the 100-point composite (weight × sub-score).
- Cash flow +21.8/30.0
- ARV discount +7.5/15.0
- DSCR +7.0/10.0
- Appreciation +6.1/10.0
- 1% rule +4.8/10.0
- Schools +4.0/10.0
- Livability +3.2/5.0
- Rent growth +2.5/5.0
- Condition / age +2.5/5.0
$159,900
🖨 Deal sheet (PDF) 📄 Offer letter ✓ Due diligence
Listing remarks MLS
Take a look at this nice home! The home has an OPEN FLOOR PLAN, sits on a half acre lot, is in great condition (looks practically new) and has chain link fencing. The home features 3 Bedrooms, 2 Full Bathrooms, trendy laminate flooring, an eat-in kitchen with an island, nice cabinets and black kitchen appliances that are included with purchase of the home. The master bedroom has an ensuite and there is a utility room at the back door entrance...a nice area to store your shoes upon entering the home. The country setting is much to be desired. You can look out your kitchen window into a field that is host to deer and other wildlife. The location provides a quiet lifestyle but is still relatively close to everything. The chain link is great for pets to enjoy freedom or it can serve as a nice feature for a buyer with young children who like to play outside. The fence is 6 ft in the front area & 7 ft down the sides. This property is priced to sell. This home is affordable, in great condition and in an area that is quiet and easy to access. This property won't last long on the market!
Key facts
- Large deck
- Eat-in kitchen
- Two kennels
Tags
Property features AI
Finance
- Other: Approximately 0.5-acre lot (public records); Building area approximately 1,248 total
Exterior
- Parking: Driveway
- Utilities: Public water; Septic tank; Electricity connected; Water connected
- Home design: Manufactured house; Single-story
- Construction: Vinyl siding; Composition shingle roof; Pillar/post/pier foundation (other)
- Exterior features: Chain link fencing; Rural and farm views
Interior
- Kitchen: Refrigerator; Range; Vented exhaust fan
- Bedrooms: 3 total rooms (includes bedrooms and living areas)
- Flooring: Carpet; Vinyl
- Bathrooms: 2 full bathrooms
- Heating & cooling: Forced air heating; Heat pump; Central air conditioning
- Interior features: Eat-in kitchen; Window treatments and blinds
- Laundry & utility: Washer hookup; Electric dryer hookup
Neighborhood map
What this means for you Summary
Snapshot
- This is a 3-bed/2.0-bath other listed at $160k.
Deal economics
- At list price, monthly cash flow is $248 ($3k/yr) — positive.
- The deal already cash-flows at list — no discount required.
- To meet the 1% rule (rent ≥ 1% of price), the offer needs to be $156k (2.5% below list).
- Recommended offer: $156k (2.5% below list) — sets the bar for 1% rule.
- Cap rate 8.2% vs local median 4.0% in Eubank — top-decile yield for the area; either an underpriced asset or a hidden risk that comps aren't pricing in. Stress-test before assuming the spread holds.
Location & tenants
- Location reads 65/100 on livability (#262 in KY) — a middle-class / working-renter tenant base. Strengths: crime A+, cost of living A+, housing A+; Watch: amenities F, commute F, employment F.
- Pulaski County (town): math 43% / reading 53% proficiency, ranked #17 of 165 in KY (top 10%) — families likely to look elsewhere, expect single-tenant / working-renter base with shorter leases.
- Zoned schools: Eubank Elementary School (math 27% / reading 47%, grade F, #255 of 676 statewide, top 42%, 368 students, 83% FRL); Pulaski County High School (math 42% / reading 47%, grade F, #21 of 254 statewide, top 10%, 1,209 students, 57% FRL).
- Market conditions: 36 active listings in the ZIP; 117 units permitted in Pulaski County in 2024 (50 in 5+ unit buildings).
Forward outlook
- In year one you build about $5k of equity ($1k loan paydown + $4k appreciation (2.3% local appreciation)).
- At projected returns (2.3% appreciation + 3.0% rent growth), your $45k cash investment doubles in ~6 years — after that, you're playing with house money.
- By year 7, paydown + projected appreciation supports a ~$30k cash-out refi (75% LTV) — recoverable capital for the next deal without selling this one.
Negotiation context
- It's been on market 17 days — a 2% lower offer ($158k) is reasonable based on typical stale-listing flexibility.
- 4 sale attempts since 6y ago with the ask held roughly flat each time — persistent listings suggest the price (not the market) is what's stuck; bring a comps-based counter.
- Current owner paid $130k; 23% above their basis — modest negotiation headroom, anchor on the comps not their cost.
Risks & watch-outs
- Climate carrying-cost: moderate wildfire risk — expect insurance premiums to compound above CPI over the hold.
Questions for the listing agent
- Is there a deadline driving the sale (1031 exchange, divorce, estate, relocation)? That informs how much negotiation room exists.
- What's the average days-on-market for RENTAL listings here right now (not sales)? A rising rental-DOM trend means longer vacancies and softer asking-rent achievability than the comps imply.
- What's the recent tenant-quality profile in this submarket — average credit score on applications, eviction rate, late-payment / NSF rate, and stable-employment percentage? A property-management company in the area should have these aggregated.
- How much new for-sale + rental construction is in the pipeline within 1–3 miles? Heavy new supply typically softens prices + rents 12–24 months out; constrained supply supports both.
Investment metrics
- 1% rule
- 0.98% ✗
- Cap rate
- 8.16%
- Cash-on-cash
- 6.66%
- DSCR
- 1.30
- GRM
- 8.5
CMA / ARV
No comps found within radius.
Projected returns pro-forma
2.28% appreciation · 3.0% rent growth · sell at horizon
- IRR
- 11.8%
- Equity multiple
- 1.65×
- Total profit
- $29,032
- Equity at exit
- $65,518
- IRR
- 14.4%
- Equity multiple
- 2.98×
- Total profit
- $88,820
- Equity at exit
- $96,265
Cash invested: $44,772 (down + closing). Projections, not guarantees.
Landlord ↔ Tenant lean methodology
- Overall (STATE)
- 83 Strongly Landlord-Friendly
- State Kentucky
- 83 Strongly Landlord-Friendly · R+16
- County
- — inherits STATE
- City
- — inherits STATE
ZIP-level market 42567
- Home prices YoY
- 0.9%
- Active inventory
- 36
- Price-to-rent
- 8.5×
Monthly cashflow live
- Estimated rent
- $1,559 medium interval (Pro) →
- Mortgage (P&I)
- −$839
- Tax from tax record
- −$78 /mo · $940/yr
- Insurance
- −$67
- HOA
- −$0
- Vacancy / Maint / Mgmt
- −$327
- Net cashflow
- $248
Break-even live
Sensitivity live
| Price | -10% $339 | -5% $294 | +0% $248 | +5% $203 | +10% $158 |
|---|---|---|---|---|---|
| Rent | -10% $125 | -5% $187 | +0% $248 | +5% $310 | +10% $372 |
| Rate | -1.0pp $329 | -0.5pp $289 | base $248 | +0.5pp $207 | +1.0pp $165 |
UW: 25.0% down · 7.5% · 30yr · 1.5% tax · 5.0% vac · 8.0% maint · 8.0% mgmt
Financing live
Cash to close
- Down payment
- $39,975
- Closing costs
- $4,797
- Reserves months
- —
- Total cash needed
- —
Loan-product check · same deal, 3 products live
Conventional
25% down · 7.5% · 30yr
- Down + closing
- —
- Monthly P&I
- —
- Monthly cashflow
- —
- DSCR
- —
- Eligible?
- —
Personal DTI + credit; lowest rate.
DSCR
20% down · 8.5% · 30yr
- Down + closing
- —
- Monthly P&I
- —
- Monthly cashflow
- —
- DSCR
- —
- Eligible?
- —
No personal income docs; deal must DSCR.
Hard money
10% down · 12.0% · 12mo
- Down + closing
- —
- Monthly P&I
- —
- Monthly cashflow
- —
- DSCR
- —
- Eligible?
- —
Short-term bridge; refi at stabilization.
Listing history 13 events
-
2026-06-21days on market $159,900 Active 17 DOM
-
2026-06-18days on market $159,900 Active 15 DOM
-
2026-06-17days on market $159,900 Active 14 DOM
-
2026-06-16days on market $159,900 Active 13 DOM
-
2026-06-15days on market $159,900 Active 12 DOM
-
2026-06-13days on market $159,900 Active 10 DOM
-
2026-06-12days on market $159,900 Active 9 DOM
-
2026-06-09days on market $159,900 Active 6 DOM
-
2026-06-08days on market $159,900 Active 5 DOM
-
2026-06-07days on market $159,900 Active 4 DOM
-
2026-06-07days on market $159,900 Active 3 DOM
-
2026-06-04remarks 699-char remark
-
2026-06-04$159,900 Active 1 DOM
ⓘ Source: listings_history table (triggers on properties + properties_extension) + one-shot
backfill from property_details.listing_events for pre-trigger history.
Tax reassessment forecast KY · Resets to sale price
- Current annual tax
- $940 · $78/mo
- Projected year-2 tax
- $1,375 · $115/mo
- Expected delta
- +$435/yr (+$36/mo · 46.3%)
ⓘ Screening estimate from a state-policy table — verify with the county assessor before closing.
Climate risk First Street
- Flood 1/10 Low FEMA zone X (unshaded) · 0% chance over 30 yrs
- Wildfire 5/10 Major
- Heat 4/10 Moderate 7 d/yr ≥101°F today · 20 d/yr by 30 yrs out
- Wind 3/10 Moderate 7% chance of damaging wind over 30 yrs
- Air quality 1/10 Low 0 unhealthy d/yr today · 0 by 30 yrs out
Nearby sold comps map
Loading sold comps map…
Walkable amenities ~0.75 mi
Loading nearby amenities…
Taxation est. · year 1
- Rental income
- $18,712
- − Mortgage interest
- −$8,957
- − Property taxes
- −$940
- − Insurance
- −$800
- − Repairs & maintenance
- −$1,497
- − Management
- −$1,497
- − Depreciation
- −$4,652
- Taxable income
- $370
- Est. tax owed @ 24.0%
- −$89
- After-tax cash flow
- $2,892/yr
For passive investors: Depreciation is non-cash, so a rental often shows a tax loss while cash-flowing — sheltering income. Rental losses are passive: they offset passive income freely, and up to $25,000/yr can offset ordinary (W-2) income if you actively participate and your MAGI is under $100k (phasing out to $0 by $150k); unused losses carry forward. On sale, claimed depreciation is recaptured at up to 25%, and gains may owe capital-gains tax (a 1031 exchange can defer both). Figures are a year-1 estimate at your 24.0% rate — not tax advice; consult a CPA.
Schools (NCES district)
- District
- Pulaski County
- NCES district ID
- 2104950
- Math proficiency
- 43% ▼ -18.00%
- Reading proficiency
- 53% ▼ -13.00%
- Median HH income
- $35,366
- Composite
- 39.69/100
- National rank
- #3906
- State rank
- #17 of 165 in KY
Livability — Eubank
- Score
- 65/100
- State rank
- #262
- US rank
- #12947
Category grades
Schools grade is shown separately in the Schools card above.
Census & demographics
- Population (ZIP)
- 5,150
Population outlook (Pulaski County) Hauer SSP2
- Today (2025)
- 65,414 people
- By 2030
- 65,828 · +0.6%
- By 2040
- 65,972 · +0.9%
- By 2050
- 65,108 · -0.5%
- By 2075
- 61,647 · -5.8%
- By 2100
- 53,613 · -18.0%
Race, ethnicity, and origin ACS 2023
- Neighborhood character
- Predominantly White (92%)
- Race & ethnicity
- White 92% Two or more races 5% Hispanic / Latino 3%
- Common ancestry
- Lithuanian 2% Italian 2% Slovak 1%
- Foreign-born
- 2% · Canada
- Languages at home
- 96% English-only · Spanish 3% German/W. Germanic 2%
Political lean MEDSL · Pulaski
- 2024 margin
- Solid R (+65.2) · D 16.9% · R 82.1% · Other 1.0%
- 2008→2024 swing
- -9.9pp toward R · 2008: -55.4pp · 2024: -65.2pp
- All cycles
- 2024: R+65.2 2020: R+62.7 2016: R+66.7 2012: R+60.5 2008: R+55.4
Not yet ingested
- Civics
- —
Market trends
- HPI YoY
- ▲ 2.28%
- Current HPI
- 263.9851
- Rent YoY
- —
- Metro
- —
- State GDP YoY
- ▲ 1.81%
- F500 in state
- 4
Industry mix (Fortune 500 HQ in KY)
| Industry | F500 HQs | Revenue |
|---|---|---|
| Healthcare | 1 | $118B |
|
||
| Food / Beverage | 1 | $7B |
|
||
Price history
+2680.9% since first listed15 events — show timeline
- 2026-06-01 Listed $159,900 ImagineMLS
- 2026-01-23 Listing Removed — ImagineMLS
- 2025-12-29 Price Changed $150,900 ImagineMLS
- 2025-12-16 Price Changed $159,900 ImagineMLS
- 2025-11-24 Price Changed $164,900 ImagineMLS
- 2025-10-23 Listed $169,900 ImagineMLS
- 2023-10-06 Sold (MLS) $130,000 ImagineMLS
- 2023-09-07 Contingent — ImagineMLS
- 2023-08-26 Price Changed $140,000 ImagineMLS
- 2023-06-01 Price Changed $145,000 ImagineMLS
- 2023-05-03 Listed $150,000 ImagineMLS
- 2020-06-03 Sold (Public Records) $12,000 Public Records
- 2020-06-03 Sold (MLS) $12,000 ImagineMLS
- 2020-01-17 Listed $12,500 ImagineMLS
- 2007-08-15 Sold (Public Records) $5,750 Public Records
Property tax history
+31.8%/yrLatest (2025): $940 · -2.3% YoY. Source: county tax records.
Cash-flow waterfall
monthlySold comps — $/sqft
last 12 mo · ≤1 miLoading sold comps…