32 Cassie Ln · Bennington, VT
Flood risk 1/10 · Minimal
- FEMA flood zone
- X
- Chance of flooding over 30 yrs
- 0.0%
- Est. flood insurance / yr
- $508 – $851
Fire risk 1/10 · Minimal
- Est. fire insurance / yr
- $480 – $892
Heat risk 2/10 · Minimal
- Hot days now (above threshold)
- 7 days/yr
- Hot days in 30 yrs
- 15 days/yr
Wind risk No data
- Chance of severe wind over 30 yrs
- —
Air-quality risk 2/10 · Minimal
- Unhealthy air days now
- 0 days/yr
- Unhealthy air days in 30 yrs
- 1 days/yr
Risk factors via First Street. Map © Google.
Why this score? — see what drove the B- grade
The composite is a weighted blend of 9 inputs, each scored 0–100. Each bar is that input's sub-score; the figure is the points it added to the 100-point composite (weight × sub-score).
- Cash flow +27.3/30.0
- 1% rule +10.0/10.0
- DSCR +9.5/10.0
- ARV discount +7.5/15.0
- Schools +5.0/10.0
- Livability +3.2/5.0
- Rent growth +2.5/5.0
- Condition / age +2.5/5.0
- Appreciation +0.0/10.0
$96,406
🖨 Deal sheet 📄 Offer letter ✓ Due diligence
Listing remarks
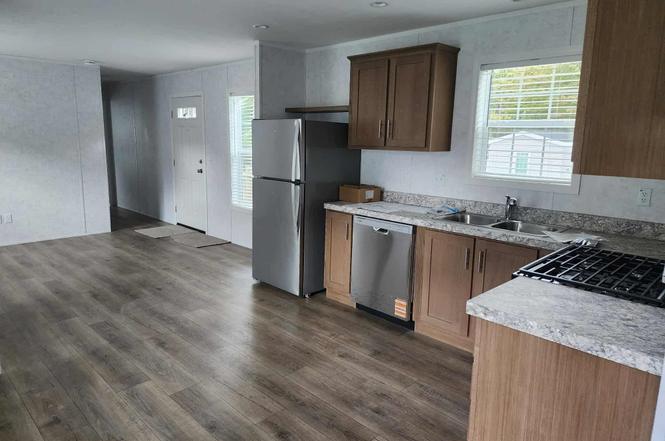
Welcome to 32 Cassie Lane, Bennington, VT, where modern comfort meets affordability in Catamount Park! This brand-new Redman NWS F25206-58 model manufactured home offers 2 bedrooms, 2 bathrooms, and 777 sq. ft. (13'4"x58) of thoughtfully designed living space. Step inside to an open-concept layout with stylish finishes, a bright living area, and a well-appointed kitchen. The home features energy-efficient construction, modern appliances, and low-maintenance materials, making it perfect for easy living. Located in a peaceful and well-maintained community, this home is ideal for those looking for a move-in-ready option in a convenient location. Don’t miss out on this opportunity! C
Key facts
- Built 2025
- Listed 344 days
Property features AI
Finance
- HOA & community: Park-approved for placement at Catamount Park; Monthly park fee of 374 which includes landscaping, plowing, sewer, trash and water (plus other); Mobile park approval in place
Exterior
- Parking: Driveway parking (dirt)
- Utilities: Public water; Public sewer; 100 amp electrical service with circuit breakers; High-speed internet available; Cable available; Telephone service available
- Home design: Manufactured home (Manuf/Mobile style); New construction (2025); Vinyl exterior siding; Asphalt shingle roof
- Construction: Manufactured construction; Year built 2025; Vinyl siding; Shingle (asphalt) roof
- Exterior features: Level lot; Dirt driveway
Interior
- Kitchen: Dishwasher; Microwave; Refrigerator; Electric stove
- Bedrooms: 2 bedrooms on the main level
- Flooring: Laminate flooring; Vinyl plank flooring
- Bathrooms: 2 full bathrooms
- Heating & cooling: Propane heat; Forced air system; Hot air
- Interior features: 4 total rooms; Laminate and vinyl plank flooring
- Laundry & utility: Energy Star washer; Energy Star dryer
Neighborhood map
What this means for you Summary
Snapshot
- This is a 2-bed/2.0-bath manufactured listed at $96k.
Deal economics
- At list price, monthly cash flow is $279 ($3k/yr) — positive.
- The deal already cash-flows at list — no discount required.
- Meets the 1% rule at list price ($2k rent vs $96k).
- Recommended offer: $85k (12.0% below list) — sets the bar for market timing.
- Cap rate 9.8% vs local median 5.4% in Bennington — top-decile yield for the area; either an underpriced asset or a hidden risk that comps aren't pricing in. Stress-test before assuming the spread holds.
Location & tenants
- Location reads 64/100 on livability (#63 in VT) — a middle-class / working-renter tenant base. Strengths: housing A+, health & safety A+, cost of living A; Watch: employment C-, crime D, schools F.
- Market conditions: 65 active listings in the ZIP; 59 units permitted in Bennington County in 2024 (0 in 5+ unit buildings).
- This rent runs 34% of the median local income ($60k/yr) — at the standard rent-burdened threshold; future hikes will face affordability resistance.
Forward outlook
- Local home prices are declining (-3.0%/yr); year-one equity from $666 of loan paydown is wiped out by about $3k of value loss. Plan a longer hold.
- Bennington County population projected at -23% by 2050 — secular population decline; favor cash flow + early exit over multi-decade hold.
- At projected returns (-3.0% appreciation + 3.0% rent growth), your $27k cash investment doubles in ~9 years — after that, you're playing with house money.
Negotiation context
- It's been on market 345 days — a 12% lower offer ($85k) is reasonable based on typical stale-listing flexibility.
- 3 sale attempts with the ask held roughly flat each time — persistent listings suggest the price (not the market) is what's stuck; bring a comps-based counter.
Risks & watch-outs
- Watch-outs: HOA is 22% of rent.
Questions for the listing agent
- It's been on market 345 days. Have you received any prior offers? Is the seller open to a 12% concession, seller financing, or rate buy-down credit?
- What does the HOA fee cover, when was the last increase, and are there any pending special assessments or reserve-fund shortfalls?
- Why hasn't it sold? Are there any deal-killer items the seller is aware of (foundation, flood, title, zoning, code violations)?
- Is there a deadline driving the sale (1031 exchange, divorce, estate, relocation)? That informs how much negotiation room exists.
- Schools are F-rated, which usually means shorter tenancies and higher turnover. Who's the typical renter profile here, and what's been the actual vacancy rate?
- Crime grade is D in this area — have there been break-ins, vandalism, or insurance claims at this property in the last 3 years? What carrier currently insures it and at what premium?
- What's the average days-on-market for RENTAL listings here right now (not sales)? A rising rental-DOM trend means longer vacancies and softer asking-rent achievability than the comps imply.
- What's the recent tenant-quality profile in this submarket — average credit score on applications, eviction rate, late-payment / NSF rate, and stable-employment percentage? A property-management company in the area should have these aggregated.
- How much new for-sale + rental construction is in the pipeline within 1–3 miles? Heavy new supply typically softens prices + rents 12–24 months out; constrained supply supports both.
Investment metrics
- 1% rule
- 1.73% ✓
- Cap rate
- 9.76%
- Cash-on-cash
- 12.39%
- DSCR
- 1.55
- GRM
- 4.8
CMA / ARV
- ARV (on-the-fly)
- $96,348
- Comps found
- 6
Show comp detail 6 sales within ~0.75 mi
| Address | Dist | Beds/Ba | Sqft | Sold | Price | $/sf | Match |
|---|---|---|---|---|---|---|---|
| 24 Cassie Ln | 0.01mi | 2/2.0 | 777 (0%) | 5mo | $96,906 | $125 | 96 |
| 29 Dustin Dr | 0.05mi | 2/2.0 | 777 (0%) | 9mo | $96,906 | $125 | 90 |
| 64 Ethans Way | 0.11mi | 2/1.0 | 746 (-4%) | 5mo | $89,499 | $120 | 80 |
| 92 Ethans Way | 0.13mi | 2/2.0 | 746 (-4%) | 9mo | $89,499 | $120 | 80 |
| 86 Ethans Way Lot 86E | 0.12mi | 2/2.0 | 825 (+6%) | 9mo | $101,968 | $124 | 76 |
| 72 Ethans Way | 0.11mi | 2/1.0 | 825 (+6%) | 9mo | $89,499 | $108 | 73 |
Match score weights: distance 35% · size 25% · config 20% · recency 20%. Top-matched comps best support the ARV.
Projected returns pro-forma
-3.0% appreciation · 3.0% rent growth · sell at horizon
- IRR
- 2.3%
- Equity multiple
- 1.09×
- Total profit
- $2,382
- Equity at exit
- $14,374
- IRR
- 12.1%
- Equity multiple
- 1.96×
- Total profit
- $25,965
- Equity at exit
- $8,335
Cash invested: $26,994 (down + closing). Projections, not guarantees.
Landlord ↔ Tenant lean methodology
- Overall (STATE)
- 41 Moderately Tenant-Leaning
- State Vermont
- 41 Moderately Tenant-Leaning · D+15
- County
- — inherits STATE
- City
- — inherits STATE
ZIP-level market 05201
- Home prices YoY
- -19.3%
- Active inventory
- 65
- Price-to-rent
- 4.8×
Monthly cashflow live
- Estimated rent
- $1,670 medium interval (Pro) →
- Mortgage (P&I)
- −$506
- Tax est. 1.5%
- −$121 /mo · $1,446/yr
- Insurance
- −$40
- HOA
- −$374
- Vacancy / Maint / Mgmt
- −$351
- Net cashflow
- $279
Break-even live
UW: 25.0% down · 7.5% · 30yr · 1.5% tax · 5.0% vac · 8.0% maint · 8.0% mgmt
Financing live
Cash to close
- Down payment
- $24,102
- Closing costs
- $2,892
- Reserves months
- —
- Total cash needed
- —
Loan-product check · same deal, 3 products live
Conventional
25% down · 7.5% · 30yr
- Down + closing
- —
- Monthly P&I
- —
- Monthly cashflow
- —
- DSCR
- —
- Eligible?
- —
Personal DTI + credit; lowest rate.
DSCR
20% down · 8.5% · 30yr
- Down + closing
- —
- Monthly P&I
- —
- Monthly cashflow
- —
- DSCR
- —
- Eligible?
- —
No personal income docs; deal must DSCR.
Hard money
10% down · 12.0% · 12mo
- Down + closing
- —
- Monthly P&I
- —
- Monthly cashflow
- —
- DSCR
- —
- Eligible?
- —
Short-term bridge; refi at stabilization.
HOA detail
- Monthly dues
- $374 · $4,488/yr
Listing history 21 events
-
2026-06-19days on market $96,406 Active 345 DOM
-
2026-06-18days on market $96,406 Active 344 DOM
-
2026-06-17days on market $96,406 Active 343 DOM
-
2026-06-16days on market $96,406 Active 342 DOM
-
2026-06-15days on market $96,406 Active 341 DOM
-
2026-06-14days on market $96,406 Active 339 DOM
-
2026-06-12days on market $96,406 Active 338 DOM
-
2026-06-09days on market $96,406 Active 335 DOM
-
2026-06-08days on market $96,406 Active 334 DOM
-
2026-06-07days on market $96,406 Active 333 DOM
-
2026-06-07days on market $96,406 Active 332 DOM
-
2026-06-04days on market $96,406 Active 329 DOM
-
2026-06-02days on market $96,406 Active 328 DOM
-
2026-06-01days on market $96,406 Active 327 DOM
-
2026-05-31days on market $96,406 Active 326 DOM
-
2026-05-31days on market $96,406 Active 325 DOM
-
2026-05-07status Active
-
2026-04-24historical Active with Contract
-
2025-08-05status Active
-
2025-07-09historical Active with Contract
-
2025-07-09$96,406 Active
ⓘ Source: listings_history table (triggers on properties + properties_extension) + one-shot
backfill from property_details.listing_events for pre-trigger history.
Climate risk First Street
- Flood 1/10 Low FEMA zone X · 0% chance over 30 yrs
- Wildfire 1/10 Low
- Heat 2/10 Low
- Air quality 2/10 Low 0 unhealthy d/yr today · 1 by 30 yrs out
Nearby sold comps map
Loading sold comps map…
Walkable amenities ~0.75 mi
Loading nearby amenities…
Taxation est. · year 1
- Rental income
- $20,034
- − Mortgage interest
- −$5,400
- − Property taxes
- −$1,446
- − Insurance
- −$482
- − Repairs & maintenance
- −$1,603
- − Management
- −$1,603
- − HOA
- −$4,488
- − Depreciation
- −$2,805
- Taxable income
- $2,208
- Est. tax owed @ 24.0%
- −$530
- After-tax cash flow
- $2,814/yr
For passive investors: Depreciation is non-cash, so a rental often shows a tax loss while cash-flowing — sheltering income. Rental losses are passive: they offset passive income freely, and up to $25,000/yr can offset ordinary (W-2) income if you actively participate and your MAGI is under $100k (phasing out to $0 by $150k); unused losses carry forward. On sale, claimed depreciation is recaptured at up to 25%, and gains may owe capital-gains tax (a 1031 exchange can defer both). Figures are a year-1 estimate at your 24.0% rate — not tax advice; consult a CPA.
Schools (NCES district)
No district data.
Livability — Bennington
- Score
- 64/100
- State rank
- #63
- US rank
- #14446
Category grades
Schools grade is shown separately in the Schools card above.
Census & demographics
- County
- Bennington County · 14,998 people
- City population
- 14,998
- Metro
- Bennington, VT
- Population (ZIP)
- 14,998
- Household income
- $59,798
- Rent vs Own
- Severe rent burden
- 982.0
Population outlook (Bennington County) Hauer SSP2
- Today (2025)
- 34,407 people
- By 2030
- 32,975 · -4.2%
- By 2040
- 29,711 · -13.6%
- By 2050
- 26,638 · -22.6%
- By 2075
- 21,318 · -38.0%
- By 2100
- 16,086 · -53.2%
Race, ethnicity, and origin ACS 2023
- Neighborhood character
- Predominantly White (92%)
- Race & ethnicity
- White 92% Two or more races 4% Hispanic / Latino 3%
- Common ancestry
- Lithuanian 10% Slovak 7% Romanian 3%
- Foreign-born
- 2% · Canada
- Languages at home
- 96% English-only · Spanish 2% Other Indo-European 1%
Political lean MEDSL · Bennington
- 2024 margin
- Strong D (+22.5) · D 60.0% · R 37.5% · Other 2.6%
- 2008→2024 swing
- -10.9pp toward R · 2008: 33.4pp · 2024: 22.5pp
- All cycles
- 2024: D+22.5 2020: D+27.3 2016: D+22.1 2012: D+33.3 2008: D+33.4
Not yet ingested
- Civics
- —
Market trends
- HPI YoY
- ▼ -60.78%
- Current HPI
- 254.5149
- Rent YoY
- —
- Metro
- Bennington, VT
- State GDP YoY
- —
- F500 in state
- 0
Price history
5 events — show timeline
- 2026-05-07 Relisted — PrimeMLS
- 2026-04-24 Contingent — PrimeMLS
- 2025-08-05 Relisted — PrimeMLS
- 2025-07-09 Contingent — PrimeMLS
- 2025-07-09 Listed $96,406 PrimeMLS
Cash-flow waterfall
monthlySold comps — $/sqft
last 12 mo · ≤1 miLoading sold comps…