1400 W Marlette St #11 · Ione, CA
Flood risk No data
- FEMA flood zone
- —
- Chance of flooding over 30 yrs
- —
- Est. flood insurance / yr
- —
Fire risk No data
- Est. fire insurance / yr
- —
Heat risk No data
- Hot days now (above threshold)
- —
- Hot days in 30 yrs
- —
Wind risk No data
- Chance of severe wind over 30 yrs
- —
Air-quality risk No data
- Unhealthy air days now
- —
- Unhealthy air days in 30 yrs
- —
Risk factors via First Street. Map © Google.
Why this score? — see what drove the C grade
The composite is a weighted blend of 9 inputs, each scored 0–100. Each bar is that input's sub-score; the figure is the points it added to the 100-point composite (weight × sub-score).
- Cash flow +30.0/30.0
- DSCR +10.0/10.0
- 1% rule +8.1/10.0
- Livability +3.1/5.0
- Schools +2.7/10.0
- Rent growth +2.5/5.0
- Condition / age +2.5/5.0
- ARV discount +0.0/15.0
- Appreciation +0.0/10.0
$199,950
🖨 Deal sheet 📄 Offer letter ✓ Due diligence
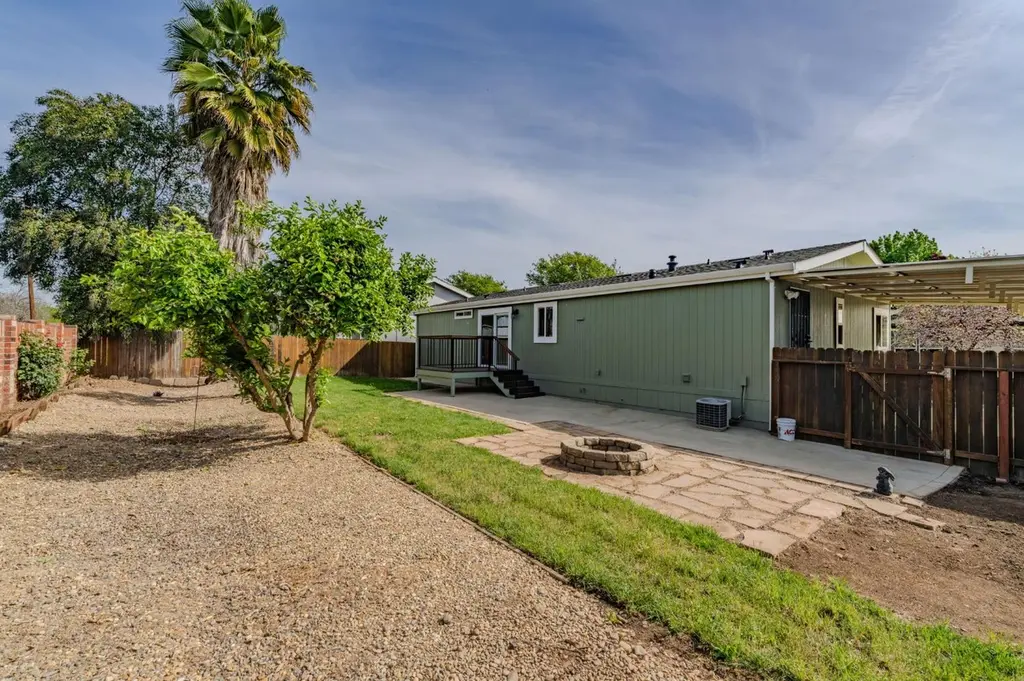
Listing remarks
Beautifully updated 3-bedroom, 2-bath manufactured home in the desirable Castle Park community. This light-filled residence offers an open-concept layout connecting the living, dining, and kitchen areasideal for both everyday living and entertaining. Recent upgrades include a brand new roof, new interior and exterior paint, new carpet in all bedrooms, new ceiling fans throughout, a new sliding glass door, new front door, and a newly built deck and porch. The private backyard with fire pit provides a perfect setting for outdoor enjoyment. Community amenities include a pool, sport courts, and clubhouse. Move-in ready with thoughtful updates throughout, offering comfort, style, and convenience
Key facts
- New carpet
- New exterior paint
- New interior paint
Tags
Neighborhood map
What this means for you Summary
Snapshot
- This is a 3-bed/2.0-bath manufactured listed at $200k.
Deal economics
- At list price, monthly cash flow is $890 ($11k/yr) — positive.
- The deal already cash-flows at list — no discount required.
- Meets the 1% rule at list price ($3k rent vs $200k).
- Recommended offer: $188k (6.0% below list) — sets the bar for market timing.
- Cap rate 11.6% vs local median 3.3% in Ione — top-decile yield for the area; either an underpriced asset or a hidden risk that comps aren't pricing in. Stress-test before assuming the spread holds.
Location & tenants
- Location reads 62/100 on livability (#490 in CA) — a middle-class / working-renter tenant base. Strengths: housing A+, employment A-, crime B+; Watch: schools F, amenities F, commute F.
- Amador County Unified (town): math 23% / reading 37% proficiency, ranked #330 of 517 in CA (top 64%) — families likely to look elsewhere, expect single-tenant / working-renter base with shorter leases.
- Market conditions: 119 active listings in the ZIP; 3 comparable units currently listed for rent nearby; rentals leasing fast (median 3d on market — plan ~1-2 weeks tenant-placement turnaround); 66 units permitted in Amador County in 2024 (0 in 5+ unit buildings).
Forward outlook
- Local home prices are declining (-3.0%/yr); year-one equity from $1k of loan paydown is wiped out by about $6k of value loss. Plan a longer hold.
- Amador County population projected at -15% by 2050 — secular population decline; favor cash flow + early exit over multi-decade hold.
- At projected returns (-3.0% appreciation + 3.0% rent growth), your $56k cash investment doubles in ~7 years — after that, you're playing with house money.
Negotiation context
- It's been on market 73 days — a 6% lower offer ($188k) is reasonable based on typical stale-listing flexibility.
Questions for the listing agent
- It's been on market 73 days. Have you received any prior offers? Is the seller open to a 6% concession, seller financing, or rate buy-down credit?
- Why hasn't it sold? Are there any deal-killer items the seller is aware of (foundation, flood, title, zoning, code violations)?
- Is there a deadline driving the sale (1031 exchange, divorce, estate, relocation)? That informs how much negotiation room exists.
- Schools are F-rated, which usually means shorter tenancies and higher turnover. Who's the typical renter profile here, and what's been the actual vacancy rate?
- What's the average days-on-market for RENTAL listings here right now (not sales)? A rising rental-DOM trend means longer vacancies and softer asking-rent achievability than the comps imply.
- What's the recent tenant-quality profile in this submarket — average credit score on applications, eviction rate, late-payment / NSF rate, and stable-employment percentage? A property-management company in the area should have these aggregated.
- How much new for-sale + rental construction is in the pipeline within 1–3 miles? Heavy new supply typically softens prices + rents 12–24 months out; constrained supply supports both.
Investment metrics
- 1% rule
- 1.31% ✓
- Cap rate
- 11.64%
- Cash-on-cash
- 19.09%
- DSCR
- 1.85
- GRM
- 6.4
CMA / ARV
- ARV (median comp)
- $157,347
- List price
- $199,950
- Delta
- 27.08%
- Verdict
- OVERPRICED
- Comps
- 20 within 1.0 mi
Show comp detail 2 sales within ~0.75 mi
| Address | Dist | Beds/Ba | Sqft | Sold | Price | $/sf | Match |
|---|---|---|---|---|---|---|---|
| 1400 W Marlette St #1 | 0.00mi | 3/2.0 | 2,400 (0%) | 5mo | $217,000 | $90 | 96 |
| 1400 W Marlette St #10 | 0.00mi | 3/2.0 | 2,080 (-13%) | 12mo | $225,000 | $108 | 68 |
Match score weights: distance 35% · size 25% · config 20% · recency 20%. Top-matched comps best support the ARV.
Projected returns pro-forma
-3.0% appreciation · 3.0% rent growth · sell at horizon
- IRR
- 10.9%
- Equity multiple
- 1.43×
- Total profit
- $24,225
- Equity at exit
- $29,813
- IRR
- 20.0%
- Equity multiple
- 2.67×
- Total profit
- $93,770
- Equity at exit
- $17,288
Cash invested: $55,986 (down + closing). Projections, not guarantees.
Landlord ↔ Tenant lean methodology
- Overall (STATE)
- 18 Strongly Tenant-Friendly
- State California
- 18 Strongly Tenant-Friendly · D+13
- County
- — inherits STATE
- City
- — inherits STATE
ZIP-level market 95640
- Active inventory
- 119
- Price-to-rent
- 6.4×
Monthly cashflow live
- Estimated rent
- $2,617 medium interval (Pro) →
- Mortgage (P&I)
- −$1,049
- Tax from tax record
- −$45 /mo · $544/yr
- Insurance
- −$83
- HOA
- −$0
- Vacancy / Maint / Mgmt
- −$550
- Net cashflow
- $890
Break-even live
UW: 25.0% down · 7.5% · 30yr · 1.5% tax · 5.0% vac · 8.0% maint · 8.0% mgmt
Financing live
Cash to close
- Down payment
- $49,988
- Closing costs
- $5,998
- Reserves months
- —
- Total cash needed
- —
Loan-product check · same deal, 3 products live
Conventional
25% down · 7.5% · 30yr
- Down + closing
- —
- Monthly P&I
- —
- Monthly cashflow
- —
- DSCR
- —
- Eligible?
- —
Personal DTI + credit; lowest rate.
DSCR
20% down · 8.5% · 30yr
- Down + closing
- —
- Monthly P&I
- —
- Monthly cashflow
- —
- DSCR
- —
- Eligible?
- —
No personal income docs; deal must DSCR.
Hard money
10% down · 12.0% · 12mo
- Down + closing
- —
- Monthly P&I
- —
- Monthly cashflow
- —
- DSCR
- —
- Eligible?
- —
Short-term bridge; refi at stabilization.
Rent comps 3 comps
| Address | Beds | Baths | Sqft | Rent | $/sqft | DOM | Units | Dist |
|---|---|---|---|---|---|---|---|---|
| 303 Pelican Hill Ct Ione, CA | 4.0 | 2.0 | 1877 | $2,600 | $1.39 | 43d | 1 | 0.40mi |
| 107 Ashworth Dr Ione, CA | 3.0 | 2.0 | 1671 | $2,495 | $1.49 | 3d | 1 | 0.46mi |
| 664 Morning Glory Cir Ione, CA | 4.0 | 2.5 | 2018 | $2,975 | $1.47 | 3d | 1 | 1.38mi |
Listing history 7 events
-
2026-06-08statusdays on market $199,950 Pending 73 DOM
-
2026-06-07days on market $199,950 Active 72 DOM
-
2026-06-05days on market $199,950 Active 69 DOM
-
2026-06-03days on market $199,950 Active 68 DOM
-
2026-06-02days on market $199,950 Active 67 DOM
-
2026-06-01days on market $199,950 Active 66 DOM
-
2026-05-31days on market $199,950 Active 65 DOM
ⓘ Source: listings_history table (triggers on properties + properties_extension) + one-shot
backfill from property_details.listing_events for pre-trigger history.
Tax reassessment forecast CA · Resets to sale price
- Current annual tax
- $544 · $45/mo
- Projected year-2 tax
- $1,520 · $127/mo
- Expected delta
- +$976/yr (+$81/mo · 179.4%)
ⓘ Screening estimate from a state-policy table — verify with the county assessor before closing.
Nearby sold comps map
Loading sold comps map…
Walkable amenities ~0.75 mi
Loading nearby amenities…
Taxation est. · year 1
- Rental income
- $31,407
- − Mortgage interest
- −$11,200
- − Property taxes
- −$544
- − Insurance
- −$1,000
- − Repairs & maintenance
- −$2,513
- − Management
- −$2,513
- − Depreciation
- −$5,817
- Taxable income
- $7,821
- Est. tax owed @ 24.0%
- −$1,877
- After-tax cash flow
- $8,808/yr
For passive investors: Depreciation is non-cash, so a rental often shows a tax loss while cash-flowing — sheltering income. Rental losses are passive: they offset passive income freely, and up to $25,000/yr can offset ordinary (W-2) income if you actively participate and your MAGI is under $100k (phasing out to $0 by $150k); unused losses carry forward. On sale, claimed depreciation is recaptured at up to 25%, and gains may owe capital-gains tax (a 1031 exchange can defer both). Figures are a year-1 estimate at your 24.0% rate — not tax advice; consult a CPA.
Schools (NCES district)
- District
- Amador County Unified
- NCES district ID
- 0602450
- Math proficiency
- 23% ▼ -9.00%
- Reading proficiency
- 37% ▼ -10.00%
- Median HH income
- $55,428
- Composite
- 26.67/100
- National rank
- #7163
- State rank
- #330 of 517 in CA
Livability — Ione
- Score
- 62/100
- State rank
- #490
- US rank
- #16616
Category grades
Schools grade is shown separately in the Schools card above.
Census & demographics
- Census place
- Ione, CA
- City population
- 12,811
- Population (ZIP)
- 12,811
Population outlook (Amador County) Hauer SSP2
- Today (2025)
- 35,295 people
- By 2030
- 34,147 · -3.3%
- By 2040
- 31,618 · -10.4%
- By 2050
- 29,913 · -15.2%
- By 2075
- 27,308 · -22.6%
- By 2100
- 23,465 · -33.5%
Race, ethnicity, and origin ACS 2023
- Neighborhood character
- Majority White (64%)
- Race & ethnicity
- White 64% Hispanic / Latino 21% Two or more races 17% Black 4% Native American 2%
- Hispanic origin (detail)
- Mexican 14%
- Common ancestry
- Italian 3% Slovak 3% Romanian 2%
- Foreign-born
- 7% · Canada
- Languages at home
- 85% English-only · Spanish 11% Arabic 2%
Political lean MEDSL · Amador
- 2024 margin
- Strong R (+27.8) · D 34.7% · R 62.6% · Other 2.7%
- 2008→2024 swing
- -13.2pp toward R · 2008: -14.6pp · 2024: -27.8pp
- All cycles
- 2024: R+27.8 2020: R+24.4 2016: R+25.2 2012: R+19.0 2008: R+14.6
Not yet ingested
- Civics
- —
Market trends
- HPI YoY
- ▼ -144.63%
- Current HPI
- 169.9705
- Rent YoY
- —
- Metro
- —
- State GDP YoY
- ▲ 3.21%
- F500 in state
- 116
Industry mix (Fortune 500 HQ in CA)
| Industry | F500 HQs | Revenue |
|---|---|---|
| Technology | 27 | $1,492B |
|
||
| Financial Services | 3 | $174B |
|
||
| Retail | 3 | $44B |
|
||
| Insurance | 3 | $26B |
|
||
| Media / Entertainment | 2 | $115B |
|
||
| Pharmaceuticals / Biotech | 2 | $62B |
|
||
Property tax history
+1.2%/yrLatest (2025): $544 · +1.9% YoY. Source: county tax records.
Cash-flow waterfall
monthlySold comps — $/sqft
last 12 mo · ≤1 miLoading sold comps…