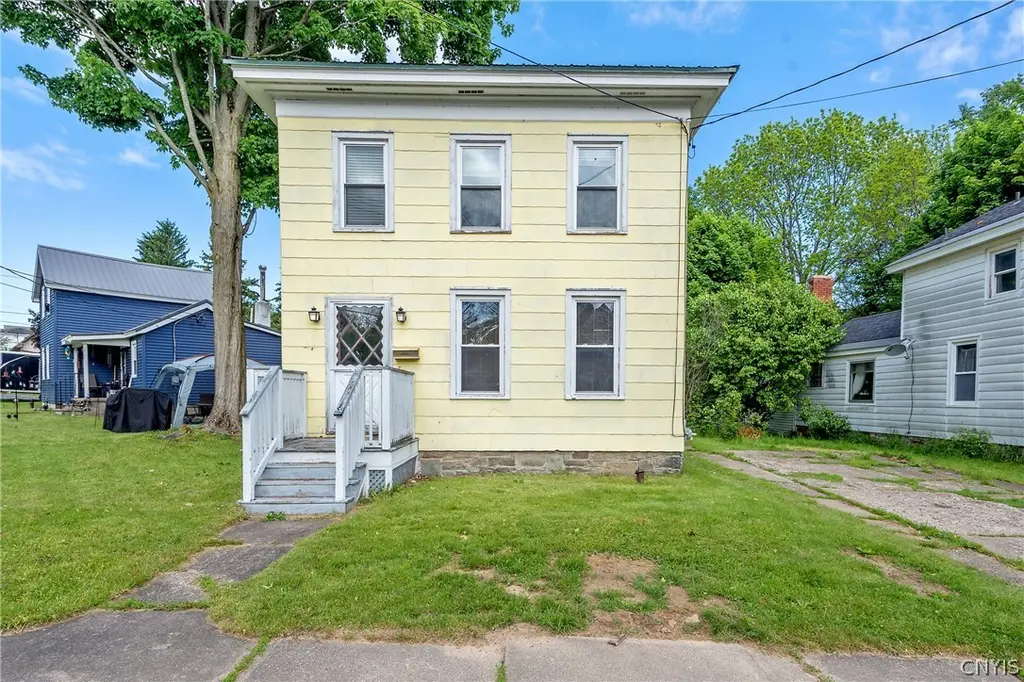
27 Ellen St · Oswego, NY
Flood risk 1/10 · Minimal
- FEMA flood zone
- X (unshaded)
- Chance of flooding over 30 yrs
- 0.0%
- Est. flood insurance / yr
- $473 – $860
Fire risk 1/10 · Minimal
- Est. fire insurance / yr
- $691 – $1,283
Heat risk 2/10 · Minimal
- Hot days now (above 94°F)
- 7 days/yr
- Hot days in 30 yrs
- 16 days/yr
Wind risk 1/10 · Minimal
- Chance of severe wind over 30 yrs
- 0.0%
Air-quality risk 2/10 · Minimal
- Unhealthy air days now
- 1 days/yr
- Unhealthy air days in 30 yrs
- 1 days/yr
Risk factors via First Street. Map © Google.
Why this score? — see what drove the C grade
The composite is a weighted blend of 9 inputs, each scored 0–100. Each bar is that input's sub-score; the figure is the points it added to the 100-point composite (weight × sub-score).
- Cash flow +24.7/30.0
- DSCR +8.0/10.0
- 1% rule +6.0/10.0
- Rent growth +5.0/5.0
- Appreciation +3.9/10.0
- Schools +3.8/10.0
- Livability +3.8/5.0
- Condition / age +2.5/5.0
- ARV discount +1.0/15.0
$175,000
🖨 Deal sheet 📄 Offer letter ✓ Due diligence
Listing remarks
Welcome to 27 Ellen Street! This home has been in the same family for generations and has been truly loved and cared for over the years and now it’s ready for its next owner to make memories of their own. The kitchen has been completely renovated and brought back to life, creating a bright, welcoming space to gather with family and friends. The main floor offers one bedroom, while upstairs you’ll find two additional bedrooms and a full bath. A new water heater is already in place, giving you one less thing to worry about. Situated on an oversized city lot, there’s plenty of room to enjoy summer BBQs, gardening, pets, playtime, or simply relaxing outdoors. Located in the Ki
Key facts
- Oversized city lot
- Minutes from schools
- 0.23 acre lot
Tags
Property features AI
Exterior
- Parking: No garage
- Utilities: Public water connected; Sewer connected
- Home design: 2-story existing structure; Resale property
- Construction: Stone foundation; Spray foam insulation; Construction details: see remarks
- Exterior features: Concrete driveway; Rectangular residential lot; City street frontage; Lot dimensions approximately 50 x 200
Interior
- Kitchen: Gas oven; Gas range; Microwave; Dishwasher; Refrigerator; Electric water heater
- Bedrooms: 1 main-level bedroom
- Flooring: Hardwood; Laminate; Varies
- Bathrooms: 1 full bathroom
- Heating & cooling: Gas heating; Hot water (boiler) heating; Has heating
- Interior features: Separate/formal dining room; Bedroom on main level; Partial basement
- Laundry & utility: Washer; Dryer; Main-level laundry; Gas water heater
Neighborhood map
What this means for you Summary
Snapshot
- This is a 3-bed/1.0-bath single-family listed at $175k.
Deal economics
- At list price, monthly cash flow is $364 ($4k/yr) — positive.
- The deal already cash-flows at list — no discount required.
- Meets the 1% rule at list price ($2k rent vs $175k).
- Recommended offer: $172k (1.5% below list) — sets the bar for market timing.
Location & tenants
- Location reads 75/100 on livability (#265 in NY, #4,189 nationally) — a middle-class / working-renter tenant base. Strengths: cost of living A+, housing A+, health & safety A+; Watch: schools D+, crime F, commute F.
- Oswego City School District (town): math 39% / reading 51% proficiency, ranked #465 of 590 in NY (top 79%) — families likely to look elsewhere, expect single-tenant / working-renter base with shorter leases.
- Market conditions: Rents rising fast (+19.2%/yr); 168 active listings in the ZIP; 24 comparable units currently listed for rent nearby; rentals leasing fast (median 13d on market — plan ~1-2 weeks tenant-placement turnaround); 172 units permitted in Oswego County in 2024 (27 in 5+ unit buildings).
- This rent runs 35% of the median local income ($65k/yr) — at the standard rent-burdened threshold; future hikes will face affordability resistance.
Forward outlook
- Local home prices are declining (-2.2%/yr); year-one equity from $1k of loan paydown is wiped out by about $4k of value loss. Plan a longer hold.
- Oswego County population projected at -23% by 2050 — secular population decline; favor cash flow + early exit over multi-decade hold.
- At projected returns (-2.2% appreciation + 8.0% rent growth), your $49k cash investment doubles in ~7 years — after that, you're playing with house money.
Negotiation context
- It's been on market 16 days — a 2% lower offer ($172k) is reasonable based on typical stale-listing flexibility.
Risks & watch-outs
- Watch-outs: built in 1900 — expect roof / HVAC / electrical / plumbing capex.
Questions for the listing agent
- Built in 1900 — when were the roof, HVAC, electrical panel, plumbing, and water heater last replaced?
- Is there a deadline driving the sale (1031 exchange, divorce, estate, relocation)? That informs how much negotiation room exists.
- Schools are D-rated, which usually means shorter tenancies and higher turnover. Who's the typical renter profile here, and what's been the actual vacancy rate?
- Crime grade is F in this area — have there been break-ins, vandalism, or insurance claims at this property in the last 3 years? What carrier currently insures it and at what premium?
- What's the average days-on-market for RENTAL listings here right now (not sales)? A rising rental-DOM trend means longer vacancies and softer asking-rent achievability than the comps imply.
- What's the recent tenant-quality profile in this submarket — average credit score on applications, eviction rate, late-payment / NSF rate, and stable-employment percentage? A property-management company in the area should have these aggregated.
- How much new for-sale + rental construction is in the pipeline within 1–3 miles? Heavy new supply typically softens prices + rents 12–24 months out; constrained supply supports both.
Investment metrics
- 1% rule
- 1.10% ✓
- Cap rate
- 8.79%
- Cash-on-cash
- 8.91%
- DSCR
- 1.40
- GRM
- 7.6
CMA / ARV
- ARV (on-the-fly)
- $152,880
- Comps found
- 12
Show comp detail 12 sales within ~0.75 mi
| Address | Dist | Beds/Ba | Sqft | Sold | Price | $/sf | Match |
|---|---|---|---|---|---|---|---|
| 9 Varick St | 0.16mi | 2/1.0 (-1) | 1,454 (+6%) | 1mo | $89,000 | $61 | 76 |
| 124 Ellen St | 0.39mi | 3/1.0 | 1,420 (+4%) | 4mo | $230,000 | $162 | 71 |
| 205 E 2nd St | 0.53mi | 3/1.0 | 1,368 (+0%) | 8mo | $75,000 | $55 | 68 |
| 81 Niagara St | 0.49mi | 3/1.0 | 1,305 (-4%) | 3mo | $120,000 | $92 | 67 |
| 221 W 7th St | 0.67mi | 3/1.0 | 1,398 (+2%) | 6mo | $70,000 | $50 | 60 |
| 27 Hart St | 0.60mi | 3/2.0 | 1,428 (+5%) | 3mo | $230,000 | $161 | 58 |
| 223 1/2 Syracuse Ave | 0.46mi | 3/1.0 | 1,242 (-9%) | 9mo | $84,900 | $68 | 56 |
| 226 E 2nd St | 0.46mi | 3/1.5 | 1,254 (-8%) | 9mo | $159,650 | $127 | 55 |
| 78 Varick St | 0.39mi | 2/2.0 (-1) | 1,180 (-14%) | 4mo | $132,500 | $112 | 47 |
| 440 W 5th St | 0.70mi | 3/1.0 | 1,180 (-14%) | 5mo | $180,000 | $153 | 41 |
| 51 E Albany St | 0.67mi | 3/2.5 | 1,540 (+13%) | 2mo | $179,900 | $117 | 39 |
| 225 W 7th St | 0.66mi | 4/2.0 (+1) | 1,538 (+13%) | 9mo | $147,000 | $96 | 32 |
Match score weights: distance 35% · size 25% · config 20% · recency 20%. Top-matched comps best support the ARV.
Projected returns pro-forma
-2.25% appreciation · 8.0% rent growth · sell at horizon
- IRR
- 5.0%
- Equity multiple
- 1.21×
- Total profit
- $10,525
- Equity at exit
- $31,973
- IRR
- 17.2%
- Equity multiple
- 2.84×
- Total profit
- $90,197
- Equity at exit
- $25,426
Cash invested: $49,000 (down + closing). Projections, not guarantees.
Landlord ↔ Tenant lean methodology
- Overall (STATE)
- 15 Strongly Tenant-Friendly
- State New York
- 15 Strongly Tenant-Friendly · D+10
- County
- — inherits STATE
- City
- — inherits STATE
ZIP-level market 13126
- Home prices YoY
- -0.8%
- Rents YoY
- 19.2%
- Active inventory
- 168
- Price-to-rent
- 7.6×
Monthly cashflow live
- Estimated rent
- $1,926 high interval (Pro) →
- Mortgage (P&I)
- −$918
- Tax from tax record
- −$167 /mo · $2,006/yr
- Insurance
- −$73
- HOA
- −$0
- Vacancy / Maint / Mgmt
- −$405
- Net cashflow
- $364
Break-even live
UW: 25.0% down · 7.5% · 30yr · 1.5% tax · 5.0% vac · 8.0% maint · 8.0% mgmt
Financing live
Cash to close
- Down payment
- $43,750
- Closing costs
- $5,250
- Reserves months
- —
- Total cash needed
- —
Loan-product check · same deal, 3 products live
Conventional
25% down · 7.5% · 30yr
- Down + closing
- —
- Monthly P&I
- —
- Monthly cashflow
- —
- DSCR
- —
- Eligible?
- —
Personal DTI + credit; lowest rate.
DSCR
20% down · 8.5% · 30yr
- Down + closing
- —
- Monthly P&I
- —
- Monthly cashflow
- —
- DSCR
- —
- Eligible?
- —
No personal income docs; deal must DSCR.
Hard money
10% down · 12.0% · 12mo
- Down + closing
- —
- Monthly P&I
- —
- Monthly cashflow
- —
- DSCR
- —
- Eligible?
- —
Short-term bridge; refi at stabilization.
Rent comps 24 comps
| Address | Beds | Baths | Sqft | Rent | $/sqft | DOM | Units | Dist |
|---|---|---|---|---|---|---|---|---|
| 4 Murray St Oswego, NY | 4.0 | 2.0 | 1589 | $1,800 | $1.13 | 13d | 1 | 0.13mi |
| 14 Pond Path Oswego, NY | 3.0 | 1.5 | 1408 | $2,300 | $1.63 | 13d | 1 | 0.33mi |
| 188 W 2nd St Unit 1 Oswego, NY | 2.0 | 1.0 | 900 | $1,695 | $1.88 | 21d | 1 | 0.71mi |
| 25 W Mohawk St Unit TH Oswego, NY | 3.0 | 1.0 | 1150 | $1,745 | $1.52 | 43d | 1 | 0.72mi |
| 165 W 3rd St Unit 3 Oswego, NY | 2.0 | 1.0 | 1000 | $1,445 | $1.45 | 43d | 1 | 0.73mi |
| 165 W 3rd St Unit 4 Oswego, NY | 2.0 | 1.0 | 1000 | $1,495 | $1.50 | 13d | 1 | 0.73mi |
| 105 W Oneida St Unit A Oswego, NY | 4.0 | 2.0 | 1800 | $2,540 | $1.41 | 13d | 1 | 0.92mi |
| 135 W Mohawk St Oswego, NY | 3.0 | 1.0 | 1103 | $1,700 | $1.54 | 13d | 1 | 0.92mi |
| 64 E 5th St Unit 1 Oswego, NY | 2.0 | 1.0 | 900 | $1,300 | $1.44 | 43d | 1 | 0.99mi |
| 143 Liberty St Unit A Oswego, NY | 4.0 | 2.0 | 1700 | $2,480 | $1.46 | 13d | 1 | 1.03mi |
| 130 W Bridge St Unit A Oswego, NY | 4.0 | 2.0 | 1700 | $2,500 | $1.47 | 13d | 1 | 1.04mi |
| 23 NW 9th St Oswego, NY | 4.0 | 1.5 | 1700 | $2,300 | $1.35 | 13d | 1 | 1.05mi |
| 6 Lathrop St Oswego, NY | 3.0 | 1.0 | 1100 | $1,725 | $1.57 | 13d | 1 | 1.07mi |
| 103 W 8th St Unit A Oswego, NY | 4.0 | 2.0 | 1800 | $2,400 | $1.33 | 13d | 1 | 1.08mi |
| 136 W Cayuga St Unit A Oswego, NY | 4.0 | 2.0 | 1600 | $2,300 | $1.44 | 13d | 1 | 1.11mi |
| 153 W Bridge St Unit A Oswego, NY | 4.0 | 1.5 | 1800 | $2,340 | $1.30 | 13d | 1 | 1.14mi |
| 141 W Cayuga St Oswego, NY | 4.0 | 1.0 | 1311 | $2,100 | $1.60 | 13d | 1 | 1.15mi |
| 161 W Bridge St Unit A Oswego, NY | 4.0 | 2.0 | 1400 | $2,240 | $1.60 | 13d | 1 | 1.17mi |
| 39 W 6th St Unit 2-A Oswego, NY | 3.0 | 1.0 | 1500 | $1,725 | $1.15 | 13d | 1 | 1.18mi |
| 85 Liberty St Unit A Oswego, NY | 4.0 | 2.0 | 1800 | $2,500 | $1.39 | 13d | 1 | 1.19mi |
| 148 W Seneca St Unit A Oswego, NY | 4.0 | 2.0 | 1800 | $2,400 | $1.33 | 13d | 1 | 1.21mi |
| 188 W Bridge St Oswego, NY | 4.0 | 1.0 | 1008 | $1,800 | $1.79 | 13d | 1 | 1.23mi |
| 153 W Seneca St Unit 1 Oswego, NY | 2.0 | 1.5 | 1000 | $1,540 | $1.54 | 43d | 1 | 1.25mi |
| 164 W Schuyler St Unit A Oswego, NY | 3.0 | 2.0 | 1400 | $1,755 | $1.25 | 13d | 1 | 1.33mi |
Listing history 11 events
-
2026-06-18days on market $175,000 Active 16 DOM
-
2026-06-17days on market $175,000 Active 15 DOM
-
2026-06-16days on market $175,000 Active 14 DOM
-
2026-06-15days on market $175,000 Active 13 DOM
-
2026-06-14days on market $175,000 Active 11 DOM
-
2026-06-13days on market $175,000 Active 10 DOM
-
2026-06-10days on market $175,000 Active 8 DOM
-
2026-06-08days on market $175,000 Active 6 DOM
-
2026-06-07days on market $175,000 Active 5 DOM
-
2026-06-03remarks 681-char remark
-
2026-06-03$175,000 Active 1 DOM
ⓘ Source: listings_history table (triggers on properties + properties_extension) + one-shot
backfill from property_details.listing_events for pre-trigger history.
Tax reassessment forecast NY · Partial reset (capped growth)
- Current annual tax
- $2,006 · $167/mo
- Projected year-2 tax
- $2,482 · $207/mo
- Expected delta
- +$476/yr (+$40/mo · 23.7%)
ⓘ Screening estimate from a state-policy table — verify with the county assessor before closing.
Climate risk First Street
- Flood 1/10 Low FEMA zone X (unshaded) · 0% chance over 30 yrs
- Wildfire 1/10 Low
- Heat 2/10 Low 7 d/yr ≥94°F today · 16 d/yr by 30 yrs out
- Wind 1/10 Low 0% chance of damaging wind over 30 yrs
- Air quality 2/10 Low 1 unhealthy d/yr today · 1 by 30 yrs out
Nearby sold comps map
Loading sold comps map…
Walkable amenities ~0.75 mi
Loading nearby amenities…
Taxation est. · year 1
- Rental income
- $23,115
- − Mortgage interest
- −$9,803
- − Property taxes
- −$2,006
- − Insurance
- −$875
- − Repairs & maintenance
- −$1,849
- − Management
- −$1,849
- − Depreciation
- −$5,091
- Taxable income
- $1,642
- Est. tax owed @ 24.0%
- −$394
- After-tax cash flow
- $3,973/yr
For passive investors: Depreciation is non-cash, so a rental often shows a tax loss while cash-flowing — sheltering income. Rental losses are passive: they offset passive income freely, and up to $25,000/yr can offset ordinary (W-2) income if you actively participate and your MAGI is under $100k (phasing out to $0 by $150k); unused losses carry forward. On sale, claimed depreciation is recaptured at up to 25%, and gains may owe capital-gains tax (a 1031 exchange can defer both). Figures are a year-1 estimate at your 24.0% rate — not tax advice; consult a CPA.
Schools (NCES district)
- District
- Oswego City School District
- NCES district ID
- 3622050
- Math proficiency
- 39% ▼ -7.00%
- Reading proficiency
- 51% ▲ 9.00%
- Median HH income
- $45,835
- Composite
- 38.2/100
- National rank
- #4257
- State rank
- #465 of 590 in NY
Livability — Oswego
- Score
- 75/100
- State rank
- #265
- US rank
- #4189
Category grades
Schools grade is shown separately in the Schools card above.
Census & demographics
- Census place
- Oswego, NY
- County
- Oswego County · 36,495 people
- City population
- 36,495
- Metro
- Syracuse, NY
- Population (ZIP)
- 36,495
- Household income
- $65,346
- Rent vs Own
- Severe rent burden
- 1341.0
Population outlook (Oswego County) Hauer SSP2
- Today (2025)
- 114,465 people
- By 2030
- 109,968 · -3.9%
- By 2040
- 99,205 · -13.3%
- By 2050
- 87,979 · -23.1%
- By 2075
- 65,100 · -43.1%
- By 2100
- 47,117 · -58.8%
Race, ethnicity, and origin ACS 2023
- Neighborhood character
- Predominantly White (87%)
- Race & ethnicity
- White 87% Hispanic / Latino 5% Two or more races 5% Black 2% Asian 2%
- Hispanic origin (detail)
- Mexican 1% Puerto Rican 2%
- Common ancestry
- Romanian 6% Lithuanian 4% Italian 2%
- Foreign-born
- 3% · Canada
- Languages at home
- 93% English-only · Spanish 3% Other Asian/Pacific 1% Other Indo-European 1%
Political lean MEDSL · Oswego
- 2024 margin
- Strong R (+24.2) · D 37.9% · R 62.1%
- 2008→2024 swing
- -26.6pp toward R · 2008: 2.5pp · 2024: -24.2pp
- All cycles
- 2024: R+24.2 2020: R+20.2 2016: R+23.2 2012: D+7.9 2008: D+2.5
Not yet ingested
- Civics
- —
Market trends
- HPI YoY
- ▼ -2.25%
- Current HPI
- 295.5134
- Rent YoY
- ▲ 19.18%
- Metro
- Syracuse, NY
- State GDP YoY
- ▲ 2.60%
- F500 in state
- 92
Industry mix (Fortune 500 HQ in NY)
| Industry | F500 HQs | Revenue |
|---|---|---|
| Financial Services | 10 | $950B |
|
||
| Consumer Goods | 9 | $162B |
|
||
| Insurance | 4 | $225B |
|
||
| Telecommunications | 2 | $144B |
|
||
| Pharmaceuticals | 2 | $112B |
|
||
| Media / Entertainment | 2 | $69B |
|
||
Price history
1 event — show timeline
- 2026-06-02 Listed $175,000 CNYIS
Property tax history
+25.4%/yrLatest (2025): $2,006 · +48.0% YoY. Source: county tax records.
Cash-flow waterfall
monthlySold comps — $/sqft
last 12 mo · ≤1 miLoading sold comps…