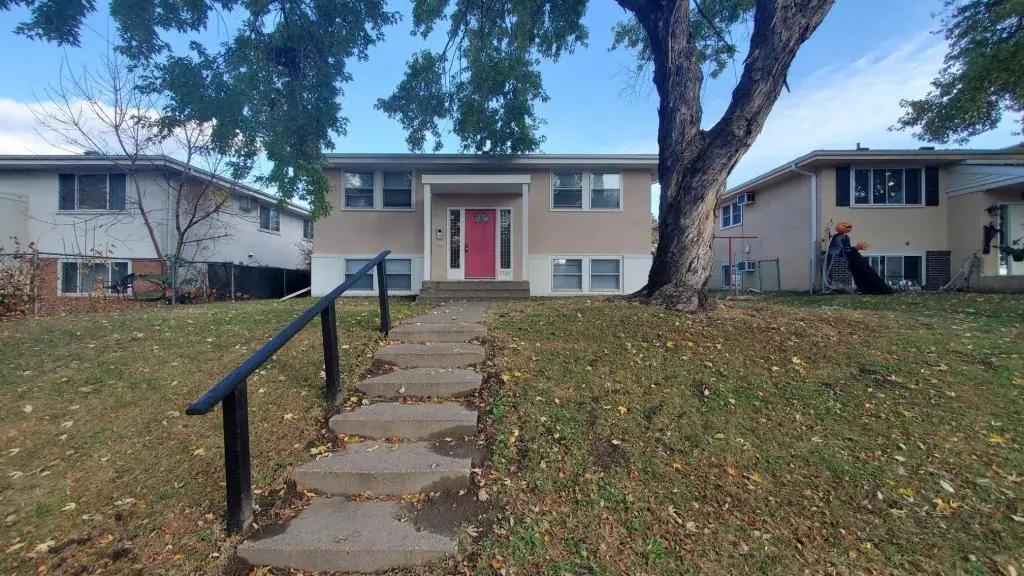
 Fourplex
5749 33rd Ave S · Minneapolis, MN
Flood risk 1/10 · Minimal
- FEMA flood zone
- X (unshaded)
- Chance of flooding over 30 yrs
- 0.0%
- Est. flood insurance / yr
- $473 – $860
Fire risk 1/10 · Minimal
- Est. fire insurance / yr
- $888 – $1,650
Heat risk 2/10 · Minimal
- Hot days now (above 98°F)
- 7 days/yr
- Hot days in 30 yrs
- 14 days/yr
Wind risk 2/10 · Minimal
- Chance of severe wind over 30 yrs
- —
Air-quality risk 2/10 · Minimal
- Unhealthy air days now
- 1 days/yr
- Unhealthy air days in 30 yrs
- 2 days/yr
Risk factors via First Street. Map © Google.
Why this score? — see what drove the B- grade
The composite is a weighted blend of 9 inputs, each scored 0–100. Each bar is that input's sub-score; the figure is the points it added to the 100-point composite (weight × sub-score).
- Cash flow +30.0/30.0
- 1% rule +10.0/10.0
- DSCR +10.0/10.0
- ARV discount +7.5/15.0
- Livability +3.9/5.0
- Schools +3.5/10.0
- Condition / age +2.5/5.0
- Rent growth +2.0/5.0
- Appreciation +0.0/10.0
$550,000
🖨 Deal sheet (PDF) 📄 Offer letter ✓ Due diligence
Multi-family units
County records classify this as Multi-Family (5+ Unit). Listing-text estimate: 4 units. estimate disagrees with records
5+ unit building — per-unit beds/baths from public records are typically unavailable; the breakdown below (if shown) is an estimate from the listing text.
Listing remarks MLS
Well-maintained 4 unit investment opportunity in South Minneapolis with major recent improvements already completed. Updates include a newer roof, newer driveway, and fresh paint throughout, reducing near-term capital expenditure for the next owner. Two units are currently occupied, providing immediate income, with the remaining two units offering strong upside through lease-up and rent growth potential. Each unit is separately metered for electricity, allowing for efficient expense management, and the property includes off-street parking for tenants. Conveniently located near Hwy 62 with easy access to public transportation, shopping, and local amenities, making it a desirable rental location. Ideal opportunity for an investor looking to stabilize and increase cash flow. All measurements and information are deemed reliable but not guaranteed. Buyer and buyer’s agent to verify all information.
Key facts
- Fresh paint
- Newer driveway
- Newer roof
Tags
Neighborhood map
What this means for you Summary
Snapshot
- This is a 4 × 7-bed/4.0-bath units multifamily listed at $550k.
Deal economics
- At list price, monthly cash flow is $3k ($34k/yr) — positive. Per door: $715/mo.
- The deal already cash-flows at list — no discount required.
- Meets the 1% rule at list price ($8k rent vs $550k).
- Recommended offer: $534k (3.0% below list) — sets the bar for market timing.
- Cap rate 12.5% vs local median 3.1% in Minneapolis — top-decile yield for the area; either an underpriced asset or a hidden risk that comps aren't pricing in. Stress-test before assuming the spread holds.
Location & tenants
- Location reads 78/100 on livability (#110 in MN, #2,525 nationally) — a middle-class / working-renter tenant base. Strengths: amenities A+, commute A+, housing A+; Watch: cost of living C-, crime F.
- Minneapolis Public School District (urban): math 35% / reading 46% proficiency, ranked #217 of 301 in MN (top 72%) — families likely to look elsewhere, expect single-tenant / working-renter base with shorter leases.
- Market conditions: Rents soft (-2.0%/yr); 139 active listings in the ZIP; high-income renter base; 4,651 units permitted in Hennepin County in 2024 (2,443 in 5+ unit buildings).
- At $8,336/mo this rent would consume 79% of the median local household income ($126k/yr) (locally 265% of renters already pay >50% of income on rent) — very limited rent-growth headroom before tenants either downsize or default.
Forward outlook
- Local home prices are declining (-3.0%/yr); year-one equity from $4k of loan paydown is wiped out by about $16k of value loss. Plan a longer hold.
- Hennepin County population projected at +30% by 2050 — long-run rental-demand tailwind backs the buy-and-hold thesis.
- At projected returns (-3.0% appreciation + 0.0% rent growth), your $154k cash investment doubles in ~7 years — after that, you're playing with house money.
Negotiation context
- It's been on market 33 days — a 3% lower offer ($534k) is reasonable based on typical stale-listing flexibility.
- 7 sale attempts since 31y ago with the ask held roughly flat each time — persistent listings suggest the price (not the market) is what's stuck; bring a comps-based counter.
Questions for the listing agent
- It's been on market 33 days. Have you received any prior offers? Is the seller open to a 3% concession, seller financing, or rate buy-down credit?
- Can we see the unit-by-unit rent roll, current vacancy, and any below-market leases? What's the average tenancy length?
- What capital expenditures (roof, boiler, parking lot, exteriors) have been made in the last 5 years, and what's planned in the next 2?
- Built in 1962 — when were the roof, HVAC, electrical panel, plumbing, and water heater last replaced?
- Is there a deadline driving the sale (1031 exchange, divorce, estate, relocation)? That informs how much negotiation room exists.
- Crime grade is F in this area — have there been break-ins, vandalism, or insurance claims at this property in the last 3 years? What carrier currently insures it and at what premium?
- What's the average days-on-market for RENTAL listings here right now (not sales)? A rising rental-DOM trend means longer vacancies and softer asking-rent achievability than the comps imply.
- What's the recent tenant-quality profile in this submarket — average credit score on applications, eviction rate, late-payment / NSF rate, and stable-employment percentage? A property-management company in the area should have these aggregated.
- How much new apartment / multifamily construction is in the pipeline within 1–3 miles? Heavy new supply (>2% of stock underway) typically softens rents 12–24 months out; light construction supports rent growth.
Investment metrics
- 1% rule
- 1.52% ✓
- Cap rate
- 12.54%
- Cash-on-cash
- 22.30%
- DSCR
- 1.99
- GRM
- 5.5
CMA / ARV
No comps found within radius.
Projected returns pro-forma
-3.0% appreciation · 0.0% rent growth · sell at horizon
- IRR
- 11.7%
- Equity multiple
- 1.45×
- Total profit
- $68,778
- Equity at exit
- $82,007
- IRR
- 18.2%
- Equity multiple
- 2.30×
- Total profit
- $200,477
- Equity at exit
- $47,554
Cash invested: $154,000 (down + closing). Projections, not guarantees.
Landlord ↔ Tenant lean methodology
- Overall (CITY)
- 34 Tenant-Leaning
- State Minnesota
- 46 Balanced · D+2
- County
- — inherits STATE
- City Minneapolis
- 34 Tenant-Leaning · D+50
ZIP-level market 55417
- Rents YoY
- -2.0%
- Active inventory
- 139
- Price-to-rent
- 22.0×
Monthly cashflow live
- Estimated rent
- $8,336 medium interval (Pro) →
- Mortgage (P&I)
- −$2,884
- Tax from tax record
- −$610 /mo · $7,326/yr
- Insurance
- −$229
- HOA
- −$0
- Vacancy / Maint / Mgmt
- −$1,751
- Net cashflow
- $2,862
Break-even live
Sensitivity live
| Price | -10% $3,173 | -5% $3,017 | +0% $2,862 | +5% $2,706 | +10% $2,550 |
|---|---|---|---|---|---|
| Rent | -10% $2,203 | -5% $2,532 | +0% $2,862 | +5% $3,191 | +10% $3,520 |
| Rate | -1.0pp $3,139 | -0.5pp $3,001 | base $2,862 | +0.5pp $2,719 | +1.0pp $2,574 |
4-unit breakdown (identical units grouped — click to expand)
| Units | Beds | Baths | Est. rent |
|---|---|---|---|
| 4× units | 7 | 4 | $8,336 |
| #1 | 7 | 4 | $2,084 |
| #2 | 7 | 4 | $2,084 |
| #3 | 7 | 4 | $2,084 |
| #4 | 7 | 4 | $2,084 |
| Total (4 units) | $8,336 | ||
UW: 25.0% down · 7.5% · 30yr · 1.5% tax · 5.0% vac · 8.0% maint · 8.0% mgmt
Financing live
Cash to close
- Down payment
- $137,500
- Closing costs
- $16,500
- Reserves months
- —
- Total cash needed
- —
Loan-product check · same deal, 3 products live
Conventional
25% down · 7.5% · 30yr
- Down + closing
- —
- Monthly P&I
- —
- Monthly cashflow
- —
- DSCR
- —
- Eligible?
- —
Personal DTI + credit; lowest rate.
DSCR
20% down · 8.5% · 30yr
- Down + closing
- —
- Monthly P&I
- —
- Monthly cashflow
- —
- DSCR
- —
- Eligible?
- —
No personal income docs; deal must DSCR.
Hard money
10% down · 12.0% · 12mo
- Down + closing
- —
- Monthly P&I
- —
- Monthly cashflow
- —
- DSCR
- —
- Eligible?
- —
Short-term bridge; refi at stabilization.
Listing history 24 events
-
2026-05-06status Pending 915-char remark
Show marketing remark (915 chars)
Well-maintained 4 unit investment opportunity in South Minneapolis with major recent improvements already completed. Updates include a newer roof, newer driveway, and fresh paint throughout, reducing near-term capital expenditure for the next owner. Two units are currently occupied, providing immediate income, with the remaining two units offering strong upside through lease-up and rent growth potential. Each unit is separately metered for electricity, allowing for efficient expense management, and the property includes off-street parking for tenants. Conveniently located near Hwy 62 with easy access to public transportation, shopping, and local amenities, making it a desirable rental location. Ideal opportunity for an investor looking to stabilize and increase cash flow. All measurements and information are deemed reliable but not guaranteed. Buyer and buyer’s agent to verify all information.
-
2026-05-04price $550,000 915-char remark
Show marketing remark (915 chars)
Well-maintained 4 unit investment opportunity in South Minneapolis with major recent improvements already completed. Updates include a newer roof, newer driveway, and fresh paint throughout, reducing near-term capital expenditure for the next owner. Two units are currently occupied, providing immediate income, with the remaining two units offering strong upside through lease-up and rent growth potential. Each unit is separately metered for electricity, allowing for efficient expense management, and the property includes off-street parking for tenants. Conveniently located near Hwy 62 with easy access to public transportation, shopping, and local amenities, making it a desirable rental location. Ideal opportunity for an investor looking to stabilize and increase cash flow. All measurements and information are deemed reliable but not guaranteed. Buyer and buyer’s agent to verify all information.
-
2026-04-02$575,000 Active 915-char remark
Show marketing remark (915 chars)
Well-maintained 4 unit investment opportunity in South Minneapolis with major recent improvements already completed. Updates include a newer roof, newer driveway, and fresh paint throughout, reducing near-term capital expenditure for the next owner. Two units are currently occupied, providing immediate income, with the remaining two units offering strong upside through lease-up and rent growth potential. Each unit is separately metered for electricity, allowing for efficient expense management, and the property includes off-street parking for tenants. Conveniently located near Hwy 62 with easy access to public transportation, shopping, and local amenities, making it a desirable rental location. Ideal opportunity for an investor looking to stabilize and increase cash flow. All measurements and information are deemed reliable but not guaranteed. Buyer and buyer’s agent to verify all information.
-
2026-03-25$1,375
-
2025-03-19soldstatus $545,000
-
2025-03-17soldstatus $545,000 Sold 405-char remark
Show marketing remark (405 chars)
New Roof. New Driveway. Fresh Paint! This is your opportunity to invest in a 4 unit building in South Minneapolis. Close to HWY 62 and easy access to buss line. Each unit has separate electricity and there is parking for each unit. Seller is a real estate agent but not the listing agent. All measurements and information deemed reliable but not guaranteed. Buyer and buyer's agent to confirm all details.
-
2025-02-03status Pending 405-char remark
Show marketing remark (405 chars)
New Roof. New Driveway. Fresh Paint! This is your opportunity to invest in a 4 unit building in South Minneapolis. Close to HWY 62 and easy access to buss line. Each unit has separate electricity and there is parking for each unit. Seller is a real estate agent but not the listing agent. All measurements and information deemed reliable but not guaranteed. Buyer and buyer's agent to confirm all details.
-
2025-01-20historical Contingent - Inspection 405-char remark
Show marketing remark (405 chars)
New Roof. New Driveway. Fresh Paint! This is your opportunity to invest in a 4 unit building in South Minneapolis. Close to HWY 62 and easy access to buss line. Each unit has separate electricity and there is parking for each unit. Seller is a real estate agent but not the listing agent. All measurements and information deemed reliable but not guaranteed. Buyer and buyer's agent to confirm all details.
-
2024-11-23$560,000 Active 405-char remark
Show marketing remark (405 chars)
New Roof. New Driveway. Fresh Paint! This is your opportunity to invest in a 4 unit building in South Minneapolis. Close to HWY 62 and easy access to buss line. Each unit has separate electricity and there is parking for each unit. Seller is a real estate agent but not the listing agent. All measurements and information deemed reliable but not guaranteed. Buyer and buyer's agent to confirm all details.
-
2005-07-12historical
-
2005-04-13$339,900
-
2002-11-27soldstatus $216,000
-
2002-11-01soldstatus $216,000
-
2002-10-10historical
-
2002-09-23$270,000
-
1999-06-18soldstatus $128,500
-
1996-12-26soldstatus $85,125
-
1996-12-02soldstatus $85,125
-
1996-11-19historical
-
1996-11-18$85,125
-
1995-09-25soldstatus $86,400
-
1995-08-10historical
-
1995-07-30$96,900
-
1993-12-31soldstatus $95,000
ⓘ Source: listings_history table (triggers on properties + properties_extension) + one-shot
backfill from property_details.listing_events for pre-trigger history.
Tax reassessment forecast MN · Partial reset (capped growth)
- Current annual tax
- $7,326 · $610/mo
- Projected year-2 tax
- $7,326 · $610/mo
- Expected delta
- $0/yr ($0/mo · 0.0%)
ⓘ Screening estimate from a state-policy table — verify with the county assessor before closing.
Climate risk First Street
- Flood 1/10 Low FEMA zone X (unshaded) · 0% chance over 30 yrs
- Wildfire 1/10 Low
- Heat 2/10 Low 7 d/yr ≥98°F today · 14 d/yr by 30 yrs out
- Wind 2/10 Low
- Air quality 2/10 Low 1 unhealthy d/yr today · 2 by 30 yrs out
Nearby sold comps map
Loading sold comps map…
Walkable amenities ~0.75 mi
Loading nearby amenities…
Taxation est. · year 1
- Rental income
- $100,032
- − Mortgage interest
- −$30,809
- − Property taxes
- −$7,326
- − Insurance
- −$2,750
- − Repairs & maintenance
- −$8,003
- − Management
- −$8,003
- − Depreciation
- −$16,000
- Taxable income
- $27,143
- Est. tax owed @ 24.0%
- −$6,514
- After-tax cash flow
- $27,824/yr
For passive investors: Depreciation is non-cash, so a rental often shows a tax loss while cash-flowing — sheltering income. Rental losses are passive: they offset passive income freely, and up to $25,000/yr can offset ordinary (W-2) income if you actively participate and your MAGI is under $100k (phasing out to $0 by $150k); unused losses carry forward. On sale, claimed depreciation is recaptured at up to 25%, and gains may owe capital-gains tax (a 1031 exchange can defer both). Figures are a year-1 estimate at your 24.0% rate — not tax advice; consult a CPA.
Schools (NCES district)
- District
- Minneapolis Public School District
- NCES district ID
- 2721240
- Math proficiency
- 35% ▼ -7.00%
- Reading proficiency
- 46% ▼ -1.00%
- Median HH income
- $50,521
- Composite
- 34.92/100
- National rank
- #5067
- State rank
- #217 of 301 in MN
Livability — Minneapolis
- Score
- 78/100
- State rank
- #110
- US rank
- #2525
Category grades
Schools grade is shown separately in the Schools card above.
Census & demographics
- Census place
- Minneapolis, MN
- County
- Hennepin County · 1,150,272 people
- City population
- 417,555
- Metro
- Minneapolis-St. Paul-Bloomington, MN-WI
- Population (ZIP)
- 25,102
- Household income
- $126,261
- Rent vs Own
- Severe rent burden
- 265.0
Population outlook (Hennepin County) Hauer SSP2
- Today (2025)
- 1,405,227 people
- By 2030
- 1,492,650 · +6.2%
- By 2040
- 1,660,157 · +18.1%
- By 2050
- 1,823,498 · +29.8%
- By 2075
- 2,221,283 · +58.1%
- By 2100
- 2,509,976 · +78.6%
Race, ethnicity, and origin ACS 2023
- Neighborhood character
- Predominantly White (78%)
- Race & ethnicity
- White 78% Hispanic / Latino 10% Two or more races 9% Black 5% Asian 2%
- Hispanic origin (detail)
- Mexican 8%
- Common ancestry
- Portuguese 15% Romanian 4% Lithuanian 3%
- Foreign-born
- 7% · Canada, South Korea, Jamaica
- Languages at home
- 90% English-only · Spanish 8% Other Asian/Pacific 1%
Political lean MEDSL · Hennepin
- 2024 margin
- Solid D (+42.6) · D 70.2% · R 27.5% · Other 2.3%
- 2008→2024 swing
- +14.0pp toward D · 2008: 28.6pp · 2024: 42.6pp
- All cycles
- 2024: D+42.6 2020: D+43.2 2016: D+35.3 2012: D+27.1 2008: D+28.6
Not yet ingested
- Civics
- —
Market trends
- HPI YoY
- ▼ -409.70%
- Current HPI
- 259.9141
- Rent YoY
- ▼ -1.97%
- Metro
- Minneapolis-St. Paul-Bloomington, MN-WI
- State GDP YoY
- ▲ 2.41%
- F500 in state
- 34
Industry mix (Fortune 500 HQ in MN)
| Industry | F500 HQs | Revenue |
|---|---|---|
| Healthcare | 2 | $407B |
|
||
| Retail | 2 | $150B |
|
||
| Consumer Goods | 2 | $32B |
|
||
| Industrial Machinery | 2 | $6B |
|
||
| Agriculture | 1 | $40B |
|
||
| Healthcare / Medical Devices | 1 | $32B |
|
||
Price history
+478.9% since first listed24 events — show timeline
- 2026-05-06 Pending — NORTHSTARMLS as Distributed by MLS Grid
- 2026-05-04 Price Changed $550,000 NORTHSTARMLS as Distributed by MLS Grid
- 2026-04-02 Listed $575,000 NORTHSTARMLS as Distributed by MLS Grid
- 2026-03-25 Listed for Rent $1,375 SHOWMOJO
- 2025-03-19 Sold (Public Records) $545,000 Public Records
- 2025-03-17 Sold (MLS) $545,000 NORTHSTARMLS as Distributed by MLS Grid
- 2025-02-03 Pending — NORTHSTARMLS as Distributed by MLS Grid
- 2025-01-20 Contingent — NORTHSTARMLS as Distributed by MLS Grid
- 2024-11-23 Listed $560,000 NORTHSTARMLS as Distributed by MLS Grid
- 2005-07-12 Listing Removed — NORTHSTARMLS as Distributed by MLS Grid
- 2005-04-13 Listed $339,900 NORTHSTARMLS as Distributed by MLS Grid
- 2002-11-27 Sold (Public Records) $216,000 Public Records
- 2002-11-01 Sold (MLS) $216,000 NORTHSTARMLS as Distributed by MLS Grid
- 2002-10-10 Listing Removed — NORTHSTARMLS as Distributed by MLS Grid
- 2002-09-23 Listed $270,000 NORTHSTARMLS as Distributed by MLS Grid
- 1999-06-18 Sold (Public Records) $128,500 Public Records
- 1996-12-26 Sold (Public Records) $85,125 Public Records
- 1996-12-02 Sold (MLS) $85,125 NORTHSTARMLS as Distributed by MLS Grid
- 1996-11-19 Listing Removed — NORTHSTARMLS as Distributed by MLS Grid
- 1996-11-18 Listed $85,125 NORTHSTARMLS as Distributed by MLS Grid
- 1995-09-25 Sold (MLS) $86,400 NORTHSTARMLS as Distributed by MLS Grid
- 1995-08-10 Listing Removed — NORTHSTARMLS as Distributed by MLS Grid
- 1995-07-30 Listed $96,900 NORTHSTARMLS as Distributed by MLS Grid
- 1993-12-31 Sold (Public Records) $95,000 Public Records
Property tax history
+4.9%/yrLatest (2025): $7,326 · +10.6% YoY. Source: county tax records.
Cash-flow waterfall
monthlySold comps — $/sqft
last 12 mo · ≤1 miLoading sold comps…